Understanding Risk Management in TradingWelcome everyone back to Trading view article by King_BennyBag.
In today’s post we will discuss how one can understand risk management in trading, and action it.
We will start off by defining what risk management is.
Risk management definition:
Risk management is the process of identifying your current capital and assessing what you can afford to invest and lose. Never to see again.
It involves identifying risks, assuming risks and ensuring you have a planned response for before, during and after a trade.
CAPITAL IN RISK MANAGEMENT:
In the past, I have stated that the goal of trading is to “PROTECT” your capital first. Once you know how to protect it, you can then multiply it and risk bit by bit.
To take on proper risk management, you must decide what amount you will allocate to your investments or trades. For example – you risk only 1% of your capital on every trade.
INVEST WHAT YOU CAN AFFORD TO LOSE:
You should only do trading with the funds that you can AFFORD to lose, even then you must be cautious and apply the process above to the same capital. Doing this eliminates the emotional pressure factor and avoids decisions that are driven by Fear of Missing Out. (FOMO)
Before Trading, set a clear number on what you can lose (NEVER to see again) without it affecting your life.
IDENTIFYING RISKS:
Relating to my previous posts, you must have a defined trading plan/edge. This plan must allow you to identify market volatility, news events, psychological mistakes, or technical invalidation points. These are risks that must be identified BEFORE trading.
Knowing these will allow you to apply the right position size correctly.
ASSUMING RISKS:
When it comes to assuming risks, (most people don’t factor this in) it means to accept the potential scenario of you losing, before the trade is actioned.
Your stop loss (always use a stoploss!) must be defined in a way that will not get yourself liquidated. You must calculate the right position size and learn to accept the outcome of the trade, and the mental effects it has on you.
Doing this, the trades & the process becomes mechanical. No longer would it be emotional.
If the loss is too big and you take it anyway. You should not be taking that trade as it will encourage revenge trading.
PLANNING RESPONSES BEFORE, DURING and AFTER RISKS:
With trading & risk management, you must have a pre-defined response for before, during and after trades. Your risks must be set.
Before the trade, you should have an entry, SL & TP set. Along with an invalidation level (if price hits a specific point, you DON’T take the trade) and a maximum risk, eg “I’ll risk max $5,000 on this trade”
During the trade, you must stick to the plan, don’t adjust your SL, or TP if it’s not part of your strategy.
After the trade, if you win, or lose, find out why. Was it a valid trade, did it follow your edge? Or did you take a blind gamble. If you lose, figure out why, if you won, figure out how you could have scaled it upwards.
Applying these 3 factors allows the cycle of discipline to develop and grow. It then removes randomized decision making.
Risk management is a crucial Key in trading. Without it – you have already lost.
I have attached the 3 KEYS to trading success below. Here I go in depth on what an individual must master to be successful in trading.
Trade ideas
BTC - Another (Drastic) Possibility For those who have been following my bitcoin short ideas, another possibility in this movement that I urge you NOT TO DISCREDIT so easily:
We see a flash crash / wick beginning from 89,000-89,500 region - and we drop straight to sub 10,000
My expected bottom of this wick is precisely 7,250
Now why would this happen, or be possible?
DXY is breaking down a major multi year bearish structure. This means the US dollar will fall in value over the next years, and lead to one of the largest bull markets we’ve ever witnessed on stocks, equities, and securities.
Bitcoin has been steadily rising and collecting not only long position stop loss orders, but liquidation orders for all the leveraged buys (including Microstrategy).
This leaves a massive chain reaction of sell orders ready to trigger off, one into the next, below price.
As price falls, more liquidity is removed and more sell orders are filled - this equals a drop at incredible speed that does not stop until there are no more orders.
So while I have been urging a 3 way corrective drop as such:
89,500 to 34,800
34,800 to 61,000-63,000
61,000 to 8,000
It’s entirely possible we see the following:
89,500 to 8,000
Happy trading,
- DD

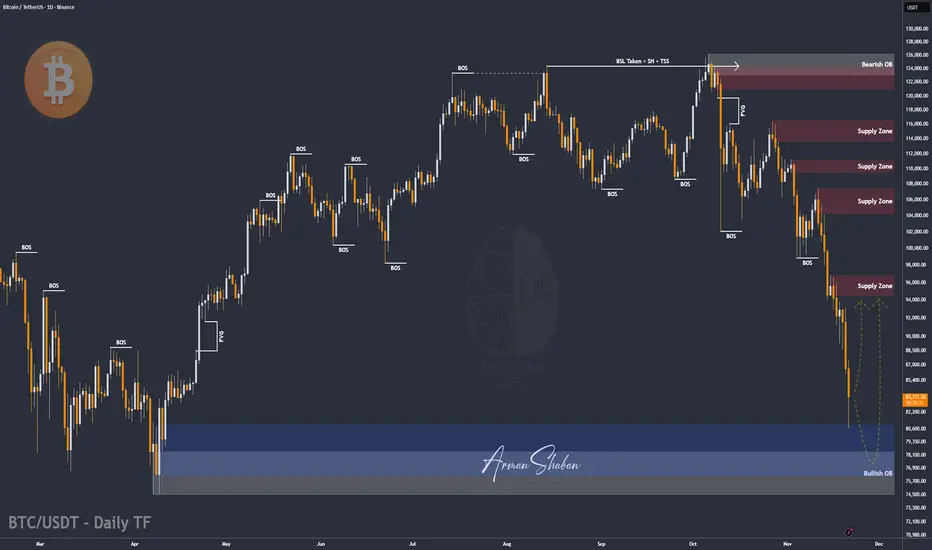
BTC/USDT | Bitcoin Hit Major Demand, What’s Next?By analyzing the #Bitcoin chart on the daily timeframe, we can see that the price dropped exactly as expected and fell sharply to $80,500. Once it reached this major demand zone, buyers stepped in and Bitcoin bounced back to around $83,900.
As long as BTC can hold above the large demand zone between $74,000 and $81,000, we can expect the next bullish wave to start.
From my perspective, the trend is not bearish! this is still a healthy correction.
From the ATH at $126,200, Bitcoin has corrected 36%, which is completely normal in strong uptrends. Now it’s time to watch for decreasing selling pressure and the beginning of a stronger upside move. This analysis will be updated soon.
Please support me with your likes and comments to motivate me to share more analysis with you and share your opinion about the possible trend of this chart with me !
Best Regards , Arman Shaban
BTC/USDT: Bullish Divergence Forms at 92K Support ZoneBTC/USDT is testing the 92,000 key support, a level that previously triggered a major reaction. A bullish divergence is forming as price compresses at the bottom of a downward channel, hinting at a potential corrective rebound.
If buyers defend the zone, a move toward 100,500 resistance is likely. While overall momentum remains bearish, the divergence supports a short-term bullish swing before the broader trend resumes.
❗️ Risks:
– Break below 92,000 opens deeper downside.
– Macro trend continuation may invalidate divergence.
– Failure at mid-range resistance could cap the rally early.

BTC - NEW ATH in December or DROP?Hello BTC Watchers 📈
Bitcoin has, historically, been very bullish in Decembers. We see the most drastic increase in 2020, when BTC climbed over 140%.
During the times that BTC corrected over December, it's been 10% and 31%.
This makes it hard to predict seeing that it seems to be different every year with one year even trading in a tight range.
A few things we can do to clarify the possible direction of BTC This December:
1️⃣ Check the Macro
From a macro perspective, Bitcoin has increased and been increasing since April, with the hard drop only showing now in November.
This could mean two things - the correction before a final leg up or, the beginning of the bearish cycle.
2️⃣ Check Technical Indicators
a) The moving averages is pointing towards short-term BEARISH, since we are trading UNDER the 200d Moving averages(green line):
b) The Bollinger bands are showing an expansion (aka widening) but to the bottom, as the price is trading on the lower BBands, also indicating strong selling pressure for the short to near term:
3️⃣ Watch the News
Bitcoin has been coming up in many seemingly "bullish" articles. This is usually a bad sign before the liquidation - create hype, and then short the market.
Conclusion:
I'm leaning towards a soft pump in December to soften the blow of the current correction , but not a new ATH. The next increase will likely be a "fake-out" before the real bearish season starts in the new year.

BTC/USDTI think wave A is complete. For wave B, I expect Bitcoin price to grow to the middle of the channel. It is not rational to take a short position on Bitcoin here.

Short-term trend analysis of Bitcoin!As we had already identified Bitcoin’s support zone in previous analyses, this area is still valid.
To assess Bitcoin in the lower timeframes, there are two possible scenarios:
One is that it starts moving upward from the current prices, and the other is that it revisits the green zone once more, forms a double bottom, and then moves toward the red target.
A daily candle closing below the invalidation level will negate this analysis.

The Prop Trader’s Guide: Win Challenges. Keep Funding. Scale upHey Traders, today we are going to look at the prop trading. It can be solution for traders who has tested and proven their strategies. In this article, we’ll break down the risk rules that keep traders funded, the habits that build consistency, and the mindset that separates steady growth from emotional gambling. If you can master this part of the game, the rest becomes much simpIer.
1️⃣ You must have your strategy well defined and proved on your capital. Prop firms are not solution to the poor financial situation. If you dont trade well and consistently on small capital, bigger capital is not solution. First you need to solve this and have strategy with good winning ration and risk reward. You can check my one. for inspiration I have described it in this post below.
👇 Click the picture to learn more 2️⃣ Understand that in prop firms you are not trading real capital. They just sold you a demo with strict rules and if you pass and earn, they will pay you from what they earned on others who lost challenges. Hence rules are set such that it's not easy to pass and keep the account - but it's not impossible if you adapt.
3️⃣ $100K capital is not $100K if your maximum drawdown is 10%. In the fact your account is 10K - the amount you can really risk. Hence making 10% to pass first phase with 10% max drawdown equals making 100% gain. And second phase 5% adds another 50%. So to get funded you literally need to make 150% not 15%.
📍 If we know that 90% of traders , loose 90% of capital in 90 days on the normal accounts. What will be statistics of prop firms ? Even worse. But you have a chance. if you have a good winning ratio. Which you achieve by filtering just to the best trade setups. I have made it multiple times and still Im funded in Crypto and Forex prop firms. Most important think it this game is risk management. But before I will explain my dynamic risk management for each phase and funded account I give you some tips from my experience.
🧩 Essential Rules for Prop Trading
🧪 1) Its not a straight forward game
You must be ready to loose challenge and have money to buy another one. Don't expect get funded and keep the account forever. Unless you will risk 0,1% per trade. We want risk more, because you don't want spend passing challenge for a year. At some point you can loose account even with a good risk management. I lost over 30 challenges in different phases and funded accounts. My total investment was not small, but I withdrew multiple times more in 2025.
🧪 2) Reduce number of trades - Take only best trading setups
I trade less on prop account than on my personal accounts. I take there only A+ setups the ones which are obvious and Im confident to taking them. In the fact I should trade like this on my personal ones also, but I trade more often.🤷♂️
Don't fall for a trap to trade every day every move up and down. Have your routines. For your inspiration you can check this article 👇 Click the picture to learn more 🧪 3) Grow prop capital not % gains
If you would be hedge fund manager who deliver 3% a month consistently you would be considered as top star trader. However we as retail traders want more. Because we mostly don't have bilion dollars portfolio's. But if you work well in prop trading 3% Is life changing and its actually not difficult to achieve.
⁉️ How to achieve a 3% a month
Is 3% gain a month difficult ? If you risking 0.5% per trade with 1:2 RR it actually means That you must win just 3 trades. Now look at your Trade journal, you definitely had 3 good wins in a month. Only thing you need to do is to eliminate those other unnecessary trades.
$ 100K Funded account - 3% gain - 80% Profit split = $2400 payout
How to make more ? Don't go for bigger % gains. Get another funded accounts and build your capital. If you pass another 4 x $100K challenges you will get $500K AUM capital. Then with your 3% gain and 80% profit split = $12 000 payout.
Then you reinvest and you aim for $1000 000 funding to aim for $20K a month with making 3% a month.
🧪 4) Be patient and have a long term vision
Don't expect this happen in month or two. Write down your plan how you will acquire and will work on your prop trader career. Getting funded $1000 000 is a work for at least a year.
🧪 5) Don't trade all challenges at the same time
Yes you will be missing profits if you doing well, but if you loosing it will be affecting your portfolio completely. Take trades separately. I trade each pair on different props and Crypto also separately in the different prop firm.
🧪 6) Start with small $10K account to practice
Trading is performance discipline, dont put yourself under the stress by buying $100K or $200K challenge on the beginnings. Start with $10K just to practice and trade within their rules. Once you pass these easily you are ready to go big.
🧩 Dynamic Risk management for the Prop trading
When it comes to successfully passing Crypto prop challenges, an effective risk management strategy is crucial. Finding the right balance between risking too little and too much is key. Both extremes have their downsides; risking too little may result in prolonged evaluation phases while risking too much can lead to blowing through challenges quickly and struggling with the emotional aspects of trading.
Therefore, you can employ a dynamic risk management approach that combines the strengths of both methods. The specific risk management protocols may vary within different phases of the funded account, typically consisting of two evaluation phases and the funding stage upon successful completion of both.
1️⃣ The 1st Challenge Phase:
In this phase, where a 10% profit target is required for quick progress, you can adopt an aggressive risk management approach. With the following dynamic risk management
Start with risking 0.5% per trade
if your balance increases +1% increaser risk pert trade to 1%
if your balance increases +3% increaser risk pert trade to 1.25%
if your balance drops back to 0% reduce risk to 0.5% If your balance drops below 3% reduce risk per trade to 0.25%
If your balance drops below 5% increase risk to 1%
You might wonder why the risk per trade increases to 1% even when the drawdown exceeds 5%. This is to minimize time opportunity costs. Rather than slowly trading out of drawdown, you can prefer to increase risk and attempt to either break even quickly or accept the possibility of losing the challenge.
If you can not afford to lose a challenge, sticking to lower risk like 0.25% per setup until the account returns to break even might be a better option.
2️⃣ The 2nd Evaluation Phase – Verification
Once phase 1 is completed, and a lower profit target is required, a less aggressive risk management approach is employed:https://www.tradingview.com/x/Lrf4f1XO/ Aim to keep our time-based opportunity costs relatively low in the 2nd evaluation phase. Losing the 2nd phase account would mean having to repeat the 1st phase, which is why we adopt a more cautious approach and strive to minimize potential drawdown.
Risk is only increased when we have a cushion of at least +2%. If the drawdown falls below -2%, we maintain a risk of a quarter percent until the drawdown is fully recovered and back above the -2% threshold. This approach is designed to create a balance between preserving capital and meeting the objectives of the 2nd evaluation phase.
🎯 The Funded Account:
In the funded account, where both phases have been passed, preserving the account becomes the top priority, followed by receiving the first pay-out and refund of the signup fee. Funded accounts should be approached conservatively, and the risk management protocol is adjusted as follows:https://www.tradingview.com/x/QncyMGOz/ Lowering the risk per setup as the drawdown increases serves as a protective measure to prevent breaching the maximum drawdown rule. This approach may result in a longer process of trading out of drawdown, but it is a more favorable alternative to losing the account Completely.
As mentioned, your goal should be build longterm big capital and diversify between prop firms. For instance, you might allocate one account for swing trades and another for day trades. This diversification is just one example; there are various possibilities to explore.
👉 Prop Firms Selection
Opening a prop firm is easy, you just need couple thousands and you buy complete setup with platform and system. Then you start selling demo accounts. Hence there is thousands of prop-firms these days. You want to go just with the serious ones. Which means not the easiest conditions and not the cheapest challenges. But these will most likely last longer.
‼️ Avoid Prop firm which has:
- Cheap challenges or massive discounts
- Easy conditions to pass challenges
- Trailing Drawdown rules
- Too big profits splits
- Too many consistency rules
- Restrictions trading news
- Too many bad reviews (they will most like have more good reviews than bad - its Fake)
- If you Trade Crypto look for prop firm on Crypto exchange. Not in CFD broker.
Trading is not easy and prop firms makes it even more difficult, but its not impossible.
Expect failures and frustration on your journey. You can handle it, you will handle everything, you will always find solution. Keep going re-invest profits and build portfolio.
Main goal is to build personal account from their money without their rules.
Good luck
David Perk aka Dave FX Hunter

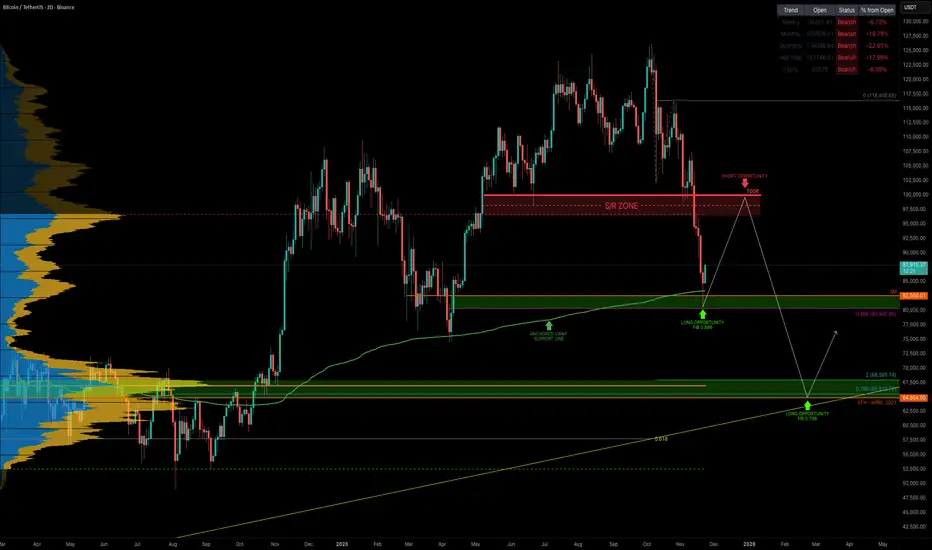
BTCUSDT: Trend in 4-H time frameThe color levels are very accurate levels of support and resistance in different time frames.
A strong move requires a correction to major support and we have to wait for their reaction in these areas.
So, Please pay special attention to the three accurate trend, colored levels, and you must know that SETUP is very sensitive.
BEST,
MT

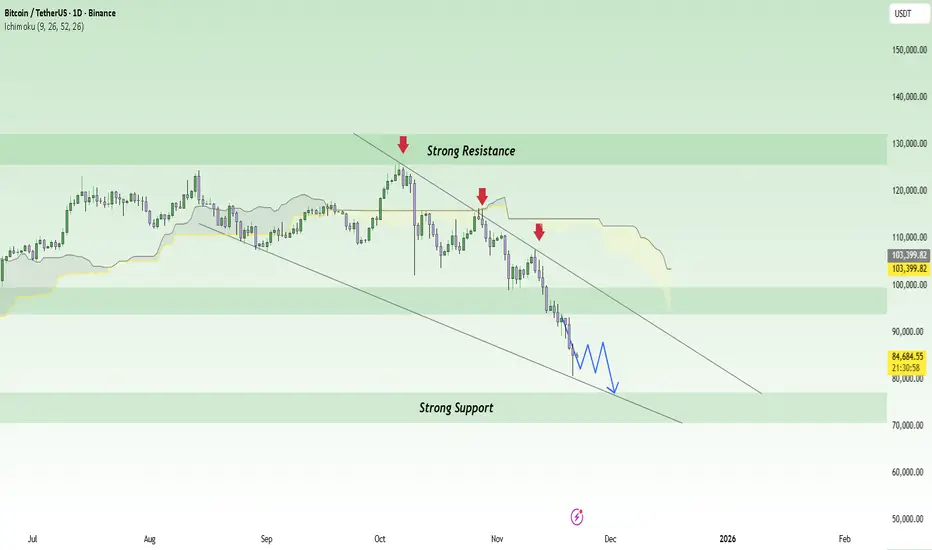
BTCUSDTHello Traders! 👋
What are your thoughts on BITCOIN?
Bitcoin has dropped into the marked support zone, where a bullish reaction is likely in the short term. From this area, price may attempt a move back toward the descending trendline.
The key focus will be on how price reacts once it reaches the trendline and the overhead resistance zone.
A confirmed breakout above this resistance could trigger further upside momentum toward higher levels.
Until this breakout occurs, any upward movement will simply be considered a correction.
Don’t forget to like and share your thoughts in the comments! ❤️

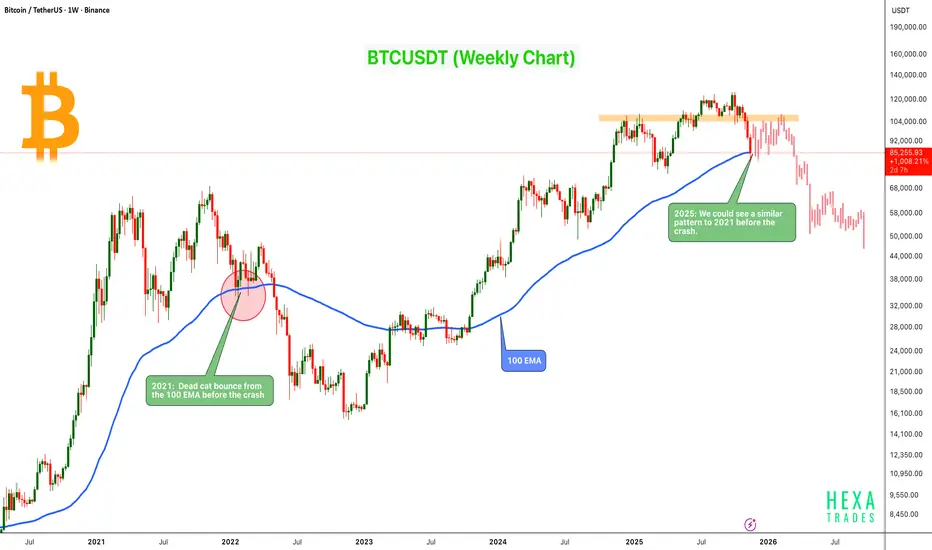
2021 vs 2025: Bitcoin Showing a Similar Macro StructureBitcoin is showing a price structure very similar to the 2021 macro top, where BTC formed a dead-cat bounce from the 100 EMA before beginning a major correction.
On the current cycle, BTC is once again testing the 100 EMA, and the price reaction looks very similar to the 2021 pattern: a brief bounce followed by continued downside pressure.
Key Points:
- 2021 Pattern: BTC bounced from the 100 EMA before the macro crash.
- 2025 Price Action: Showing a similar bounce and reject structure at the same weekly EMA.
- Major Weekly Resistance: Market showing exhaustion and lower-high structure, just like previous cycle tops.
- Potential Dead-Cat Bounce: We could see a bounce toward the $100K–$107K zone before the downtrend continues.
- Possible Repeat Scenario: If BTC fails to hold above the 100 EMA, history suggests a deeper correction may follow.
Cheers
Hexa
Final 2025 Forecast for BTCUSDT 21st November 2025 (Updated)1. Friday session dip to around ~$84k
2. Pump to around ~$92k over the weekend and early next week
3. Final dump down to ~$80k
4. Final pump to ~$128k to end the cycle
This idea does not indicate a massively new ATH but a topping out at the multi-cycle trend line from 2017.

Has The BITCOIN Bear Cycle Started? (1W)This is a weekly timeframe analysis. In this analysis, we examined the bullish phase that pushed Bitcoin from the $15K channel to the $125K channel.
This phase appears to be a bullish diametric pattern, with its final wave, G, completed as a triangle.
It’s important to note that there is a possibility for this diametric pattern to transform into a symmetrical pattern. The difference between a symmetrical and a diametric pattern is that the symmetrical pattern has two additional waves.
The price zone that could potentially turn our diametric pattern into a symmetrical one is the upper support area, between $64K and $74K. The potential timeline for a reversal is indicated by two vertical lines on the chart for the months of March and January. These were derived from the duration of previous branches of this pattern, where corrective branches of prior waves ranged between 16 to 25 weekly candles. If the pattern is symmetrical and not diametric, this means the next two waves of this bullish cycle are still remaining, following these timing rules.
In general, the intersection of the support zone and the timeline lines at the top of the chart is where the price could develop the pattern and move upward. However, if these zones fail, it means the main pattern was the diametric itself, and we are now in Bitcoin’s bear cycle. In other words:
If the price continues to decline, it’s possible that the diametric pattern was the main bullish phase, which is now complete, and Bitcoin has entered a monthly timeframe bear cycle that could last months or even more than two years.
The main support after this bullish phase, on higher timeframes, is in the $31K to $44K range, where Bitcoin’s bear cycle might finally end.
We hope this gives you a clear perspective on Bitcoin.
For risk management, please don't forget stop loss and capital management
When we reach the first target, save some profit and then change the stop to entry
Comment if you have any questions
Thank You

BTCUSDT – Is This the “Wake-Up” Pullback Before a Breakout?While the market was still doubting Bitcoin’s momentum, BTC suddenly pushed to its highest level in weeks , leading a strong recovery across the crypto space. And this rebound didn’t happen by luck — it came from a mix of macro sentiment and real buying pressure .
On the news side, market sentiment is leaning toward the bulls as expectations grow that the Federal Reserve will soon end its rate-hike cycle . A softer Fed means less pressure on risk assets like Bitcoin, giving BTC more room to climb . Combined with rising institutional demand , the market is finding new reasons to believe in a potential recovery phase.
Another major driver is the anticipation surrounding the Spot Bitcoin ETF . Even the prospect of approval has boosted Bitcoin’s legitimacy in the eyes of institutions, creating a long-term supportive force. This is the “fuel” that keeps buy-side interest steady even though the chart still sits within a short-term downtrend.
On the 4H chart, BTC is reacting strongly at the major support zone around 90,300. Recent lows are no longer dropping deeper — a clear sign that selling pressure is weakening . If price continues to hold above this level and pushes toward the upper boundary of the descending channel, BTC could easily move up to the nearby resistance around 96,300.
In summary, with positive news flow and stable price reactions, buyers still have a good chance of driving a short-term Bitcoin recovery. A sensible strategy is to wait for a retest around 90,300 before considering long positions in line with the bullish bias.

BTC Is Falling Freely – Every Pullback Is Just a Trap!Bitcoin is currently entering a phase where every bounce is seen as a selling opportunity . Market sentiment has turned cautious as news continues to lean negative: BTC has broken its lowest level in six months around $86,000 , and reports indicate that a major whale has exited a position worth $1.3 billion . When big money pulls out, the market struggles to stay stable.
Observing price action, BTC is moving steadily downward with lower highs forming continuously . Every time the price attempts to rise, it gets pushed down immediately, showing that sellers are fully in control of the market. Upper price zones are consistently rejected, proving that buying pressure is not strong enough to create any meaningful reversal.
The most reasonable scenario now is that BTC may stage a technical bounce toward $93,700 , but it is likely to encounter strong selling again and continue falling toward the major target around $76,800. Any upward move during this period is just a pullback to sell , not a signal of a real trend reversal.
In short, negative news + bearish technical structure are strongly aligned, so for short-term traders, it’s best to sell with the trend , wait for price to pull back before entering, and avoid catching bottoms when the market has no clear reversal signals yet.
BItcoin Short Term Analysis (4H)As we had already identified Bitcoin’s support zone in previous analyses, this area is still valid.
To assess Bitcoin in the lower timeframes, there are two possible scenarios:
One is that it starts moving upward from the current prices, and the other is that it revisits the green zone once more, forms a double bottom, and then moves toward the red target.
A daily candle closing below the invalidation level will negate this analysis.
For risk management, please don't forget stop loss and capital management
When we reach the first target, save some profit and then change the stop to entry
Comment if you have any questions
Thank You

BTC Euphoria to Fear: Is This the Start of the Bitcoin Winter?Is the Bitcoin bear market here? A deep dive Into cycles, tech risks & what comes next.
Bitcoin has now dropped –36% from its all-time high in just 46 days, and naturally the big questions emerge:
Has the bear market officially begun?
How long could it last?
And what catalysts could accelerate it?
Let’s break this down from cycle structure to macro-technological risks.
BTC Has Turned Bearish Across All Major Timeframes
Bitcoin is now trading below the yearly open at $93,576, flipping all major timeframes into bearish alignment (from the daily to the yearly).
Monthly MACD Bearish Cross Incoming
The monthly MACD is set to print a bearish crossover this month.
The last bullish MACD phase lasted 28 months, which has now ended → a strong macro signal.
Cycle Timing: What History Says
Historically, Bitcoin bottoms approximately one year after the top:
2017 → 2018: 363 days
2021 → 2022: 376 days
If the current cycle repeats, the macro bottom may form around:
October 2026
The previous bull market lasted 1061 days, this one 1050 days → almost identical.
This strongly supports the thesis that the cycle has already peaked.
How Low Could Bitcoin Go?
Macro target:
0.786 Fibonacci Retracement → $39,173
Aligning with:
Half-year 21 EMA confluence
Macro corrective structures
Prior cycle bear market depth
Historical Precedent: The 2022 Bottom Zone
Back in 2022, Bitcoin spent 210 days (over 7 months) consolidating at the bottom of the bear market.
This was especially clear on the weekly timeframe, where price formed a clean multi-month accumulation range.
Weekly TF:
Daily TF:
This is crucial context:
👉 The market gave more than half a year to load up at the bottom.
No chasing, no rushing → anyone paying attention had time to scale into positions for the next cycle.
The 2025 Macro Top Landed Perfectly in the 1.618–1.666 Fib Target
Fib 1.618–1.666
→ $122,056 – $125,218
This area was the ideal sell zone, and Bitcoin respected it perfectly.
What happened after hitting the Fib target?
The market entered a 3-month distribution phase, giving plenty of time to:
scale out
take profit
derisk
rotate into stablecoins or simplified portfolios
Then came the aggressive sell-off → classic macro cycle behavior.
Macro Catalysts That Could Drive the Bear Market Deeper
1️⃣ Quantum Computing Acceleration
A credible quantum breakthrough (or even a strong rumor) could trigger systemic fear.
Bitcoin’s ECDSA signatures are theoretically vulnerable to quantum attack models.
2️⃣ Fast-Paced AI Threats
AI is accelerating:
algorithmic optimization
cryptographic analysis
zero-day discovery
hardware design
The risk matrix is evolving faster than coding standards can update.
3️⃣ Regulatory Momentum
Expect:
stablecoin restrictions
exchange tightening
AML/KYC global enforcement
This would accelerate risk-off behavior.
Technical Confluence: Where BTC Is Now
Monthly 21 EMA/SMA → 86.6K
Current support test.
Quarterly (3M) 21 EMA/SMA
EMA: $58.5K
SMA: $53.5K
Strong structural support zone.
Half-Year (6M) 21 EMA/SMA
EMA: $39.5K
SMA: $29.8K
The EMA aligns perfectly with the 0.786 retracement → $39,173.
Remember that the EMA/SMA levels mentioned are dynamic and will continue to shift over time as new price data comes in, so these confluence zones will gradually adjust.
Additional Confluence: Potential Head & Shoulders (Bars Pattern Symmetry)
A potential Head & Shoulders Pattern is forming in symmetry with the previous bull market top, as shown through the bars pattern overlay.
Trading Playbook: Short the Bull Trap
The most likely scenario:
BTC bounces into $95K–$100K → traps late bulls → rejects → cascade lower
Targets:
TP1: $76K
TP2: $70K
Remaining: trail into $65K → $58K → $39K
Final Outlook
Bitcoin is now deeply aligned with a macro reversal:
Perfect Fib 1.618–1.666 top
Break of yearly open
Cycle timing consistent
Monthly MACD turning bearish
Quantum + AI risk factors accelerating
Structural confluence targets $70K → $40K
Pattern mirroring the previous cycle top
_________________________________
💬 If you found this helpful, drop a like and comment!
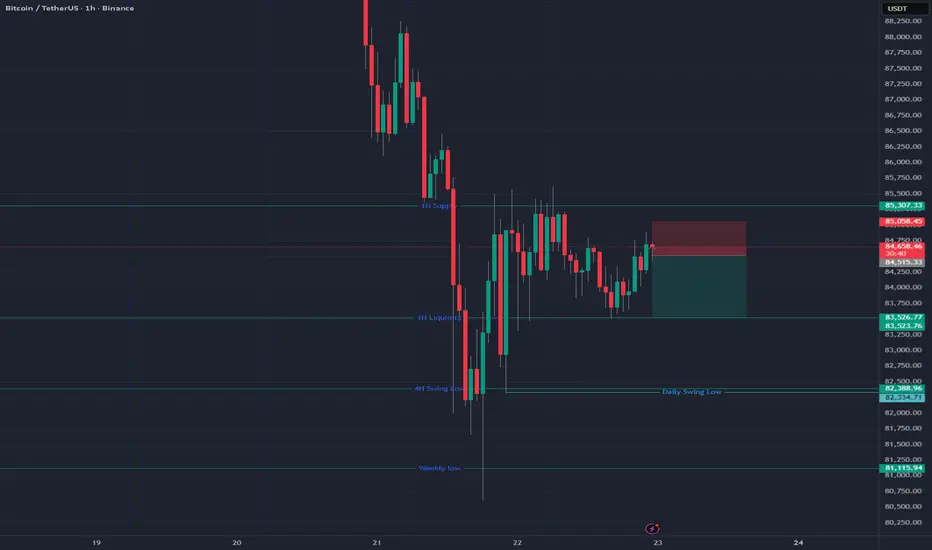
Staying with the higher-timeframe flow until proven otherwise.I’m short BTC from 84,515.33 following a clean reaction from a short-term supply zone that aligns with the broader higher-timeframe downtrend.
We had a buy-side sweep, price traded into premium, and the rejection was immediate — enough for me to take the setup.
Risk is defined above 85,058.45.
First target sits at 83,526.77, in line with the next liquidity draw.
Will continue managing this based on structure.
Risk Management for Automated SystemsAutomation gives you speed, consistency, and emotionless execution, but it also has a dark side.
A bot can follow rules perfectly, but if the rules are risky, it will amplify the danger with mechanical precision.
That’s why risk management is the backbone of every successful automated strategy.
It doesn’t matter how good your code is — without proper risk control, even the smartest system can fail fast.
Below are five core pillars of risk management that every trader should build into their automation framework.
1. Know Your Maximum Drawdown
Every trading system, even the best one, goes through losing streaks.
What matters isn’t avoiding them, but controlling how deep they cut.
Setting a maximum drawdown limit defines the exact point where your bot pauses or shuts down.
Whether it’s 5%, 10%, or 20%, this boundary protects your capital and your mindset.
Why it matters:
Prevents “death spirals” during high volatility
Stops the system if market conditions change
Forces you to step back and evaluate logic
Protects the account from black swan trends
A bot that can’t stop itself, is a bot that will eventually blow up.
A bot that knows when to stop, survives.
2. Position Sizing Is Everything
You can have the best entry logic in the world, but if your position sizes are inconsistent or too large, the system becomes unstable.
Smart position sizing adapts to:
Account balance
Market volatility
Asset liquidity
A fixed-percentage model, such as risking 1–2% per trade, keeps performance steady even during rough periods.
It also allows your system to grow naturally without taking oversized risks.
Think of sizing as the volume knob of your bot — turn it too high, and you distort everything.
3. Avoid Correlated Exposure
Running several bots doesn’t automatically mean you are diversified.
Many traders make the mistake of running multiple strategies that all rely on the same market behavior.
For example:
Three momentum bots on BTC, ETH, and SOL are still highly correlated
Two trend systems may fail at the same time if the market suddenly ranges
Several “dip-buying” strategies will all get hit hard during a crash
True diversification means mixing:
Uncorrelated assets
Different signal types
Varying timeframes
Both trend and mean-reversion logic
The goal is for your bots to perform differently, not identically.
4. Review Your System’s Risk Profile
Markets change, and so should your risk model.
Volatility increases and decreases, spreads widen, volume dries up, and certain assets become more unpredictable.
Regular reviews ensure your system stays aligned with real conditions.
What to check:
Has drawdown increased over the last quarter?
Are trades becoming larger than planned due to volatility shifts?
Has your system entered a new market phase it wasn’t designed for?
Are win rates or profit factor weakening?
A quarterly or monthly audit reveals issues before they explode.
Risk management isn’t a one-time setup — it’s a continuous process.
A strategy tester can be very good tool to help you manage risk properly and evaluate risk.
Here is an example from one of our strategies.
5. Let Risk Management Be Automated Too
If your entries are automated but your risk controls aren’t, you’re only half-protected.
Risk management logic you can automate:
Stop-loss placement
Progressive stop tightening
Position scaling
Reducing size after a losing streak
Pausing after reaching a daily or weekly limit
Complete shutdown at max drawdown
This turns your bot into a self-regulating system that responds to both opportunity and danger.
The more risk rules you automate, the less emotional interference you’ll face — and the more consistent your results become.
Lingrid | BTCUSDT April Lows Revisit - Possible Reversal ZoneBINANCE:BTCUSDT is rebounding from the major support zone near 82,300 after completing a full extension inside the downward channel. Price is now pressing into the descending trendline — a level that has capped every bullish attempt since early November. The market is forming a higher-low structure on the retest, hinting at an early accumulation phase.
From a fundamental side, Bitcoin is stabilizing as ETF inflows recover and risk sentiment improves after softer U.S. data this week, reducing pressure on high-beta assets. If buyers manage to break above the descending trendline and reclaim 93,300, this would confirm the start of a bullish recovery cycle.
➡️ Primary scenario: Break above the trendline → move toward 93,300.
⚠️ Risk scenario: Failure to break the trendline sends CRYPTOCAP:BTC back to for another liquidity sweep.
If this idea resonates with you or you have your own opinion, traders, hit the comments. I’m excited to read your thoughts!

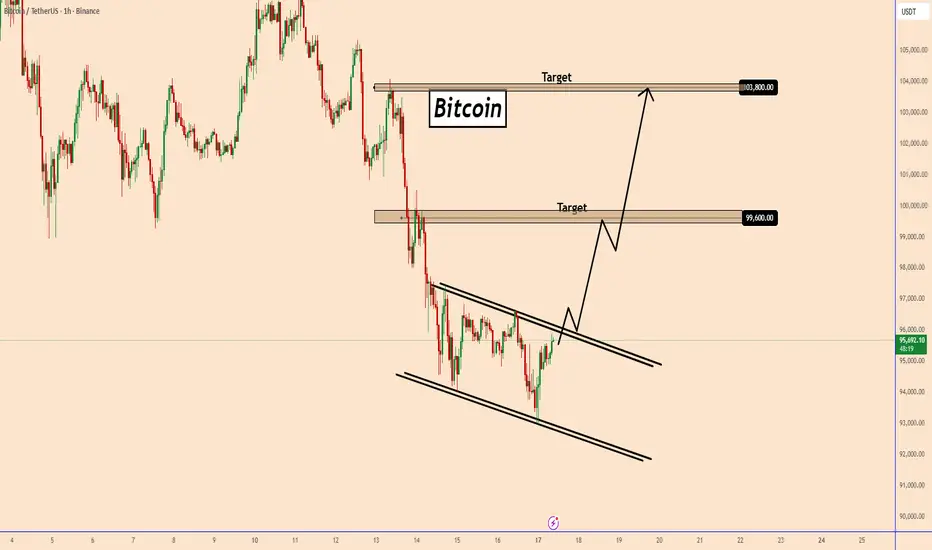
Bitcoin: Short-Term Bullish Recovery on the TableBitcoin: Short-Term Bullish Recovery on the Table
Bitcoin is showing early signs of a potential short-term bullish reversal as price continues to respect the descending channel. The latest bounce from the channel’s lower boundary suggests growing buyer interest, and a breakout above the upper trendline could trigger a stronger recovery.
If BTC manages to break and retest the channel resistance, the next targets sit at:
Key Bullish Targets
$99,600
$103,800
As long as the price holds above the channel, the short-term bullish scenario remains valid. A clean breakout would confirm upside continuation.
You may find more details in the chart!
Thank you and Good Luck!
❤️PS: Please support with a like or comment if you find this analysis useful for your trading day❤️
BTC/USDT | Bitcoin Drops Hard – Key Demand Zones Now in Play!By analyzing the #Bitcoin chart on the daily timeframe, we can see that BTC failed to hold above $104,700, and as expected, this led to a heavy sell-off. First, the price dropped to $94,000, and then a second strong wave pushed it down to $89,000. Bitcoin is now trading around $91,000.
Key supply zones and demand zones are marked on the chart. Important demand levels sit at $88,000, $84,000, and the larger zone at $74,000–$78,000. Watch how the price reacts to these areas.
If Bitcoin wants to recover, it must first hold above these key zones. But if BTC breaks below $74,000, it could open the door for a deeper drop toward $50,000. For now, focus on price reactions at the marked demand levels.
Please support me with your likes and comments to motivate me to share more analysis with you and share your opinion about the possible trend of this chart with me !
Best Regards , Arman Shaban

Bitcoin - H1 Breakout Alert – Bulls Taking Control!BTC/USDT - Bitcoin has officially broken its descending trendline and completed a successful retest from the demand zone. This shift signals a potential momentum reversal, with buyers stepping in aggressively after weeks of corrective price action. BINANCE:BTCUSDT
🔍 Technical Overview
✔️ Clean trendline breakout on H1 timeframe
✔️ Strong retest at demand zone → buyers defended perfectly
✔️ Price now trading above the trendline, indicating bullish structure
✔️ First target: $95,000 (psychological level + key resistance)
✔️ Second target: $100,000 (major psychological level)
If bullish pressure continues, liquidity grabs above these zones could fuel an extended move.
📊 Fundamental Insight
Institutional interest rises, especially around accumulation zones
ETF inflows remain positive, boosting overall sentiment
#BTC #Bitcoin #BTCUSDT #Crypto #CryptoTrading #BitcoinAnalysis #TradingSetup #Breakout #TrendlineBreakout #PriceAction #TechnicalAnalysis #Binance #CryptoMarket #Bullish
💬 Support the Idea
If you found this analysis useful,
👉 Please LIKE 👍 and COMMENT 💬
Your support helps me share more setups daily!
⚠️ Disclaimer
This analysis is for educational purposes only.
Not financial advice. Always manage risk (1–2% per trade) and follow your trading plan.
