BITCOIN:LIVE TRADEHello friends
You know that this is a risky situation, so observe risk and capital management.
The price has risen after the decline, has collected good liquidity, and now it has fallen again, has collected low liquidity, and is waiting now that this floor has been made, to move to the specified targets. Of course, the opening of the US government is also effective.
Observe capital management.
*Trade safely with us*
Trade ideas

It's time to prepare capital to buy BTC!!!!"Fear Not: Bitcoin Whale Selling Doesn’t Point To A Crypto Meltdown—Analysts" is what been written to day. The title sounds like it is coming to a bearish market for the next few months. It will not recover until later of June 2026, and this will be the time for investors to prepare capitals to buy BTC and alt-coins later next year, and the next couples of years.

Bitcoin viewThe chart shared illustrates as per Elliott Wave analysis setup combined with supply and demand (selling/buying) zones. Here’s a breakdown of what’s shown:
🧩 Elliott Wave Count
The labeling (A (a-b-c)–B (a-b-c)–C (1-2-3-4-5) (1–5) now we are in C(1-2-3-4-5) where we have completed C-3 Wave heading too C-4 Wave
🔹 Key Components:
Wave (a)-(b)-(c):
Indicates a corrective pattern (ABC Zigzag) where (c) is likely completing or nearing completion.
Waves 1–5 (in yellow):
Represent a downward impulse, possibly forming Wave (c).
Currently, it seems price is in Wave 4, with Wave 5 expected to follow downward toward the “Buying Zone.”
💰 Trading Zones:
Selling Zone:
Marked around the Wave 4 retracement area — typically a good place for short entries if price rejects this region.
Buying Zone:
Below, where Wave 5 (and (c)) is expected to complete.
A potential reversal area where buyers could step in.
Always follow Price-Action
⚠️ Disclaimer
This analysis is published here is for educational and informational purposes only. It does not constitute financial advice, investment recommendation, or a solicitation to buy or sell any financial instrument. All ideas and analyses shared here reflect the author’s personal opinions and are not endorsed by TradingView. Trading and investing carry significant risk of loss and may not be suitable for all investors. Always do your own research and consult a licensed financial advisor before making any trading decisions. The author and TradingView are not responsible for any losses arising from the use of this information.

Bitcoin is poised for a surge, here's a buying guide!
Buy on 106K
TP1 109K
TP2 111K
TP3 114.5K
Bitcoin's ability to break through the $106K resistance level with compelling trading volume could signal an early sign of a recovery phase. Momentum could return, pushing prices towards the $110K–$112K area, especially if overall sentiment or macro catalysts are favorable. However, this will require a strong catalyst.

101180, next destinationGiven that the price reached the 95,967 range, the bearish cycle will not continue for now and the 101,180 range will be available.

BTC. Next stop: 80K?BTC on the weekly chart has dropped below the 50-week MA (103k), which is a very strong short signal. The top indicators are working because many traders watch them. It also closed the daily below the important psychological level of 100k. I’m not considering buying yet, as I’m wary of a potential acceleration of the downward impulse. A strong support level is in the 80k zone. If it returns to 100k, I’ll consider buying.

BTCUSDT SELL WITH LIMIT ORDER!!!!!BTCUSD completed +2,000pips from my last recent setup analysis today we are going to another sell from my poi at 104,778 after my liquidity inducement and sell down to 98k....

The BTC Long! Bullish Divergence SetupBTC Perpetual Contract - Bullish Divergence Setup at Critical Trendline Support
Bitcoin is presenting a high-conviction long opportunity as price tests a significant ascending trendline that originated in August 2024. This setup combines multiple technical confluences that suggest a potential reversal zone.
Technical Structure:
Price has been respecting a well-defined ascending trendline established from the August 2024 lows, which has acted as dynamic support through multiple retests. We're currently at another critical touch of this trendline around the $94,000-$95,000 zone, coinciding with a horizontal support level that has proven significant on previous timeframes.
Smart Divergence Engine Confirmation:
The overlay panel is displaying clear bullish divergence signals (green "BUY" labels) at key support levels. Notice how price made lower lows while the Smart Divergence Engine indicator (bottom panel) formed higher lows - this is textbook bullish divergence indicating weakening bearish momentum. The divergence pattern has accurately identified previous reversal points, as evidenced by the successful signals earlier in the chart that led to substantial rallies.
Smart Moving Average Dynamics (SMAD) Analysis:
The SMAD indicator is showing extreme bearish readings (deep red territory around -100.0), which historically marks oversold conditions and potential capitulation zones. When SMAD reaches these extremes near critical support structures, it often precedes strong mean-reversion moves. The indicator's position suggests we're at a momentum extreme that typically doesn't persist.
Trade Rationale:
This setup offers an asymmetric risk-reward opportunity. The confluence of the long-term trendline support, bullish divergence confirmation, and extreme SMAD readings creates a high-probability reversal scenario. Historical price action shows that this trendline has been respected consistently since August 2024, and each successful defense has led to significant upside continuation.
Risk Management:
A sustained break below the trendline and horizontal support would invalidate this setup. However, the current technical evidence suggests buyers are likely to defend this zone aggressively, given its significance in the broader uptrend structure.
The multiple timeframe alignment and indicator confirmation provide conviction for a long position targeting a return to recent highs around $108,000-$110,000, with extended targets at the $120,000-$130,000 zone if momentum accelerates.

BTC Sell/Short Setup (1H)Bitcoin appears to be forming a bearish triangle, which is considered a continuation pattern in this timeframe.
We have identified two potential entry zones for a sell/short position.
We are looking to enter within these two areas.
The invalidation level serves as our stop; if it’s hit, this setup will be invalidated.
Targets are marked on the chart.
For risk management, please don't forget stop loss and capital management
When we reach the first target, save some profit and then change the stop to entry
Comment if you have any questions
Thank You

BITCOIN + BULLISH DIVBitcoin has weekly RSI bullish divergence which with passing 110.5k can push the price to new ATH

#Bitcoin is forming massive bullish divergence! Bitcoin tapping trendline support again with RSI showing clear bullish divergence.
This is where reversals are born. 👀
If buyers step in, a strong bounce is on the table.

Bitcoin long I think this is going to be just another wick for btc on a weekly timeframe .
Higher , soon .
Nothing is over .

BTCUSDT.P - November 17, 2025BTCUSDT is still in a short-term downtrend, but price is holding above the support zone around $94,300–$94,500 while the next major resistance sits near $96,500–$96,600. The chart suggests a potential rebound toward resistance if support continues to hold, but a break below $94,300 would likely send price back toward the lower support near $93,250.
With a stop level around $93,250 and a target near $96,600, the setup offers a favorable reward-to-risk profile, but remains moderate-risk due to the prevailing downtrend.

BTCUSD – Falling Wedge Within the Primary Uptrend ChannelBitcoin is developing a clear Falling Wedge inside a well-respected ascending channel, showing a controlled corrective phase within an intact higher-timeframe trend.
Even after the recent push below 98K, the overall structure remains stable. Price continues to respond to key levels of the channel, and the liquidity sitting below the 98K region is still significant, which may continue to influence short-term movement.
⸻
Market Structure
1) Higher-Timeframe Trend Intact
• Price continues to create higher highs and higher lows
• Channel boundaries remain respected
• No daily-timeframe breakdown detected
The broader trend remains constructive.
⸻
2) Falling Wedge Correction
The current decline forms a textbook Falling Wedge, defined by:
• Converging diagonal support and resistance
• Decreasing bearish momentum
• Gradual compression before potential continuation
A structure that commonly resolves upward when aligned with an existing uptrend.
⸻
3) Sub-98K Liquidity Zone
Although BTC dipped under 98K, the market has not fully engaged with the liquidity sitting in the lower part of this region.
This area remains important and may still play a role in the next move.
⸻
Scenarios
📈 Bullish Case (Primary)
A clean reaction from the lower wedge boundary followed by a breakout above its upper diagonal opens targets at:
• 110K
• 130K
• 150K
• 170–200K (channel resistance) probably 2027
⸻
📉 Bearish Case (Secondary)
A daily close below 97K weakens the wedge structure
⸻
Conclusion
BTC is in a controlled compression phase, forming a Falling Wedge inside a stable ascending channel.
Though price briefly moved below 98K, significant liquidity still exists in that zone, suggesting short-term fluctuations are likely before a more decisive move develops.

BITCOIN Prediction... Possible buyHere is an analysis of Bitcoin. Price is at a 'Point of Interest' and has the possibility to reverse for a pullback to the upside. I dont think this will be the pullback to break 'all time highs'. Price over time should head lower before making new highs.


BTCUSDT BREAKOUT HINTS BELOW $100KThis Daily chart of Bitcoin/TetherUS (BTC/USDT) shows the price action breaking down from a consolidation pattern, suggesting a likely continuation of selling pressure.
The price has been trading around the $107,000 to $111,000 range for a period, forming what could be interpreted as a potential ascending triangle pattern or, more recently, a flag/pennant consolidation after a drop from the October high. Crucially, the chart highlights a decisive breakout below a solid black short-term trendline and the 'Yearly trendline Support' (dashed blue line).
The breakdown occurred near the $107,000 area, which previously acted as a significant support zone (the upper grey shaded box). The current candle shows the price trading at $103,957.19, significantly below this resistance-turned-support zone.
📉 Projection and Key Levels
The immediate projection is for the selling to continue towards the next major horizontal support level. This is the 'Monthly Support' zone, represented by the lower grey shaded box, which is approximately in the $100,000 to $102,000 range. This area is psychologically significant due to the round number and has historically been a strong area of demand (support).
Near-Term Projection: A move down to test the $100,000 - $102,000 Monthly Support zone is highly probable following the confirmed trendline and pattern break.
Continuation Risk: If the price fails to hold the $100,000 mark and breaks below the lower bound of the Monthly Support, it would signal a much deeper correction, likely targeting areas around the July/August lows near $97,000 or lower.
Resistance: The broken support level near $107,000 will now act as immediate resistance on any bounce attempts.
The technical setup, marked by the breakdown and the descending arrow, strongly favors a move to the downside in the short to medium term.

Bitcoin will go up)Hello everyone.
I've been in the market since 2019. And believe me, Bitcoin has already started to rebound. This is a local trade. I have specified two goals.
A tennis racket will help you send the price up;)
Good luck, your Panda.

BTC BREAKING NEWS OR BREAKING CHARTS?📰 BREAKING NEWS OR BREAKING CHARTS?
TRUMP IMPOSES TARIFFS, CAUSING A BITCOIN BLOODBATH — $20,000 DRAWDOWN IN 2 HOURS!
Bitcoin was sitting comfortably at $121,000, before a sudden macro shock — triggered by newly imposed U.S. tariffs — sent prices spiraling down to $100,000 in a matter of hours.
Bulls were liquidated. Bears rejoiced.
Now, the market stands at a crossroads: will this become a major dump continuation, or the foundation for a secret pump?
Chart Overview & Structure
On the high timeframe, BTC continues to trade within a rising wedge formation, with price now showing a significant wick rejection from the upper boundary. This move suggests a potential shift in market structure — a moment that’s likely to shake inexperienced traders. The chart reveals a clear supply and demand structure:
Supply Zone: $123,452 – $130,000
D emand Zone: $98,826 – $101,400
These zones define the battlefield between bulls and bears. In addition, eight psychological levels dominate the chart — $100K, $105K, $110K, $115K, $120K, $125K, and $130K — each representing potential liquidity clusters and reaction points.
Adding to the complexity, we can see a golden pocket (0.618–0.65 retracement) forming around $106,000, perfectly aligning with prior swing lows and the midpoint of a large Fair Value Gap (FVG) overhead. This zone could serve as a reversal or continuation point depending on whether price can reclaim and hold above the major support trendline.
Technical Insights
The market has now tapped the rising wedge resistance three times, with the last tap forming a wick above $125K, triggering liquidity before the sharp collapse. This aligns with the classical exhaustion behavior of wedges. Moreover, a potential Head and Shoulders structure is beginning to emerge, with the right shoulder aligning near $115K — a confluence area that may attract strong bearish attention.
For now, price is testing the lower support trendline — a crucial pivot area for determining whether BTC continues to break down toward demand or consolidates for recovery. This structure creates a make-or-break zone that will define the next macro leg.
Bullish Scenario
Despite the panic, this could be a classic liquidity flush — a “flush candle” event designed to wipe out leveraged long positions before a larger move upward. If BTC can maintain structure above the major support line and close above $106K–$110K, it opens the door for a relief rally.
A reclaim of $115K would confirm buyer strength.
Sustained momentum could push BTC back into the $120K–$125K range to retest the broken supply zone.
Breaking through $125K would invalidate the bearish wedge, potentially igniting a run toward $130K+ and even new highs in “Pump-tober.”
In this scenario, the deep liquidation event becomes fuel for a massive short squeeze, driving momentum and reigniting bullish sentiment across crypto markets.
Bearish Scenario
On the flip side, if BTC fails to hold above $106K or decisively breaks below the demand zone at $98K, it would confirm a rising wedge breakdown.
Below $100K, momentum could accelerate toward $95K–$92K — the next liquidity pools and volume gaps.
The Head and Shoulders completion would confirm the bearish reversal structure, further strengthening the downside case.
Macro sentiment, fueled by geopolitical and policy fears, could add weight to the bearish outlook.
A rejection from $115K without sustained reclaim would also reinforce the bearish continuation pattern, with every psychological level above turning into resistance.
Summary
Bitcoin is at an inflection point — the $100K–$115K range will define the next macro move.
The recent wick and structure breakdown hint at weakness, but the flush candle and liquidity sweep also suggest that a bullish rebound could be on the horizon.
In short:
Above $115K → Bullish continuation possible.
Below $100K → Bearish expansion likely.
With volatility at its peak, traders should expect massive liquidity hunts, fakeouts, and emotional traps on both sides.
Whether this becomes the start of a macro correction or a secret accumulation phase before a major pump — the next few daily closes will tell the story.

Bitcoins Final Leg / Market Analysis 2025Bitcoin has had a challenging year in 2025, as the market has proven to be extremely choppy, volatile, and frustrating for many investors. Following the massive liquidation event in October—followed by a secondary drop below $100K—many crypto investors have likely begun to lose confidence in this asset class and are now seeking opportunities elsewhere.
While I believe we are nearing the end of the broader market cycle, the current trajectory and sentiment suggest that we have not yet reached the extreme greed levels seen in previous peaks. Many altcoins have been decimated, and even the major cryptocurrencies have shown significant weakness, struggling to set any meaningful new all-time highs.
Now, I want to analyze the current price action through two theoretical lenses: Elliott Wave Theory and Auction Theory.
Elliott Wave Perspective
From an Elliott Wave standpoint, I believe we are witnessing what is known as a complex W–X–Y–X–Z correction. Essentially, this pattern represents a prolonged sideways pullback where price action forms a series of measured moves within a range. Each of these moves consists of a three-wave (A–B–C) structure. The completion points of these waves can be projected using trend-based Fibonacci extensions to identify symmetrical move targets.
When multiple A–B–C structures occur in sequence, they can form a larger W–X–Y–X–Z corrective pattern, with each letter representing the end of a smaller A–B–C correction. To illustrate this, I’ve labeled each minor A–B–C correction with its corresponding Fibonacci projection, showing a clearly defined structure filled with several measured move targets.
This pattern is significant because it represents the largest form of correction within Elliott Wave theory, indicating a major decision point for price action. A breakdown from here could signal a Wyckoff distribution pattern, potentially leading to much lower prices. However, if this correction completes and resolves to the upside, the price should resume movement in the direction of the broader trend—which remains upward.
Auction Theory Perspective
From an Auction Theory perspective, I aim to analyze the trading volume within this range to establish the Low Value, Fair Value, and High Value areas. Auction Theory suggests that when price breaks above a high but fails to sustain momentum, it often gravitates back toward the lower end of the value area—most commonly returning to the Point of Control (POC), or the most heavily traded price zone, also referred to as “Fair Value.”
In essence, price tends to oscillate between high and low value areas, frequently retesting fair value as a springboard for potential breakouts. Currently, we appear to be experiencing what’s known as a failed auction at the lower end of the range—where price attempted to break down, failed, and has since reclaimed the value area, potentially finding support near the range lows. If buyers step in here, the logical target would be the opposite end of the range high.
Confluence and Outlook
What’s particularly compelling is the confluence between the Elliott Wave count and the failed auction setup. Both suggest that Bitcoin is at a pivotal decision point. A successful defense of this value area could lead to a significant move higher, while a decisive breakdown would confirm the completion of a distribution phase and likely signal the start of a more prolonged bear market.
I’m particularly interested in how Bitcoin reacts at this key zone, as sentiment is currently at extremely low levels and several technical indicators are pointing toward the potential beginning of a larger upward move.
Entry Targets: $103,400
Stoploss: $99,500 (Daily Close)
Target: $120k +
Only time will tell.

Bitcoin – From Break to Battle: Will the Bulls Hold the Line?Bitcoin has broken its four-hour downtrend line, marking a potential shift in momentum after an extended bearish phase. The move has sparked renewed interest from buyers, signaling the first real attempt to reclaim structure after consistent lower highs. Despite this progress, the market remains trapped beneath a strong resistance area that has historically acted as a ceiling for price action.
Structure and Key Levels
Following the breakout, Bitcoin left behind a fair value gap, which has now been fully filled, resulting in a healthy bullish reaction. This confirms that the imbalance served as an effective demand zone, attracting buyers back into the market. Above current price, however, lies a key resistance zone that aligns with a previous liquidity sweep, keeping the risk of rejection in play.
Bullish Scenario
If buyers can maintain control above the filled gap and sustain momentum, the structure could expand higher as liquidity above recent highs becomes the next target. A decisive break and hold above the resistance zone would confirm the continuation of bullish intent and potentially establish a higher low formation on the four-hour timeframe.
Bearish Scenario
If price struggles to gain acceptance above resistance and fails to hold its current structure, a rejection could trigger a deeper retracement. This would likely drive the market back into the range below, turning the breakout into a liquidity grab rather than a true reversal. A return toward previous demand areas would then become likely as sellers reclaim control.
Price Outlook
At this point, Bitcoin appears to be consolidating between the strong resistance above and the fair value gap below. This range may act as a decision zone for the next leg. A clean break to the upside would confirm strength and validate the recent shift in structure, while a hard rejection would suggest that the broader downtrend is not yet over.
Conclusion
Bitcoin is at a crucial juncture, trading between a proven supply area and a fresh demand zone that just produced a strong reaction. The market’s next move will reveal whether this breakout can evolve into a sustained trend reversal or if it was simply another liquidity sweep within a broader bearish context.
___________________________________
Thanks for your support!
If you found this idea helpful or learned something new, drop a like 👍 and leave a comment, I’d love to hear your thoughts! 🚀

BTC is going up BTC has the potential to rise from this its curent price of 98292
to 116551 , A key suport level to watch is at 92278. BINANCE:BTCUSDT

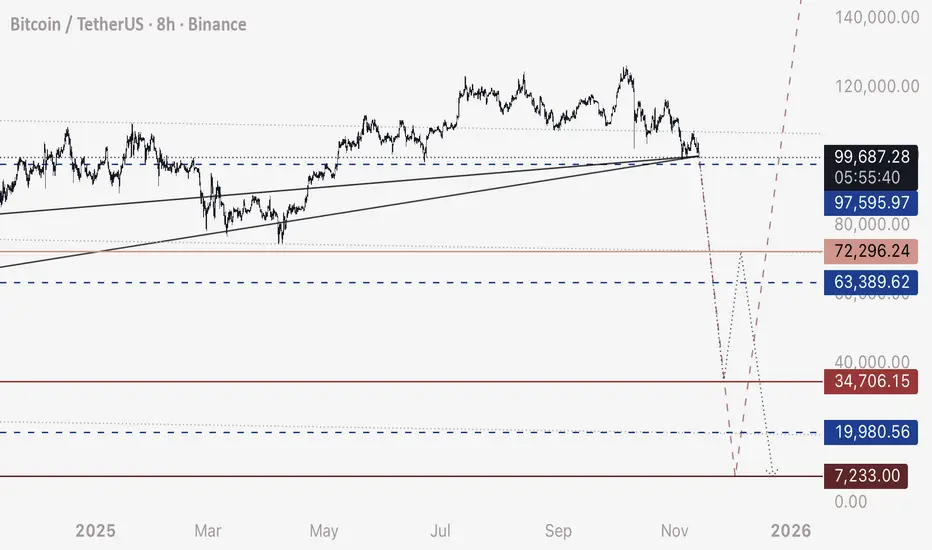
BTC - Ultimate Swing Short Update - Ready to Continue FreefallAs an update to my linked related signal post on “Ultimate Swing Short” - We are ready to freefall
Last major support has broken down.
Look for this 3 wave corrective drop:
100,000 to 35,000
35,000 retrace up to 72,000
72,000 to 8,000
Alternatively, it’s entirely possible we just freefall straight to 8,000 as all the long stop loss orders trigger one into the next.
Happy trading.
- DD