BTCUSDT.P - November 13, 2025BTCUSDT is currently in a short-term downtrend on the 30-minute chart, trading around $102,450. Price action is consolidating below a descending trendline, with key resistance at $104,825–$105,090 and strong support near $99,896. The structure suggests potential accumulation around the $100K level, with a possible revisit below recent lows before a rebound. A breakout above $103.5K–$104K would likely confirm bullish momentum toward $105K, while a drop below $99,896 could signal further downside. Overall, the short-term outlook is neutral to slightly bullish, contingent on holding support.
Trade ideas

BTCUSDT 2WHello 👋
Based on our previous analysis, we expected Bitcoin to pull back into a specific support zone before starting a new bullish leg. So far, the scenario has played out exactly as anticipated, and the price is now sitting in a region that can be considered a technically favorable area for potential entries.
However, there are several important fundamental factors to consider:
In recent weeks, no major economic data was released due to the U.S. government shutdown. Now that the government has resumed operations, a large batch of delayed data is about to be released all at once, which typically brings sharp volatility.
On top of that, the Federal Reserve has signaled that a rate cut in the next meeting is unlikely, adding more caution and pressure to the market.
From a technical perspective, there are additional signals to watch:
RSI is still below the 50 level, indicating weak bullish momentum at the moment.
Bitcoin has now touched its trendline for the fourth time, and repeated tests generally increase the probability of a breakdown.
Finally, if the price fails to bounce from the current region, and this support doesn’t hold, then the 74K–80K range is the next area where the market will likely revisit and find its next significant support.

BTC 1H Long BiasHigher-Timeframe (1D) Narrative:
BTC has traded deep into Daily sell-side liquidity, sweeping the June/July lows and tapping a clean Daily FVG + Demand zone.
This forms our HTF justification for bullishness:
Daily SSL sweep → liquidity taken
Daily FVG / Demand mitigation
Consecutive high-volume rejection wicks show willingness to reprice higher
Alligator on Daily showing early signs of slowing bearish momentum
This HTF context allows us to confidently look for 1H reversal → continuation long setups.
1H Execution (Long Bias)
After tapping Daily demand, price formed a 1H accumulation, took intraday sell-side, and printed displacement breaking short-term structure.
We now have:
1H OB + FVG alignment
Bullish displacement confirming short-term orderflow
Retest of 1H demand forming the entry zone
Clear inefficiencies above → targets
📌 Trade Details (1H Long Setup)
Entry:
📍 96,200 – 96,400 zone
Stop Loss:
📍 94,180
TP1: 101,013
TP2: 102,934
TP3: 103,989
Extended HTF target (optional):
📍 105,201 (Daily OB)

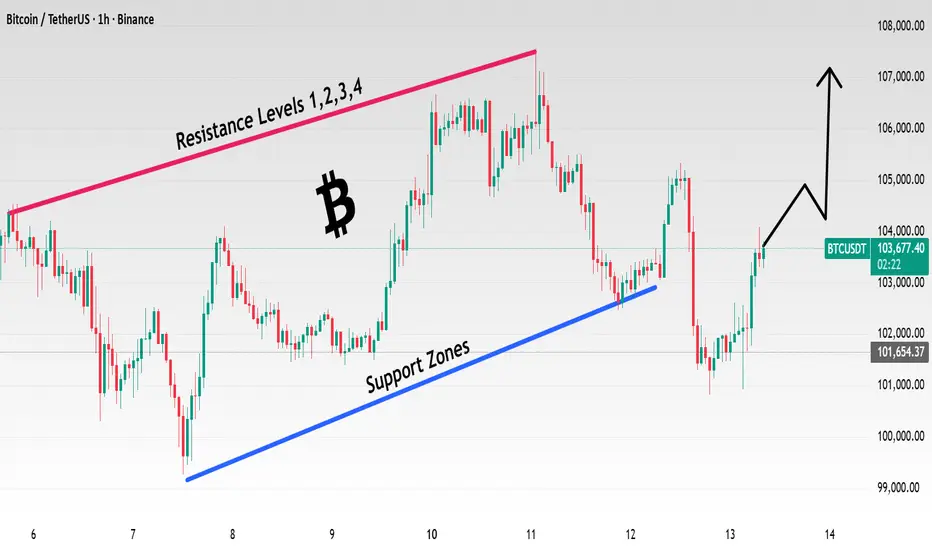
#BTC/USDT – Support Reversal & Bullish Recovery Outlook#BTC
The price is moving in a descending channel on the 1-hour timeframe and is expected to break out and continue upwards.
We have a trend to stabilize above the 100-period moving average again.
We have a downtrend on the RSI indicator, which supports an upward move if it breaks above it.
We have a key support zone in green that pushed the price higher at 95327.
Entry price: 95815
First target: 96158
Second target: 96865
Third target: 97661
For risk management, don't forget stop-loss orders and capital management.
The stop-loss should be below the green support zone.
Upon reaching the first target, take some profits and then change the stop-loss order to an entry order.
For any questions, please comment.
Thank you.

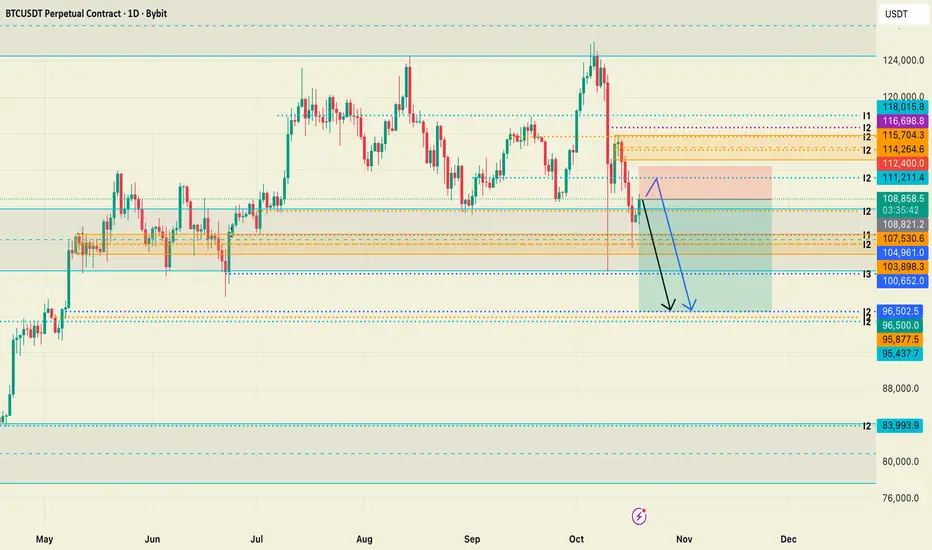
I expect a BTC drawdown on the daily timeframe.In the coming days, I expect a BTC drawdown on the daily timeframe to values of $96,500 to $95,400 from a price action perspective. I would enter a short position immediately, setting my Stop Loss (SL) above $112,400 and Take Profit (TP) at $96,500, which would represent a 3.44 Risk-Reward Ratio (RRR).
It is important to note that this is in no way financial advice, but merely my personal view on price action and my idea of where the price might go in the coming days.
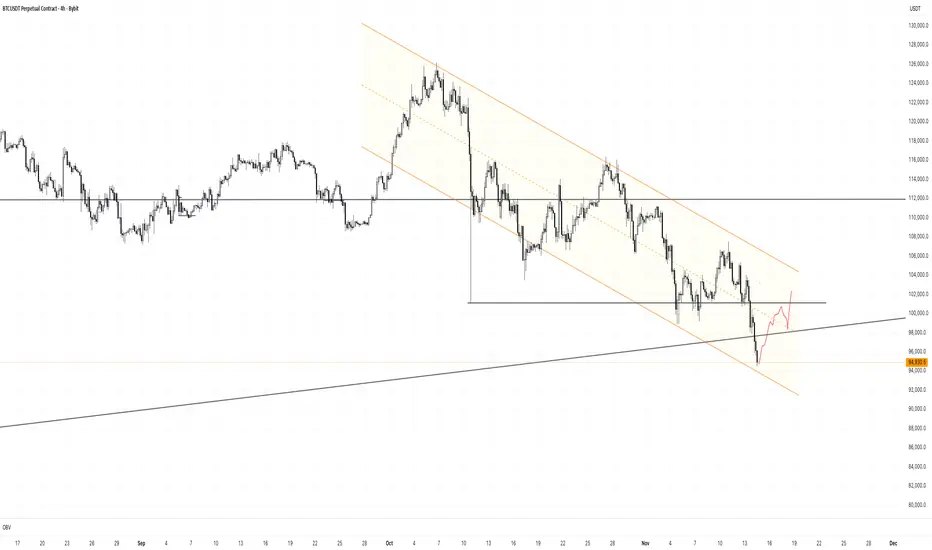
Bitcoin 4-hour updateHi traders
As expected, the market has collected all the liquidity areas drawn on the chart a few weeks ago and has entered the desired support area. So far, if you had followed my analysis, you would have made a profit of over $17,000, and of course, friends who followed along made good profits.
There are a few conditions to continue the path, which we will examine in the next post on the lower time frame.
Link to the main charts:

BITCOIN AT A CRUCIAL LEVELMy 1st post:
BTC is at the most crucial level now. Its at the support of the rising wedge.
Currently It has touched the 0.5 fib (blue) level $100k . If it sustains it can try to grab liquidity till 0.618 fib (red) $94K or CME gap just below it $92K (trap bears) and reverse till 1.272 fib (green) $133K -best scenario.
If it doesn't grab strength we may see sideways or bearish-rising wedge breakdown.
For support levels: Fib retracement: From April Low to Oct High
For bullish scenario target: Fib extension: From Oct / all time high to current low

BTCUSDT – Bullish Reversal Building Up | 1H Chart AnalysisBtcudt is trading near $103,600, showing early signs of recovery after rebounding from the $101,500–$102,000 support area. Price action is shaping an ascending channel, with both boundaries clearly respected.
The recent bounce from the lower boundary highlights renewed demand within the structure. As long as BTC holds above 102,000, short-term momentum may favor further testing of higher resistance zones.
Potential resistance lies near $105,500, $106,800, and $107,000, aligning with the channel’s upper range. A decisive break below 101,500 would invalidate the current bullish structure and shift bias to neutral.
Structure: Ascending Channel
Market Bias: Mildly Bullish (above 102,000)
Key Levels: 101,500 (support), 105,500–107,000 (resistance zones)
Disclaimer
This analysis is for educational purposes only and does not constitute financial advice.
Start Accumulating BTC!Bitcoin has reached a major demand zone between $91,000–$97,000, an area that has consistently acted as a strong support throughout 2024–2025.
Price has now tapped the bottom of this accumulation zone, where buyers previously stepped in aggressively.
Key Points:
BTC is sitting inside a high-probability bounce zone.
Historically, this region has triggered strong upward reversals.
Market structure is still intact as long as price holds above $91,000.
Perfect area for long-term positioning.
Start accumulating BTC within this support zone.
This is one of the cleaner levels to build exposure before the next macro move.

Bitcoins Morning Chart View📊 Going over Bitcoin’s price action today.
Looking at both sides — possible 🟢 bullish continuation and 🔴 bearish continuation scenarios.
Just sharing my view, not financial advice.
Let’s see how it plays out. ⚡💭
#Bitcoin #BTC #Crypto #PriceAction


All Bitcoin 6 Month Moves following a Death Cross (1D Timeframe)Analyzed all the previous 6 month moves of BTC after a death cross. Turns out they are a lot less bearish than you would assume.

It's the future in your handsBitcoin Price Production Cost
Based on current efficiency trends and average energy prices, the production cost is expected to rise to around $175,000 per BTC by early 2028, following the next halving. This level has aligned closely with past cycle lows, suggesting that if Bitcoin remains above its cost basis, its fair valuation could approach $200,000 by that time.
Extending this trend, the projected cost to mine one BTC could reach approximately $675,000 by 2032, assuming moderate improvements in miner efficiency and no dramatic changes in Global energy costs. Historically, Bitcoin’s price has peaked at multiples of its production cost, around 9x in 2017, 4.5x in 2021, and roughly 2.25x this cycle. If that diminishing pattern continues, even a 1.5x multiple during the 2032 cycle would place BTC at around $1 million, suggesting that the next major peak could arrive sometime in the mid-2030s.

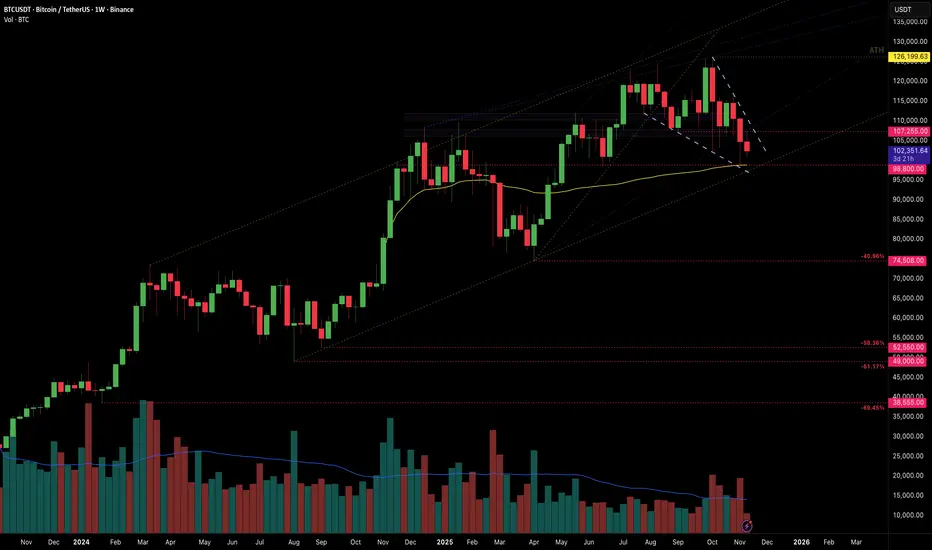
BTC Forming Multiple Bear Wedges on Weekly TimeframeSince failure to break above 126K, I am looking for continuation of descent towards levels market in red. We have:
1. Three failed attempts to go above 120K.
2. Dominating selling volume on weekly BTC market capitalization chart.
3. Diamond / Bear Wedge Patterns formation on daily and weekly timeframes.
4. Approximate end of Bitcoin bull cycle.
5. Absence of supporting buy-back volume on any time frame.
6. Most of the pumps get dumped within an hour.
7. Clear huge sellers at 108K zone and 102K.
Bitcoin Daily — Correction Gone WavyHey everyone!
The correction in Bitcoin turned out bigger than I expected — it unfolded as a clear three-wave ABC, and wave A itself was a flat ABC.
Right now, I believe the correction has come to an end, and Bitcoin is already hinting at another leg down.
🎯 My downside targets:
• Target 1 — $102,000
• Target 2 — $98,000
• Target 3 — $94,000 (I’m placing Target-3 at $94K, but I don’t rule out a drop to $92K)
❌ Invalidation Zone — $107,100
Also, just to remind — globally I’m still expecting Bitcoin to reach around $83,000.
However, after a drop toward ~$94K, there might be corrective bounce, so BTC can gain some strength before continuing lower.
⚠️ As always — don’t trade without stop-losses!
If you enjoy my daily Bitcoin outlooks and want to see more of my market vision, don’t forget to like, comment, and follow — your feedback means a lot! 💬🔥
Stay tuned for what’s next! 🚀

BTC/USDT Analysis. Entering a Bear Market?
Hello everyone! This is the CryptoRobotics trader-analyst, and here is your daily analysis.
Yesterday, Bitcoin resumed its decline from the highlighted local resistance. After retesting the $102,000–$100,000 buy zone (volume anomalies), the market showed no reaction, and the downtrend continued without interruption.
Despite how dramatic the picture may look, price has now reached a medium-term support zone at $97,000–$93,000 (high-volume area), from which Bitcoin may find support and bounce toward the $101,000 region.
The medium-term structure remains strongly bearish — even if buyers step in, another wave of selling looks highly likely. However, the global (daily) structure still allows for a more meaningful recovery rather than just a short correction.
If the buyer fails to defend $97,000–$93,000, the next major support lies in the area of $88,000–$82,000 (high-volume zone).
Buy Zones
$97,000–$93,000 (high-volume zone)
$88,000–$82,000 (high-volume zone)
Sell Zones
$101,000–$104,000 (accumulated volumes)
$105,800–$106,600 (local resistance)
$109,500–$110,700 (accumulated volumes)
$112,400–$113,300 (accumulated volumes)
$114,700–$115,700 (accumulated volumes)
$120,900–$124,000 (high-volume zone)
This publication is not financial advice.

Time for Bitcoin to bounce is nowApproaching bottom level of downtrend, time to bounce now.. Does it hold it??
BTCThat’s what I see..
Maybe later I will post what I see for the price movement on the higher timeframe.

BTC bear startedThat's all folks. Thanks for playing. See you at the bottom when Saylor BTC positions will be liquidated...or what

DeGRAM | BTCUSD BTCUSD is aiming to reach a key support level.📊 Technical Analysis
● BTC is approaching a major confluence zone where the long-term support line meets the key demand area near 94k–92k. This level previously triggered strong reversals.
● Price remains inside a broad falling structure, and a bounce from the lower boundary would confirm trend exhaustion and open room for recovery toward 102k–108k.
💡 Fundamental Analysis
● FXStreet reports renewed inflows into BTC ETPs and improving risk sentiment as markets expect milder Fed policy, supporting medium-term bullish pressure.
✨ Summary
BTC nearing 94k–92k demand; bounce may target 102k–108k. Key support: 92k. Break above falling trend = continuation.
-------------------
Share your opinion in the comments and support the idea with a like. Thanks for your support!

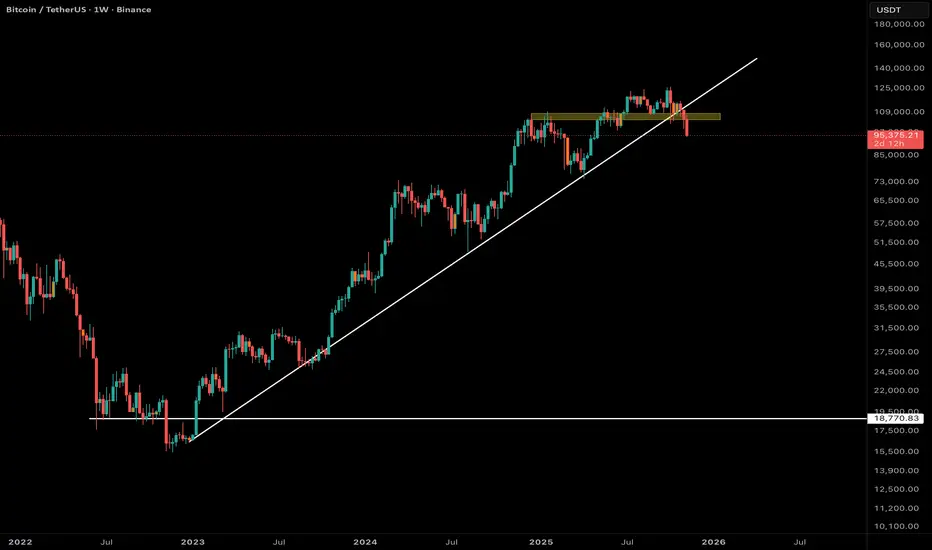
Just a thought on the BTC weekly chartThis is purely speculation and only being posted as some food for thought.
There is a possibility that BTC could be forming or may have already formed and broke down from a rising wedge pattern on the weekly time frame. I have two possible ideas for this.
Possibility 1 utilizing the red support trend lines has two deviations below support early on in the formation of the pattern. If this idea was to become reality, that would mean price has already broken down and has had one weekly candle close beneath support and has tested it as resistance. If this is true, we have a price target of roughly $22,500. The only positive in this scenario is that this candle has not yet closed and still leaves a chance to continue the pattern formation further or invalidate it completely.
Possibility 2 outlined by the green support trend line contains the price action in its entirety and would stand to be a stronger possibility than the first since it is a much cleaner pattern without any deviations unlike the first. With that being said though, following this possible pattern idea could give a price target as low as $18,500. Also unlike price action in the first scenario, it is still in the formation phase. Leaving a much better chance of a higher price target or invalidating the pattern as well.
Again, this is only something to keep in the back of your head and has a serious chance of being nothing at all. But its always good to keep that greed monster in check. Because at some point, what goes up, must come down. Trade safe friends.

Reversal Confirmed After Sell-Side RaidLiquidity swept. Structure reclaimed. Bulls stepping back in.
Now expecting a push toward the trendline break and buy-side liquidity 🚀📈
🚀Price swept the sell-side liquidity and reclaimed the range low, confirming a potential bullish reversal.
🚀The liquidity sweep + bullish divergence signals a shift in momentum, with price now retesting the breakout zone.
🚀If this structure holds, the next objectives sit toward the trendline break and the buy-side liquidity above.
🚀Watching for continuation into the 1st TP and possibly a full run toward major highs.
