Trade ideas

Reversal Confirmed After Sell-Side RaidLiquidity swept. Structure reclaimed. Bulls stepping back in.
Now expecting a push toward the trendline break and buy-side liquidity 🚀📈
🚀Price swept the sell-side liquidity and reclaimed the range low, confirming a potential bullish reversal.
🚀The liquidity sweep + bullish divergence signals a shift in momentum, with price now retesting the breakout zone.
🚀If this structure holds, the next objectives sit toward the trendline break and the buy-side liquidity above.
🚀Watching for continuation into the 1st TP and possibly a full run toward major highs.

BTCUSDT.P - November 14, 2025BTCUSDT.P – 15m
Trend:
Price remains in a clear short-term downtrend, confirmed by the descending trendline that continues to act as resistance.
Current Structure:
Price is consolidating just above a nearby support area around 96,800–97,200.
A second, larger support area sits lower at 93,500–94,200, which may be tested if the current support fails.
Key Levels:
Resistance: 99,300–99,800, which aligns with the descending trendline. This is a strong area where sellers have previously reacted.
Support:
Immediate: 96,800–97,200
Major: 93,500–94,200
Scenarios:
Bullish:
A decisive break above the descending trendline combined with a move back above 99,300–99,800 would suggest a potential short-term trend reversal.
Bearish:
Failure to break the trendline and a drop below 96,800–97,200 would increase the likelihood of price moving down toward 93,500–94,200.
Momentum:
Recent candles show indecision and limited follow-through, indicating the market is waiting for a breakout or breakdown at this trendline–support intersection.

BTCUSD TO 87K SOON SELL NOW!!!!!!BTCUSD took out the sell side liquidity which is my internal structure low and also completed my last analysis predictions to 98k now am expecting a dump down to 87k after this pull back.....

BITCOIN SIGNAL: HERE IS WHATS NEXT!!!! (boom)Yello Paradisers! Enjoy the video!
And Paradisers! Keep in mind to trade only with a proper professional trading strategy. Wait for confirmations. Play with tactics. This is the only way you can be long-term profitable.
Remember, don’t trade without confirmations. Wait for them before creating a trade. Be disciplined, patient, and emotionally controlled. Only trade the highest probability setups with the greatest risk to reward ratio. This will ensure that you become a long-term profitable professional trader.
Don't be a gambler. Don't try to get rich quick. Make sure that your trading is professionally based on proper strategies and trade tactics.

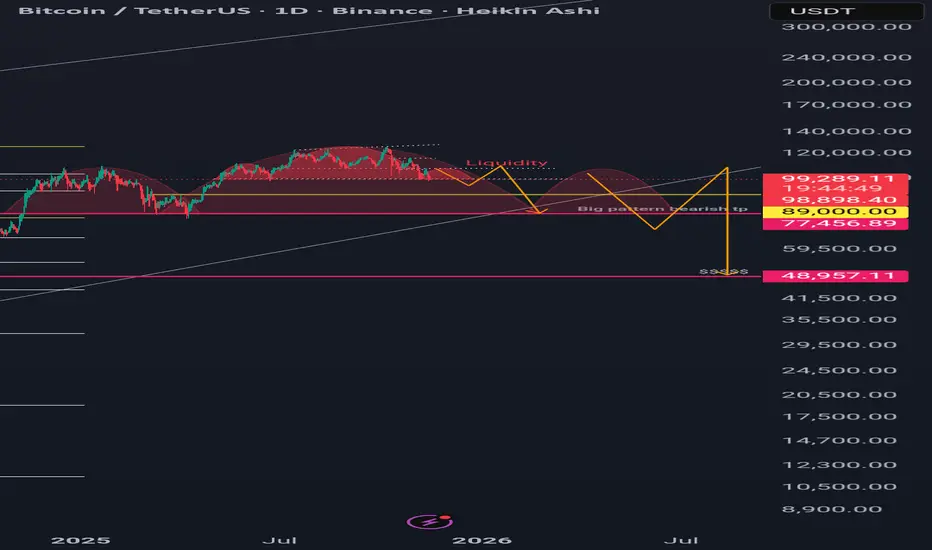
The future of Bitcoin in the coming yearA significant crash in Bitcoin is approaching.
Following the failure of the head-and-shoulders top pattern and weekly close below it, Bitcoin faces a major decline.

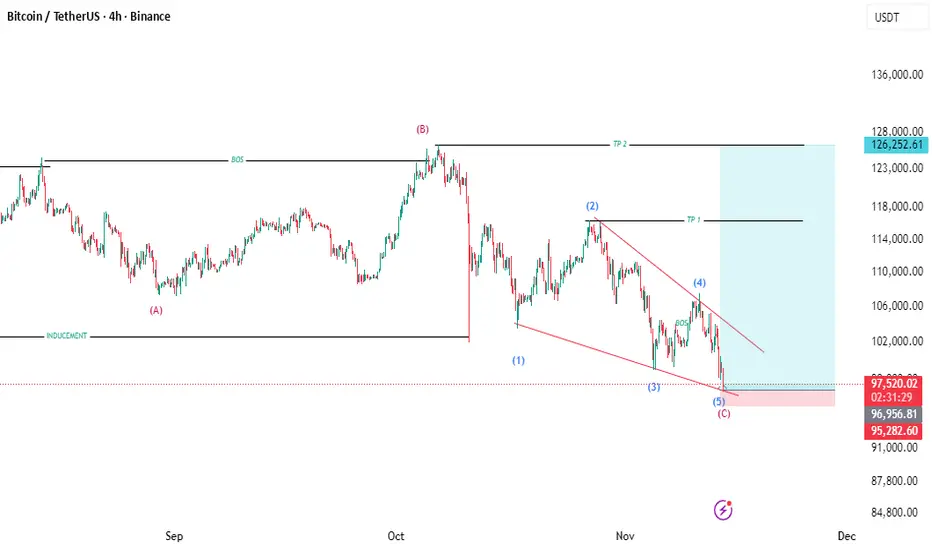
BTCUSD – Ending Diagonal Completion + Bullish Reversal SetupTimeframe: 4H
Bias: Bullish Reversal
Setup Type: End of C-Wave + 5-Wave Ending Diagonal + Break of Structure (BOS)
Market Context
From your chart:
Price completed an A–B–C corrective structure, with the C-wave finishing inside a descending wedge/ending diagonal.
Wave counts (1) → (5) suggest a completed 5-wave down.
Price is currently sitting in a red demand zone / inducement zone.
A Break of Structure (BOS) already occurred on the lower timeframe, signaling a possible trend reversal.
The setup aligns with a bullish reversal from a mitigation zone.
BUY Opportunity for BTCUSDT
BUY ENTRY ZONE
$95,200 – $97,800
BTC Daily Liquidity / Monthly FVG – UpdateFollowing the analysis from previous weeks, BTC has finally moved below the VAL and is approaching the preferred zone for a swing long.
Price action remains weak, could be that institutional long orders are not being filled yet. On LTF there are signs of accumulation, but overall the market still looks fragile, daily structure still does not print a bottom pattern. I maintain my primary scenario: sweep the daily liquidity at 98K and extend lower into the 96–97K zone, where we have a strong confluence:
-Daily OB
-50% of the Monthly FVG
-Monthly/Daily trendline support
From there, I’m considering two entries:
Entry 1: 97.5K — Stop: 96K
Entry 2 (if the Monthly FVG is fully filled): 95K — Stop: 93K
If neither of these scenarios holds, then alternative scenarios come into play outside of the current plan.

Btcusdt a day close will confirm the first pattern
A bearish H&S pattern confirmation will form after this day closes. The probable target is to hit the top of the right shoulder first before dropping to the 77k area. Just my insight—I can't stop seeing this pattern.
They are probably targeting a drop in the market to buy at a lower price before the higher-ups change—a year or half a year before new leaders take over.
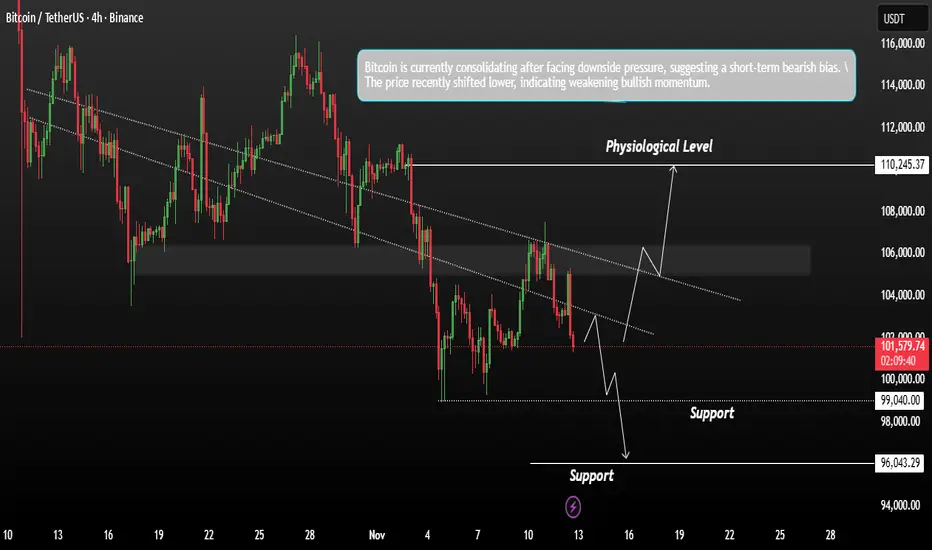
Bitcoin Price reacting scenario setup what should next ?Bitcoin is currently consolidating after facing downside pressure, suggesting a short-term bearish bias. The price recently shifted lower, indicating weakening bullish momentum.
From a macro perspective, U.S. stock markets surged on Wednesday as investors anticipated updates from the U.S. House and the ongoing government shutdown discussions. In contrast, Bitcoin fell from an intraday high near 105,000 to a weekly low around 101,000, marking a 3.4% decline.
If bulls manage to regain control and push the price above the current consolidation zone, a breakout could occur a sustained move above the new trendline may lead BTC toward 107,000–110,000 in the near term.
If the price continues to show weakness and fails to hold current support levels, a breakdown could occur In that case, BTC may revisit the 99,000– / 96,000 range as the next short-term downside targets.
You may find more details in the chart,
Trade wisely best of Luck.
Ps; Support with like and comments for better analysis Thanks for Supporting.
BTC & Crypto Winter 2.0 - The Foundation Cracked on 10.10.25The Setup
While everyone's celebrating Bitcoin near all-time highs and institutions piling in, I'm seeing something different. The market's telling a story most people are missing.
What Happened October 10th
No news. No warning. Just a massive liquidation cascade that wiped out every leveraged trader in one move.
The damage:
All leveraged positions liquidated
Traders gone for good - no capital left to rejoin
Zero-sum game: someone collected all that money
Bid support disappeared overnight
This wasn't natural price action. This was a reset.
The Missing Bids
Here's what people aren't seeing: those liquidated traders provided bid support. They're not coming back. They have no money to trade with!
In futures, it's always zero-sum. Their losses became someone else's gains. But those traders? Done. The bid side just lost a massive chunk of participants.
The MSTR Problem (Barings Bank 2.0)
While indices hit all-time highs and Nasdaq rockets with no pullbacks, MSTR is 50% off its highs.
The numbers:
$7.26B in debt
Net income: -$4.22B (negative margin of -3,797%)
Revenue declining: $496M (2023) → $463M (2024)
Free cash flow 2024: -$66.51M (-780% change)
Operating income: -$63M
Total debt jumped from $0 (2019) to $7.26B (2024)
This is Nick Leeson buying Nikkei at the 40-year top all over again.
Leeson doubled down with borrowed money, hid the losses, and collapsed Barings Bank - 233 years old, destroyed in weeks.
Saylor's doing the same thing. He's leveraged MSTR to buy Bitcoin near tops while the actual software business bleeds cash. When BTC cracks, he's holding $7.26B in debt on an asset that could drop 70-80%.
The market knows: MSTR trading 50% down while everything else moons tells you what's coming.
The Privacy Trojan Horse
Everyone bought the "privacy from government" narrative.
Reality?
Every exchange requires passport + bank statements
Every transaction is traceable
KYC everywhere
The surveillance they promised to escape? They delivered it.
People bought freedom, got tracking.
Why Crypto Winter is Coming-
The setup:
October 10th removed all leveraged bid support
MSTR overleveraged at $7.26B with a dying business
Indices at all-time highs (distribution phase)
Retail bullish at the top
No new bid support to replace liquidated traders
The parallel:
When indices correct, Bitcoin doesn't hold. It leads the crash. And this time, there's no leveraged traders left to provide support on the way down.
The Trade
Short Bitcoin
Entry zone: I am not your mom, use your own head
Target: Look at the picture
Stop: You should now this before getting into positions
Thesis: Foundation cracked Oct 10th, MSTR collapse incoming, no bid support
Risk factors:
Could go higher first (blow-off top)
Saylor could sell equity to cover debt (temporary support)
New institutional buyers could provide bids
Confirmation signals:
MSTR breaks down further
Bitcoin fails to make new highs while indices continue up
Volume declines on rallies
Final Thought
Everyone's watching Michael Saylor pump Bitcoin on Twitter while his company's financials look worse than pre-2008 subprime lenders.
The October 10th liquidation was the warning shot. The foundation cracked. We're just waiting for Bitcoin to catch up to what MSTR's price is already telling us.
MSTR is headed to zero. Bitcoin is headed to crypto winter.
This is not financial advice. Do your own research. Markets can remain irrational longer than you can remain solvent.

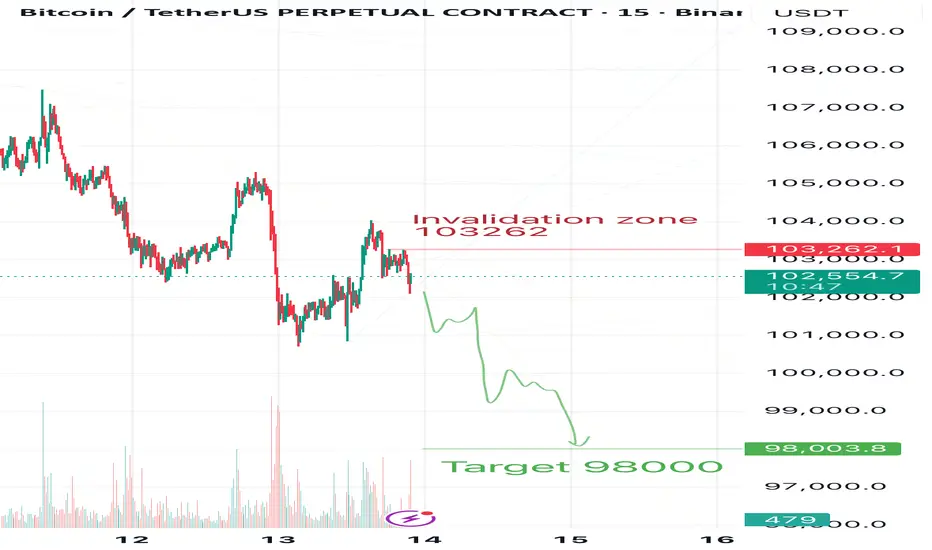
Bitcoin Daily — From 103 to 98k, MaybeI’m no longer waiting for Bitcoin to reach 100K, as I mentioned yesterday.
Now my target is 98K — and in my opinion, all the signs for this move are already in place.
In my previous posts, you can find my global target for Bitcoin at 83K, but that’s not the focus today.
❌The invalidation zone is marked on the chart — 103,262.
🎯Target: 98,000.
⚠️This is not a signal, just my personal view of the market.
Trade based on your own system and always use stop losses.
💬Share your thoughts in the comments, react if you agree, and follow me so you don’t miss my daily Bitcoin updates
BTC WEEKLY UPDATE - 97K TARGET ALMOST HITBack in my earlier analysis, I mentioned that $97,300 would be the ideal buy zone based on the 0.236 Fibonacci retracement (from the 2020 low at $3,621 to the projected 2025 top at $126,208).
That level has now been reached, perfectly aligning with the long-term trendline support drawn from the 2021 highs.
Price dipped into the $97K–$98K range, confirming the area I’ve been watching for weeks. RSI on the weekly timeframe has also retested its trendline — repeating the same structure we saw earlier in 2025 before the last major rally.
My Plan
I’ll be partially entering long positions here between $97K and $98K, keeping some capital aside in case of a deeper wick.
As long as Bitcoin stays above $95K on a weekly close, my macro bullish outlook remains intact.
If this structure holds, I expect the next major leg to target $120K–$126K into 2025.
Summary
✅ 0.236 Fibonacci support ($97.3K) reached
✅ Long-term trendline retest confirmed
✅ RSI repeating previous bullish pattern
🔹 Partial long entries initiated at $97K–$98K
🔹 Invalidation below $95K
🎯 Next targets: $120K–$126K
🟢 Conclusion:
The technicals are lining up exactly as projected — Bitcoin is now in the perfect accumulation zone for the next major move up. I’ll be scaling in gradually here with a long-term bullish bias.

BTCUSDT-4Hafter BTC could not break the zone that i said in my previous analysis,
formed a new LL and i think it can grab the previous liquidity structure after that we can wait for confirmation to get in long positions...

Bitcoin Bearish Reversal SetupBitcoin is showing a potential bearish setup as the price approaches the central resistance zone. A rejection from this area could lead to a downward move toward the 101,500 target level, with selling pressure expected below the trendline.

Bitcoin LONG OpportunityBitcoin Potential Long
Recently, we observed a liquidity sweep targeting key swing points, including the Previous Day’s Low (PDL), which represents sell-side liquidity within the previously established range.
Going forward, I anticipate that price may continue to draw toward liquidity levels below the current range , specifically the Previous Week’s Low (PWL) and an unfilled imbalance within the Monthly Fair Value Gap (FVG).
Should price reach this zone, I will be closely monitoring market structure and lower-timeframe price action for signs of a potential reversal or long setup from that area towards Buyside Liquidity.

BTC Daily Scene — Still Not GreenAs you know from my previous publication, I’m still expecting Bitcoin to reach 100,000 and below.
The invalidation zone of my previous bearish scenario was 105,465 .
At the moment, Bitcoin tried to approach that zone but failed to even touch it , which only confirms its intention to keep heading down toward my target area — 100,000 and lower .
My global downside target is 83,000 , but for now, I only expect 100,000, since I don’t believe Bitcoin will drop straight to 83K in one go.
⸻
⚠️ Disclaimer:
This is not a trading signal, just my personal analysis.
Always trade according to your own system and use stop losses.
⸻
💬 Follow me so you don’t miss my daily Bitcoin analysis — the story continues!

Your Feedback MattersOver the past two years, many of the patterns, warnings, and market projections I’ve shared here have played out exactly as outlined — from major Bitcoin tops to deep corrections and cycle repetitions.
This page has always been about studying how history repeats itself in the crypto market, and it’s been incredible to see those patterns come alive again and again.
Now, I’d really like to hear your perspective.
If you’ve been following my past posts — or if you’re just seeing this one — drop your thoughts in the comments:
Do you see the same patterns forming again?
Do you believe Bitcoin’s behavior truly repeats?
Your insights, reactions, and even disagreements help this page grow and keep the analysis evolving.
Let’s turn this into a real discussion — not just another chart you scroll past.
— Captain-AMM8 ⚡

Alt seasonwelcome to alt party .after 4 years its started to move . because its a last movement of btc and its caused the alt coins pump before ,
now plz dont forget to invest in some coins or tokens with the good potential .

#BTCUSDT: From $74,000 to $88,000 Moving Well! More Growth CominIt’s been on a steady climb from $74,000 to $88,000. We’re expecting even more growth in the coming weeks. The price has finally broken free from its consolidation phase and is now on the rise. We think it’ll reach $94,000, then $100,000, and maybe even go up to $120,000 by the end of the year.
What do you think? Let me know in the comments below!
Thanks!
Team Setupsfx_

DeGRAM | BTCUSD will rebound from the $100k level📊 Technical Analysis
● Bitcoin is trading above the long-term support zone near $100 K, where a double-bottom formation took shape, suggesting base formation ahead of a potential breakout.
● The market approaches a descending resistance line around $106 K–$108 K, with recent upside momentum hinting at a retest of this resistance while preserving the higher-low structure.
💡 Fundamental Analysis
● Bitcoin’s bullish case is reinforced by renewed institutional accumulation and broader digital-asset adoption, while improving macro risk sentiment lessens safe-haven crowding.
✨ Summary
• Support: ~$100 K region
• Resistance: ~$106 K–$108 K
• Bias: Long above support with breakout potential toward ~$110 K on momentum and accumulation signals.
-------------------
Share your opinion in the comments and support the idea with a like. Thanks for your support!

DeGRAM | BTCUSD will test the $101k level📊 Technical Analysis
● BTC/USD is approaching a key confluence of descending resistance lines after rebounding from the $101,000 support area. This level aligns with the broader resistance channel that has capped price since mid-September.
● Despite recent recovery attempts, the structure remains bearish, with lower highs signaling that sellers may regain control near $107,000–$108,000, potentially driving a retest of $101,000.
💡 Fundamental Analysis
● Bitcoin faces pressure from stronger U.S. economic data and rising Treasury yields, reducing appetite for risk assets in the near term.
✨ Summary
● Resistance: $108,000. Support: $101,000. Rejection at resistance could trigger a correction toward $98,000–$101,000.
-------------------
Share your opinion in the comments and support the idea with a like. Thanks for your support!

Bull Season Likely PlaybookThis current support just needs to hold and you might want to go all in. A little retracement at key areas but then up only, according to this chart.
