BTCUSDTKey Guidelines to Remember:
Our starting capital is $1,000.
For the first signal, the maximum permitted loss is $1.
For the second signal, the maximum permitted loss is $2, and so on, following this incremental pattern.
The initial risk-to-reward ratio is 1:3.
If a stop-loss is triggered, the risk-to-reward ratio for the next signal increases by 1 unit (e.g., from 1:3 → 1:4).
Example Implementation:
Signal 1: Risk $1 → Reward $3 (1:3)
If stopped: Signal 2: Risk $2 → Reward $8 (1:4)
If stopped again: Signal 3: Risk $3 → Reward $15 (1:5)
Stay disciplined and adhere to the capital allocation rules.
Trade ideas

BTC dip and just hit buy zone between fibi 50-61.8BTC dipped and just hit the buy zone between Fibonacci 50–61.8”, it means:
• Bitcoin has pulled back (corrected) after a recent uptrend.
• The price has reached the key Fibonacci retracement area (50%–61.8%), known as the “golden buy zone.”
• This zone is often where buyers enter and the uptrend may resume, making it a potential buying opportunity — if supported by other confirmation signals.

Relief Bounce incoming on BTC? We've smashed through all my previous levels for today but there is still a bit of vector candle to recover just below here at point 6. Is this the beginning of the end for this cycle?

BTC 1WBitcoin chart on weekly time frame
So simple and understandable to the public.
As long as the $100,000-$98,000 support zones are not broken, the uptrend will continue, but at a weak pace, indicating a weakness in the trend.

BITCOIN analysisThis is a outlook on where price can reverse and continue the uptrend for bitcoin. Those two are the main POIs where bitcoin can react from.

Bitcoin shortBtc forming a clear divergence on the weekly rsi.
Ususally indicates a down turn. Closes below the 50 week ma at 102,500 historically confirm beginning if bear


Bitcoin falling to lower levels but be careful with fresh shortsBTC changed character on the h4 with a strong expansion to the downside. RR for fresh shorts is not in your favour, but upon relief, looking for a hedge is ideal.
However, sentiment will play an important role. Upon relief using support as resistance, many will enter this short bias. This could lead to a very important short squeeze.

BTCUSDTToday, after four consecutive stop-losses, the fifth position with a 1:8 risk-to-reward ratio successfully recovered all previous losses and resulted in a $45 profit.

Is 92k possibly the target?BTC might go for a trip near key support zones.
92 first
Or 130 next?
I think we are going for quite a trip before the next ATH

BTC/USDHello, considering the recent statements of the Federal Reserve members regarding controlling inflation by using policy changes in the federal funds rate, as well as the possibility of no interest rate cut until the end of this year, and on the other hand, technically, the flag structure breaking down, I expect a further decline in the price of Bitcoin to the target of 93997

The Pink Elephant in Bitcoin That Everyone IgnoresYes, my friends. The game is over, and sadly, it seems like only I have to point this out to you because no one else is talking about it. Let's jump straight into the total liquidity in crypto.
As you can see, it's broken its weekly support. Look, I don't want to say our HWC—or weekly—trend has turned bearish, but I can tell you that if the daily candle closes like this, we're heading into corrections and a whole lot of pain.
Let's circle back to Bitcoin. Starting with the monthly candle
there are 26 days left, so we can't judge it fully yet, but right now, it's looking very bearish: small upper and lower shadows with a full, powerful bearish body. Combine that with the previous four indecisive candles... it's like we've got a car where all the seats are full except the driver's, and suddenly some random seller jumps behind the wheel. Okay, it's done—let's prepare for the drop. But this doesn't mean the HWC has changed ; we're still in an uptrend, and we'd need to break higher highs and lower lows to confirm that. But damn, of course we'll short in its secondary trend... why not?
Moving to the weekly timeframe
as you can see, each wave is proving weaker than the last: the first wave had 180% growth, the second 100%, and the latest one just 50%.
Now, on the daily
it's breaking that key 105k support. Around 100k, we've got another super important support level. If we lose that, the next ones are 98k and 95k. So, open your short positions on the break of 100k—keep in mind, the volatility around there will be intense.
For longs, we've got two scenarios.
1: A reaction at 101k, faking out the 104k break with a reversal pattern, then going long on the break of its resistance (which could be around 108k). Scenario 2: Going long after forming higher highs and lows on the 4H timeframe. Personally, I prefer to hold onto my long bias because, as I mentioned before , Bitcoin's uptrend legs have gone parabolic in this phase. That means if you don't jump in on the first leg, finding a stop loss on the later ones gets tough, you end up with lower R/R, plus a lower win rate—which leads to more losing streaks, more frustration, brewing the worst coffee of your life, and banging your head against everything else :)) So... that's it. Get outta here.

What next for BTC? One more final leg to 92K awaits!
We have DEATH CROSS up ahead and every time this event occurred, a new leg started and BTC hit new ATH in a matter 6-7 months!
Now, what next after 92K? BTC likely to bounce back strong for another leg cause of loads of factors which can bring massive liquidity into the market which I would like to call it the "WINNERS CURSE" - final leg up which we could possibly top around 6-7 months from now!
Target remains 140 - 150K 🚀🚀🚀
So, I highly recommend paying yourself with these discounted prices!

Bitcoin on the weekly time frameI put the Bitcoin analysis in the weekly timeframe in the closed view so that I can show it with better explanations.
The image shows a double top reversal pattern.
But the point about this pattern is that this pattern is known as a double top in the classic patterns category, but due to its different shape, it is known as the B2 pattern in the advanced patterns category. The difference with the classic double top is that in the B2 pattern, the second top is two candles, and the second candle of the second top goes higher than the first candle of the second top, and usually in this pattern, the trend reverses more quickly.
Due to the formation of this pattern and the breakdown of the neckline, the targets of this pattern are the $100,000 or $90,000 ranges.
But if the trend reverses and the candles manage to break the previous top again, my analysis will be invalid.

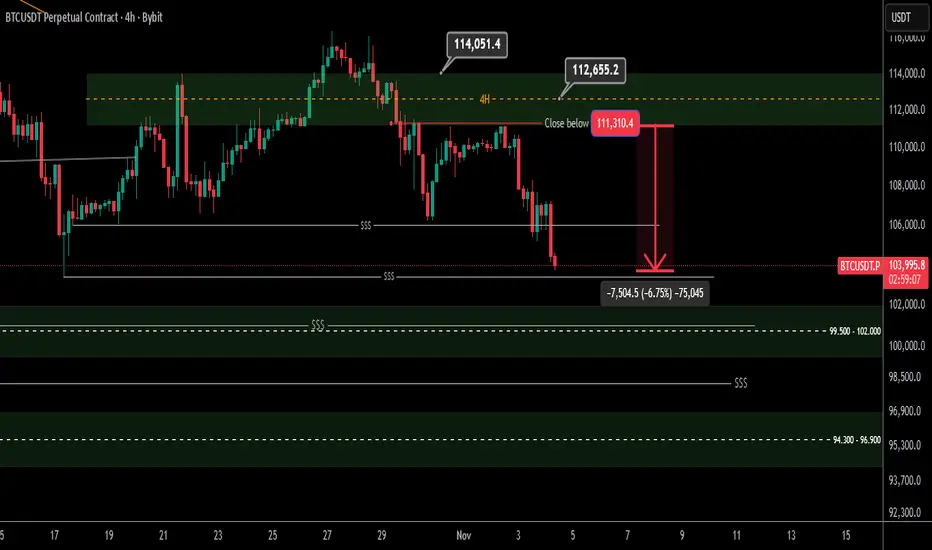
Bitcoin 4 Hour Update
Hello Traders
Bitcoin moved towards lower liquidity as expected and so far we have made a loss and profit of about $7000. This will continue to be a bearish structure to gather liquidity and important support below all these liquidity levels will be the 96k/94k range where we will look for a trigger buy
Analysis link and entry range:
Tuesday Asia Range AnalysisTuesday Asia is a 1% consolidation with single session M formation indicating lower movement.
Current areas of interest down include:
1 - previous day low sweep and/or vector candle 104,800
2 - Daily ADR low
3 - Previous low and remainder of longer term unrecovered vector candle

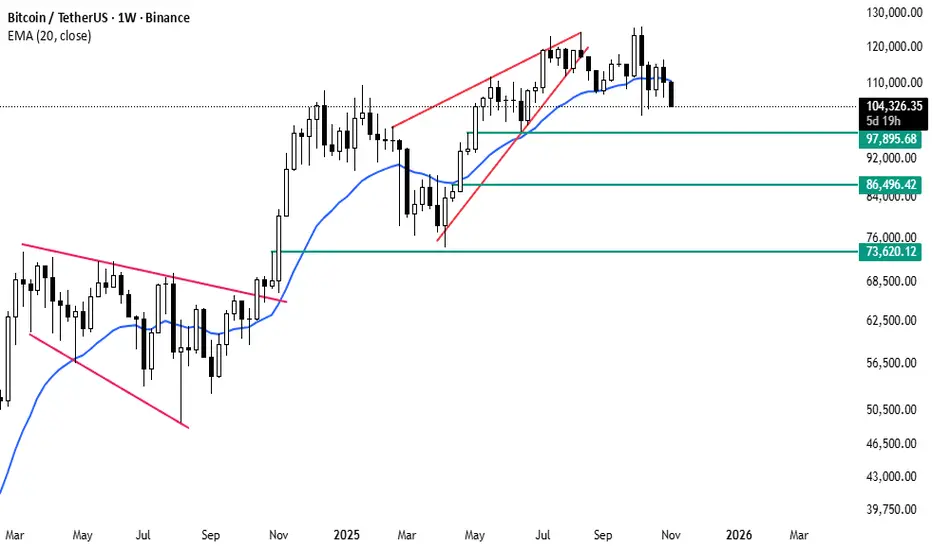
Bitcoin Weekly Analysis — Potential Pullback ZonesBitcoin is currently trading around $104,500, showing signs of weakness after failing to maintain the highs near $120,000. The weekly chart suggests that price is testing the 20 EMA, which has acted as dynamic support throughout the recent bullish trend.
If the current consolidation continues, possible pullback zones can be found at:
$97,900 – minor support and the first reaction level
$86,500 – major support aligned with previous demand area
$73,600 – key structural level from the last breakout base
As long as Bitcoin remains above the 20 EMA, the broader trend stays bullish. However, a clear weekly close below this average could open the door for a deeper correction toward the lower support levels.
This phase looks like a healthy retracement within the long-term uptrend, but confirmation from upcoming weekly candles will be crucial.
BTC short TermDear Traders,
i expect to reach 119,200 it can go more up little bit but a second dump can be cooking
im publishing this idea bcz a lot of ppl lost money and most of you follow the wrong ppl
market is green yes but fully manipulated

Bitcoin’s price is at one of its most critical moments yet!👋🏻 Hey everyone! Hope you’re doing great! Welcome to SatoshiFrame channel.
✨ Today we’re diving into the 4-Hour Bitcoin analysis. Stay tuned and follow along!
👀 On the 1-hour timeframe of Bitcoin, we can observe that after failing to break above its key resistance zone, BTC moved toward the multi-timeframe lows. Losing those lows created a selling pressure, pushing the price to retest its fundamental support levels. Currently, I’ve identified two critical zones in my analysis — a breakout from either one could provide a solid trading opportunity.
⌛ Bitcoin’s volume shows a strong bias toward sell positions, to the point where buyers are barely preventing the higher timeframes from entering oversold conditions. However, if this selling pressure and volume persist, Bitcoin could break the lower boundary of its recent daily range and continue downward. Volume data gives us the best insight into market behavior, allowing us to build effective scenarios.
✍️ There are two potential scenarios for Bitcoin that I’ll briefly summarize below — both can be used as setups for positioning.
🟢 Long Scenario: If Bitcoin breaks above the resistance zone at $108,072, completes a pullback, and shows an increase in buying volume with momentum entering the market, we can open a long position. This setup looks somewhat risky, so it’s better to enter with a smaller position size. The best trigger for a long entry is located around $111,180.
🔴 Short Scenario: If Bitcoin breaks below the key support level at $105,732, it could offer a short position setup — provided that selling pressure and bearish momentum continue. After the breakdown, we’ll need to wait for a pullback before entering the trade.
❤️ Disclaimer : This analysis is purely based on my personal opinion and I only trade if the stated triggers are activated .

BTC soonDear Traders,
here the targets i expect btc to visit :) lets see if this can play
i think another wipe is coming very soon beleive or not just wait and watch
do not listen to moonboyss
be smart

Market Outlook – Don’t Let Fear Blind Your AnalysisThe market largely depends on your perspective — if you’re scared, everything will look bearish and you may assume it’s all over. But based on the chart, I don’t see a confirmed bearish reversal yet.
Look closely at the downside movements:
Each sell-off has been smaller than the previous one → indicating decreasing bearish momentum
We’ve been trading inside a red supply box, and price rejected from the middle of this zone, pulling back
Logically, that increases the expectation of a downside breakout — but when price fails to break down, it often signals that market structure may shift upward instead
Now zoom out to the daily chart:
Notice how the lower wicks are increasing — buyers stepping in aggressively on each dip
Selling volume continues to decline
Look at the last red 4H candle — it was strong but failed to continue the move down, and price immediately printed a green candle right after
If the market truly had strong bearish pressure, we would’ve seen continuation — not a quick recovery.
I’m not ignoring bearish possibilities, but you need to stay open to both sides.
If the market flips bullish from here, you must be ready to react quickly — not stuck in fear.

Does Bitcoin have symmetry in the chart Does this symmetry in the chart happen do to the halving cycle? I don't know. Right now, this is a thesis not a fact. However, if it does happen that the cycle tops, crashes at the highs, and the bottoms correspond with the prior highs? That is investable. That gives us repeatable patterns to follow in the chart.

BTC/USDT Analysis – Daily TimeframeBTC/USDT Analysis – Daily Timeframe (Updated)
Current Price: 106,500 USDT
Trend: Bearish continuation
Technical Overview
BTC has continued to decline after rejecting from the supply zone (125,000 – 127,000 USDT) marked as PMH / Weak High.
The structure shows a clear Break of Structure (BOS) and Change of Character (CHoCH) to the downside — confirming sellers remain in control.
Price is trading below both the 89 EMA (blue) and 200 EMA (yellow), which reinforces the bearish bias.
Momentum indicators (Stochastic RSI) are hovering near the oversold zone, suggesting that while a short-term rebound is possible, the overall trend remains weak.
Key Levels
Resistance: 110,900 → 112,600 USDT (PDH / PWH zone)
Immediate Support: 106,200 USDT (PWL)
Major Support: 102,500 – 100,000 USDT (Equilibrium / PML zone)
Trade Setup
Bias: Sell on retracement
Entry Zone: 109,500 – 111,000 USDT (near previous CHoCH / EMA confluence)
Stop Loss: Above 112,800 USDT
Take Profit Targets:
TP1 → 106,200 USDT
TP2 → 103,000 USDT
TP3 → 100,000 USDT
Summary
BTC/USDT remains bearish with momentum favoring sellers. The current price near 106,500 USDT is close to short-term support, so minor bounces may occur — but unless the market reclaims 112,600 USDT, the next leg down toward 100,000 USDT remains likely
