Shorter Timeframe - Bitcoin targets 118.5KBTC has been closely following WYCKOFF method ( highlighted in yellow bars).
Descending broadening wedge pattern which formed last week with the breakout above targets 118.5K to b exact which perfectly aligns with the Wyckoff lines.
Trade ideas

btcusdtToday, we hit three stop-losses so far. According to the strategy, our risk-to-reward ratio should now be 1:6. Therefore:
If the price breaks above 110,000 with a stop-loss at 109,475 and a target of 112,994, we will enter a long position.
If the price breaks below 108,314 with a stop-loss at 108,602 and a target of 106,527, we will enter a short position, maintaining a 1:6 risk-to-reward ratio.

BTC Loses Structure — Risk of Falling Below $106KBitcoin has officially lost the low-time-frame structure, confirming the end of the previous uptrend zone.
Momentum has shifted to the downside, with sellers gaining control and price now approaching a critical breakdown level.
📉 Current outlook:
BTC remains under $112K, signaling continuation of short-term weakness.
The end uptrend zone around $109K failed to hold support.
Market structure shows potential continuation below $106K if no reversal occurs soon.
📊 Observation:
Buyers have not defended the local range, and repeated rejections near $116K confirm exhaustion of bullish strength.
The next liquidity pool sits below $106K, which could act as the next target zone in this downtrend sequence.
💬 Summary:
BTC has broken its short-term structure — the chart shows clear downside risk with potential move below $106K if pressure continues.

Crypto will boom, BUT...In my view, the cryptocurrency market is poised for a significant multi-year rally.
However, such a rally cannot begin without a major transfer of capital, from weaker holders to large institutional players. This is why I believe we are likely to experience a sharp correction in the coming days or weeks, possibly extending toward the end of the year.
My outlook for this short-term downturn is driven by two key factors:
Persistent uncertainty surrounding the Federal Reserve’s next policy move, particularly whether it will proceed with an interest rate cut in December, and a bearish pattern emerging in the global money supply. After a notable recent decline, this formation suggests further contraction ahead.
The good news is that this potential market shakeout may serve as the final reset before Bitcoin establishes its bottom. Those who withstand the upcoming volatility will likely find themselves well-positioned for the next major bull run.
#bitcoin #crypto #finance #economy #market #analysis

BTCUSDT – Hawkish Fed Sends Bitcoin to Test Its 200‑Day LineBitcoin extended losses this week as Fed Chair Jerome Powell’s hawkish tone cooled expectations for another rate cut. The move left traders torn between short-term risk-off signals and long-term technical support.
The Fed’s second straight 25-basis-point cut was widely expected, but Powell’s comments hinted that the central bank may pause before easing further. That shift strengthened the dollar and Treasury yields, weighing on crypto and risk assets. Bitcoin slipped around 3% to below $108 000 before finding temporary footing.
🔹 Macro & Sentiment
Powell’s message was clear: the committee remains divided, and caution may prevail into year-end. That triggered profit-taking across risk markets. Meanwhile, Trump’s “amazing” meeting with Xi Jinping and a new trade truce added volatility, but digital assets lagged the optimism seen in equities — a sign of hesitation among crypto traders.
🔹 Chart & Levels
BTC is now testing its 200-day moving average near $110 000, a level that has defined the broader uptrend since summer. Below that, key support sits at $107 000 and $100 000. Resistance remains around $120 000–$127 000. A clean bounce from the 200-day line could restore bullish momentum, while a break beneath it would expose the lower range.
As long as $110 k holds, bias stays cautiously bullish toward $120 k+. Below $110 k, the outlook turns more corrective.
🧾 The Takeaway
Fed caution has slowed Bitcoin’s momentum but not yet reversed its trend. The next major move depends on whether the 200-day line can hold under the pressure of a stronger dollar and shifting rate expectations.
Off to you: Will Bitcoin COINBASE:BTCUSD defend its 200-day support or roll over for a deeper correction?

BTC LONG **BTCUSDT Analysis – Multi-Framework**
**Alligator (Bill Williams)**
- Lines coiled (Lips 110,647, Teeth 110,501, Jaws 110,583) → sleeping Alligator, consolidation.
- Price above all lines → slight near-term bullish bias.
- Break above 111,300–111,500 may trigger bullish phase.
**Trading Plan**
- **Bias**: Bullish above 110,500.
- **Entry**: 110,800–110,900 or break above 111,350.
- **SL**: <110,450.
- **TP**: 111,800 → 113,200 → 116,000.

BUY NOW BTCUSD!!!!!Also on btc price made a sharp rejections off the order block zone at the internal structure low with an inducement taken out am looking forward to buy from this zone holding till price reclaim back to 116k.

BTC-----Sell around 110800, target 109500 areaOctober 30th BTC Contract Technical Analysis:
On the daily chart, yesterday's close was a small bearish candle, with consecutive negative candles and the price below the moving average. The accompanying indicators show a golden cross with decreasing volume. Although the current trend leans towards a downtrend, we still need to pay attention to the continuation of the price movement and potential breakouts. The short-term trading strategy remains unchanged. On the hourly chart, yesterday's US session saw downward pressure, followed by a correction in the early morning and a continuation this morning. The current candlestick pattern shows consecutive bearish candles, and the accompanying indicators show a death cross, suggesting a high probability of continued downward movement today.
Today's BTC Short-Term Contract Trading Strategy:
Sell at the 110800 area, stop loss at the 111300 area, target 109500 area;

BTC Daily: Sellers react from 115,963The market is in a sideways range with an active seller initiative targeting 103,528.
Hey traders and investors!
This analysis is based on the Initiative Analysis (IA) method.
On the daily timeframe, the market is in a sideways range with an active seller initiative targeting 103,528.
After the rise to 115,963, we see a seller reaction accompanied by increased volume.
Look for buy setups only when the buyer shows strength — so far, that hasn’t happened.
Wishing you profitable trades!

BTCUSDT 4-Hour Chart Analysis !!BTCUSDT 4-Hour Chart Analysis
Support and Trend: BTC has bounced off the ascending trendline and is currently holding above the $110,000-$111,000 support area (represented by the gray band). The price is respecting both diagonal trendline support and horizontal support, which is a positive sign for bullish momentum.
Key Levels: Immediate resistance is at $112,000-$113,000. A clear break above this area could create room for further growth towards the next major resistance at $123,250-$124,000 (marked at the top).
Outlook: As indicated by the green arrow, the chart suggests a bullish scenario if this area holds, with the potential for upward acceleration towards the $123,000 area.
DYOR | NFA

2 key zones to watch out for!We could either fill CME gap soon & head higher to fill golden pocket or hit golden pocket levels 117.3-118K & then sweep the lows where VWAP, VAL & golden pocket of recent lows aligns at 108-109K!
This more or less aligns with wyckoff (yellow bars)

Can history repeat itself?When comparing the current Bitcoin structure to the 2021 cycle, the similarities are remarkable.
Once again, BTC slightly broke above its previous all-time high and is consolidating near the upper boundary of a long-term ascending channel — just like before the 2021 correction.
Back then, the breakout led to weeks of sideways movement, declining volume, and gradual weakness before a healthy pullback to the mid or lower band of the channel.
Now, the same setup seems to be unfolding: compressed candles, fading momentum, and potential exhaustion at the top.
If history rhymes, Bitcoin could revisit the mid-channel support before the next major expansion phase begins.

Bitcoin is making higher lows, and Above weekly 34 EMABitcoin despite continuous bad news such as whale selling, cycle end theories and bad sentiment, holding higher lows. In addition, it is above 34 weekly EMA. It will go above ATH one more time. At that time think of shorting. Now bullish. Nov, Dec Santa clause and Halloween effects are good for risk assets.

BTC Falling WedgeBTC top is in IMO falling wedge to fill the low 90s CME gap followed by a bounce for a lower high

BTCUSDT — Range $110–118k: Market Awaits TriggersTL;DR
• Price: ~$113–114k, moderate volatility.
• Background: After a peak of ~$125k in early October, the market is waiting for triggers — the Fed, geopolitics.
• ETF: IBIT (BlackRock) leads inflows.
• Sentiment: Fear & Greed = 37 (fear, but not panic).
• Polymarket: 52% probability of seeing ≥$130k in 2025.
• Microstructure (Binance): moderately bullish skew; limit orders preferred.
1. Market Context
BTC is consolidating in the $112–116k range.
The early October rally (~$125–126k) was driven by spot ETF inflows.
Currently, the market is cautiously awaiting Fed decisions and US–China news.
Fear & Greed Index = 37 (Fear) — cautious sentiment without capitulation.
2. Flows & Fundamentals
• IBIT and FBTC continue to show inflows.
• The SEC approved in-kind procedures for ETPs — structurally positive.
• A daily correction of ~−1% comes amid general cooling of risk appetite.
3. Polymarket — Collective Probability
≥$130k: ~52%
≥$150k: ~15%
≥$170k: <10%
(This represents aggregated expectations, not a forecast.)
4. Sentiment & Positioning
FGI=37 indicates a cautious buying environment — buyers on fear.
ETF inflows remain a key source of steady demand.
Base scenario: range $110–118k, with a chance to break up if macro news and ETF inflows are positive.
5. Microstructure (Binance)
• LTP: $113,459 (−1.23%)
• Spread: $0.01 (0.88 bps)
• Order-book imbalance: 1.76 in favor of buyers
• CVD: +33.7 (accumulation)
• Health: 55.9/100 (Fair)
Trade with limit orders; watch for volume spikes and tape.
6. Key Levels & Scenarios
Levels:
• Support: $112.1k, $110k, $108–109k
• Resistance: $116k, $118‑120k
• ATH zone: $125–126k
Scenarios:
• Range: $110–118k (40–60%). Trade bounces, take profit in parts.
• Bullish: Break >$120k → test $123–125k.
• Bearish: Drop <$110k → accelerate to $106–108k.
7. Risk Management
• Risk ≤1% per trade
• R:R ≥ 1:2
• Use limit orders
• Avoid entries during news
• Track Fed dates and ETF reports
8. Daily Checklist
• ETF inflows (IBIT, FBTC)
• Daily FGI dynamics
• Polymarket expectations
• CVD and imbalance 1–5m
• Macro calendar (Fed, inflation, China news)
Bottom Line
Tone: neutral-bullish.
Without new drivers the market is likely to chop.
If ETF inflows persist and the Fed remains neutral, the window for a retest of $118–125k remains open.
A negative macro backdrop → risk of moving to $108–110k.
Rational tactics: range trades, partial profit-taking, stop discipline, and tracking inflows and microstructure.
Report by Context8 Markets (Oct 29, 2025, Asia/Singapore timezone). For educational purposes, not financial advice.

BTC/USDT Analysis. The seller’s trap worked — what’s next?
Hello everyone! This is the trader-analyst from CryptoRobotics, and here’s your daily analysis.
Yesterday, Bitcoin failed to update its local high. The zone we highlighted earlier — $115,000–$115,400 (buy absorption) — worked as expected, but buyers were unable to close above it on the hourly timeframe.
After testing this zone, the market saw a sharp decline.
At the moment, a significant amount of volume has accumulated around ~$113,000, and the delta shows selling pressure. We can expect a retest of the lower support zone and will monitor the reaction. If the price bounces from $111,700–$110,000, the first resistance to watch will be around ~$113,000.
An alternative scenario suggests renewed buying from current levels. In that case, we’ll look for short entries near the updated seller zone — $114,700–$115,700 (accumulated volumes).
Buy Zones:
$111,700–$110,000 (accumulated volumes),
$108,700–$107,500 (volume zone),
$105,600–$104,500 (volume anomalies),
$97,000–$93,000 (volume zone).
Sell Zones:
$114,700–$115,700 (accumulated volumes),
$120,900–$124,000 (volume zone).
This publication is not financial advice.

Decoded Analysis of BTCBTC is currently in its second last quarterly pattern. The pattern is intact, but it needs to be broken for a proper multi year bull run to happen. These patterns are normally not defected easily, and most people are not even aware of their existence.
A correction is needed, which normally ranges between 45 to 60 percent. Two major supports are noted for this correction:
1. $62,680
2. $48,000
There are several skipped supports below BTC, which I am not mentioning at the moment.
For example, BTC has a $7 skipped quarterly support, with several more above.
This message is for educational purposes only.
Always DYOR.
Note: Tradingview doesn't allow me to share my technical analysis chart.

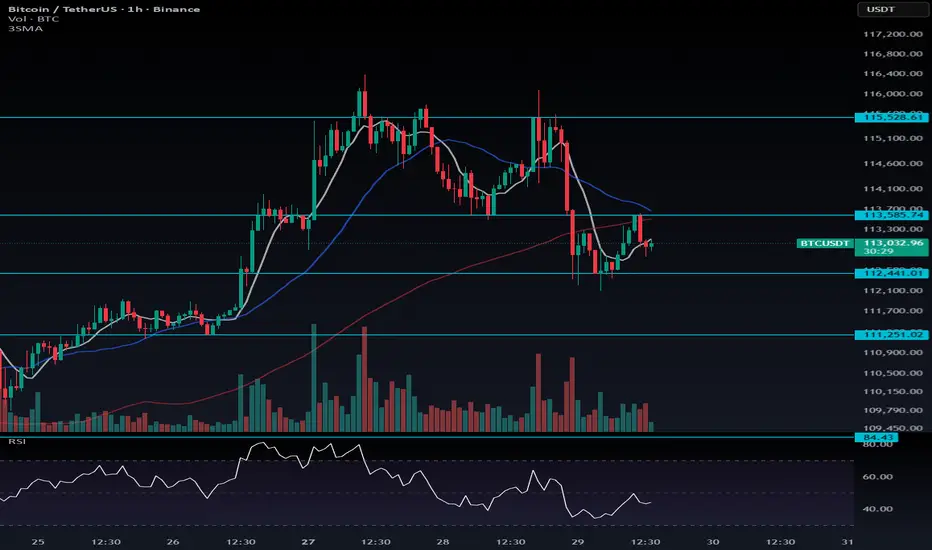
High Volatility Expected — FOMC Rate Decision IncomingToday’s market volatility could increase significantly due to the interest rate announcement and the following press conference.
My view: it’s worth taking a position today, but with limited risk exposure. The probability of getting stopped out is high — accept that risk and trade with caution.
📈 Long Setup:
Entry Trigger: Break above $113,585
Stop-Loss: Wide stop — keep your position size small to manage risk
If price fake-breaks below $112,441 and reverses upward, that’s another strong long signal
📉 Short Setup:
Same logic applies in reverse: if $113,585 fails and $112,441 breaks cleanly downward, you can look for a short opportunity
⚖️ Pro Tip:
If you know how to use hedge mode, this is a good time to apply it to balance risk on both sides.
BTC-USDTIn the new update, Bitcoin can go through one of these two bullish scenarios 🚀🚀
➖Or a move from these prices to 120
➖Or a correction or 111 and then a rise to 120 thousand dollars

BTC LONG FOLLOWING WEEKLY OUTLOOK POSTED ON SUNDAY Bitcoin is coiling at a key equilibrium zone, and the Bill Williams Alligator is tightly compressed, indicating a sleeping market poised for a directional awakening. The structure supports a long bias, anticipating an upside breakout to target buy-side liquidity above the range.
ICT & SMC Perspective (Bullish Focus):
Liquidity Sweep: The recent low at ~113,111 swept the swing low and the Alligator's Jaw, collecting sell-side liquidity.
Defended Level: The subsequent bounce shows this level is being defended, forming a potential higher low.
Break of Structure (BoS): A move above the recent internal high at ~113,243 would confirm a bullish shift in market structure.
Bullish Trigger: The key signal is a break and hold above the Alligator's Lips (~113,193.7), which would signal the Alligator is waking up bullish.
Trade Plan - Long on Awakening:
We are waiting for the Alligator to "open its mouth" to the upside.
🟩 Entry Zone: On a sustained 30-min close above 113,194 (Lips), with an additional confirmation on a break of 113,243.
🔴 Stop Loss: 112,000 (below the Jaw and the recent liquidity sweep low).
🎯 Take Profit 1: 113,600 (Previous resistance & initial liquidity).
🎯 Take Profit 2: 114,000 -115000 (Higher timeframe liquidity pool).
🎯 Take Profit 3: 120,000 (Higher timeframe liquidity pool).
Conclusion:
The setup is prepped for a bullish move. The compressed Alligator shows a period of accumulation. A break above the Lips is our signal that buyers are taking control and the next impulsive leg up is beginning.

BTCUSDT Review October 29 2025Short-term price movement ideas.
The price reached the weekly zone of interest and, within it, performed a daily liquidity sweep, which triggered a bearish move. After the daily sweep, we received confirmations on the 4H timeframe, and now the nearest zone to watch is the 4H Break to Structure (BtS). If this zone gets tested and confirmed on a lower timeframe, we can then consider opening a short position targeting a new low.
Be flexible, adapt to the market, and the results will come quickly. Good luck to everyone.

BUY NOW BTCUSD!!!!!!BTCUSD completed +1600pips on our yesterdays calls on buy today we have the price at the fvg zone with a price rejection after the inducement liquidity zone am in on buy again to 116k
JOIN AND ENJOY......

BTCUSDT.P - October 28, 2025Quick BTC Trade: 15-Minute Timeframe
This chart outlines a short-term long setup after a significant price drop, suggesting a potential scalp or day trade based on a targeted nearest support zone.
