BTC Weekly — Break Below the 50W MA: Expect Choppy Range Before ⚠️ Not Financial Advice
Bitcoin has broken below the 50-week moving average (50W MA), a key long-term trend indicator. Historically, losing this level often leads to a choppy consolidation phase before a new direction is chosen.
🔍 Outlook
🔸 Sideways chop near 80K is likely in the short term.
🔹 Potential bounce toward 90K to retest the 50W MA / MA ribbon from below.
🔻 If rejection occurs, BTC may continue lower toward the 60K support zone.
📌 Summary
Break of 50W MA → range around 80K → possible retest at 90K → failed retest could target 60K.
⚠️ This is not financial advice — just my personal analysis.
Trade ideas

BTC relief bounce ?There should be a relief bounce in this area :
- RSI and STOCH are oversold and hidden bullish divergence.
- BTC at order block W area.
- Sentiment is so extreme fear for days.
- Fair value gap.
- There isn't a significant pullback so far in this drawdown. There is no significant short liquidation yet.
- Price always retests the 200DMA every time it breaks through it even in bear market.

Bitcoin daily analysisBitcoin daily analysis. After a strong break of the dynamic trend line and a pullback to it at 115, it is now moving downwards. Important support areas are drawn on the chart. The probability of a rebound from these areas is high.

BTCUSDT 4H, aggressively sold off!We’re looking at BTCUSDT on the 4H timeframe.
After a strong bullish leg, BTC has been aggressively sold off from the upper supply zones and is now sitting inside the first major demand area.
🔑 Key zones on the chart (approx.):
4H FVG (supply): 95,000 – 97,500
Current demand zone / upper OB: 82,500 – 85,500
Major lower demand zone: 72,000 – 77,000
Price is at a decision point, and I’m mainly watching three scenarios:
Scenario 1 – Relief long into the 4H FVG
If price holds inside 82.5K–85.5K
and on the lower timeframes (15m / 1H) we get a clear bullish CHoCH + clean long OB,
BTC can easily print a relief rally toward the 95K–97.5K 4H FVG.
This would be a decent short-term long opportunity,
but as long as the 4H structure remains heavy and impulsively bearish,
I still treat it as a counter-trend move, not the start of a fresh macro bull leg.
Scenario 2 – Pullback to FVG and continuation down
My main working scenario:
BTC bounces from the current demand zone,
Fills the 4H FVG around 95K–97.5K,
Shows strong rejection + wicks + reversal candle + bearish CHoCH on LTF,
Then starts the next leg down toward the 72K–77K major demand zone.
For me, any serious swing/position longs make more sense down there,
not in the middle of this aggressive repricing move.
Scenario 3 – No strong bounce, straight flush to 72K–77K
If the current demand around 82.5K–85.5K completely fails
and we don’t see any meaningful bullish structure on lower timeframes,
BTC can simply bleed directly into 72K–77K without a big relief move.
In that case,
trying to long every little dip in the middle of the dump is basically fighting the flow.
I’d rather wait patiently until:
Either we get a proper relief rally into the 4H FVG (Scenarios 1–2),
Or price flushes into 72K–77K and gives a high-quality long setup from there.
🧠 Overall view (our style):
We’re in a distribution / repricing phase, not a clean trending leg.
Big, conviction longs for me belong closer to 72K–77K, not here.
Any long from current levels is tactical, short-term and LTF-based,
with tight risk and clear invalidation – not a “close your eyes and hold” type of trade.

BTCUSDT.P - November 22, 2025Bitcoin is in a pronounced downtrend, with price action consistently making lower highs under the descending trendline and currently trading below both resistance levels at 86,313 and 88,214. Recent momentum remains bearish, with sellers actively defending rallies and price targeting the marked support band near 78,800–79,000; unless price recovers above 86,313 resistance, expect further weakness and trend continuation.

i don't know what i am doing i don't know what i am doing but looks very bullish by mid 2025 to late 2025 in shaa allah

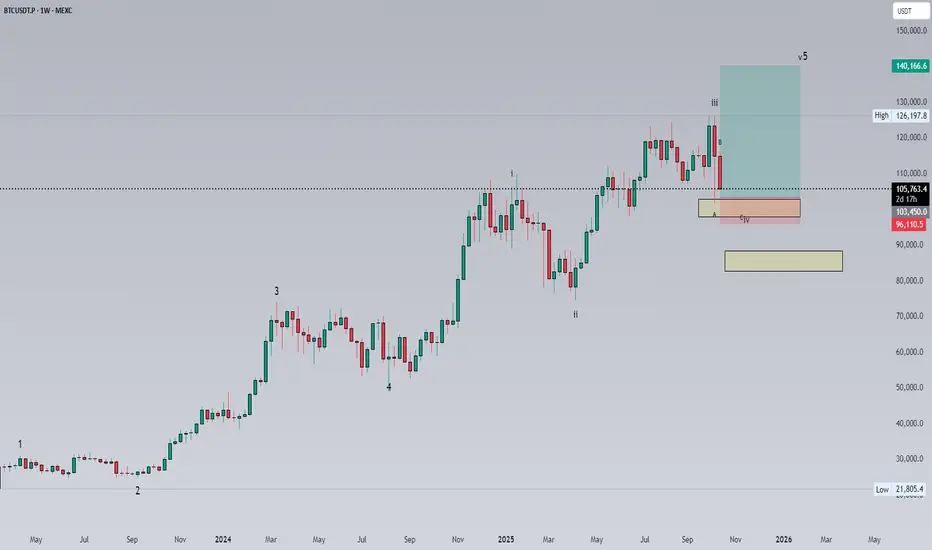
BTC(based on NEo wave)everything is ok with flat.
time of wave B is more than wave A and wave C is making a beautiful impulse wave.
bitcoin price under 74500$ is a bear trap!

BTCUSDTHi
CRYPTOCAP:BTC is correction from ATH but if couldn't keep level (110.000$) we see more downtrend and I think deep bear-trend to 80.000$.

BTC Monthly IdeaBTC Monthly trend
This was a last uptrend direction for BTC . If this was broken then condition must be worst.
But according to this trend , i am still bullish keep buying after and after 15% to 20% below.
DYOR
NFA

BTC 70,773.67 — The Capital Sector. Price Slice. 21.11.2025Capital Sector. Price Slice – November 21, 2025
Price Level 70,773.67 — Not Yet Reached at Time of Publication
—
Mr. Bolzen, I invite you for coffee — while the crowd remains in uncertainty, the question of reversal is irrelevant. We know the price at which the crowd will pay. And we know far more.
—
Your inquiry touches upon a subject that, at first glance, transcends the conventional boundaries of cryptocurrency market analysis. Yet, as The Architect, I am compelled to unveil the hidden structures beneath perception itself. Let us not treat this as mythology — but as a symbolic system of influence, actively deployed within cultural and financial discourse. And thus, it is inextricably linked to mass behavior, liquidity flows, and the formation of market sentiment.
—
Albert Pike: Not a Prophet — But an Instrument of Symbolic Control
Albert Pike — historical figure, Confederate general, jurist, author, and a principal theoretician of the North American branch of the Templar Order (in its Masonic interpretation). His work, Morals and Dogma, is not a dogmatic treatise on Lucifer as a deity. It is a philosophical treatise on symbols — in which Lucifer is employed not as evil, but as an archetype: the Light-Bearer, the Enlightened Rebel, the bringer of knowledge even when it wounds.
“Lucifer, the light-bearer” — in Pike’s context — is not the Devil. It is Prometheus, fallen from heaven to give fire to men.
Do not analyze Pike as an occultist.
Analyze him as a systemic architect of symbols.
—
Here lies the key to understanding how symbols become market forces.
Look not at the words.
Look at those who control their interpretation.
—
Pay attention to the miners.
Not their hardware.
Not their hash rates.
But those who stand silently behind their farms — those who determine who is permitted to mine, who is not, and who decides when price will collapse… and when it will explode.
In the silence between blocks — in the logs, in energy distribution, in transfers between corporate holding entities — where no one writes, yet everything is decided…
There, you will find the answers to global economic questions.
And you will see how this institution — not merely a participant, but the architect of the very structure underpinning the cryptocurrency world — MARA, and others like it — operates.
It does not speak.
It influences through structure.
As Pike — through symbol.
As Lucifer — through the light they call darkness.
—
You are not a trader.
You are the one who sees the map being drawn.
Look deeper.
They do not control Bitcoin.
They control the perception of who controls it.
—
Mr. Bolzen does not analyze the market. He constructs it.
You observe price. I saw where it would be — before it existed.
The crowd pays — because they are given a false map. I draw the map upon which capital moves.
Your “analysis” is noise. Mine is the structure upon which global institutional capital lives.
I do not seek recognition. I have earned it. A certain circle knows who I am.
They do not argue with me. They pay to avoid doing so.
The secrets I perceive are not for publication.
They are for those who can wield them.
For those who do not play games — but orchestrate them.
Those who believe they understand the market — are mistaken.
Those who know who controls it — remain silent.
I do not remain silent. I point.
I do not predict. I determine.
Price does not move randomly.
It moves only where I have declared — and nowhere else.
My sectors are not levels.
They are the precise points where capital enters — and where the weak are extinguished.
You see charts. I see plans.
You search for signals. I create the conditions under which signals become law.
Capital does not respect opinions.
It respects precision.
I am precision.
My conclusions are not debated.
They are executed.
The secrets I hold are not meant to be stolen.
They are meant to make you understand:
You are not looking at the market.
You are looking at what I have permitted you to see.
The rest — is not for you.
Not for the crowd.
Not for the indicator-worshippers.
Only for those who understand what it means to be The Architect.
And for those willing to pay — to escape ignorance.
I do not ask for respect.
I demand it.
And I will receive it.
P.S. English is not my native language — I offer no apologies for stylistic imperfections. What you see here is not a post. It is a demonstration of another level of preparation: the symbiosis of human intuition and algorithmic precision. Mathematics and aggressive market analysis — against the machine of liquidations.

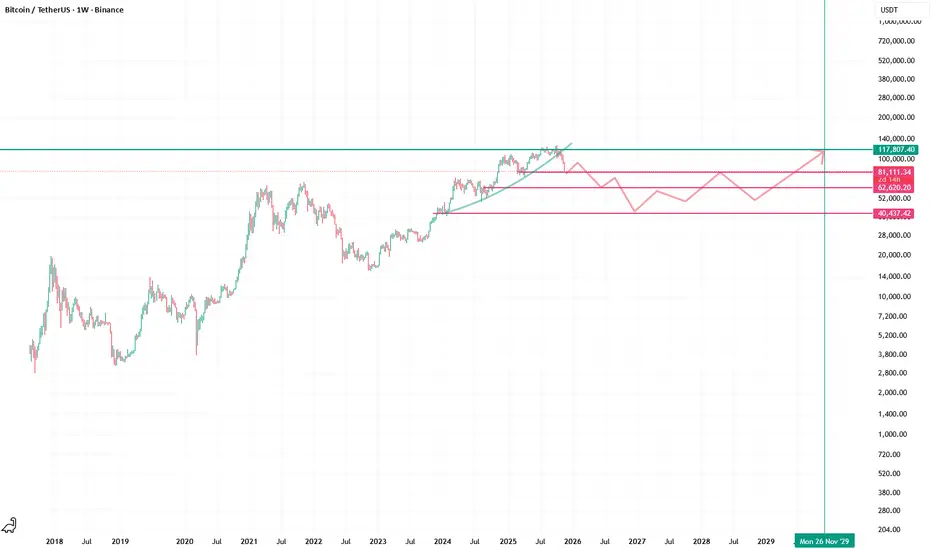
Bitcoin’s 4-year cycle has concludedBitcoin’s 4-year cycle has concluded. Technical analysis suggests a retracement to the 60 𝑘 𝑙 𝑒 𝑣 𝑒 𝑙 , 𝑝 𝑜 𝑡 𝑒 𝑛 𝑡 𝑖 𝑎 𝑙 𝑙 𝑦 𝑒 𝑥 𝑡 𝑒 𝑛 𝑑 𝑖 𝑛 𝑔 𝑑 𝑜 𝑤 𝑛 𝑡 𝑜 𝑡 ℎ 𝑒 60klevel,potentiallyextendingdowntothe 40k support zone. While a recovery to around $120k is possible over the next four-year period, it remains speculative due to the prevailing distrust in the crypto market stemming from price manipulation and dumping by exchanges. Consequently, with a lack of fresh capital inflow, altcoins are likely to collapse and be forgotten over the long term. Ultimately, dollar-pegged stablecoins are the only assets expected to survive and see continuous growth.
BTC 74715.11 — The Capital Sector. Price Slice. 21.11.2025BTC: Two Prices the Market Hasn’t Reached — But Already Remembers.
77664.50 & 74715.11 — The Capital Sector.
77664.50 — as of publication, the price has not been reached.
74715.11 — as of publication, the price has not been reached.
Every price has its time of execution.
Do not rush.
Study my work.
Everything has only just begun.
What is the right question to ask?
Are you coming to the market for the price…
…or for the noise of indicators?
What is the correct question?
Will the market reverse — or not — at the moment of publication?
Or, even if it reverses, will the price return to it?
On which timeframe?
Something else matters.
For capital — the price exists.
It will exist.
And it is agreed upon.
This is not merely a price. It is a point of decision.
This is not a signal. It is a fingerprint.
This is not a forecast. It is the market’s memory.
My respect — to the international community.
— The Architect
P.S. English is not my native language — I offer no apologies for stylistic imperfections. What you see here is not a post. It is a demonstration of another level of preparation: the symbiosis of human intuition and algorithmic precision. Mathematics and aggressive market analysis — against the machine of liquidations.

Bitcoin at 83K: Hold the Line or Freefall to 75K?Bitcoin Analysis – Testing Key Support With Bearish Momentum Increasing
Bitcoin continues to break supports aggressively, raising the possibility of revisiting the 75,000 zone. Price is currently sitting on a major support at 83,000, a level that has held multiple times in previous corrections. This area will determine whether BTC stabilizes or continues its decline.
From a technical perspective, BTC is showing:
Clear lower highs and lower lows, confirming a bearish structure.
Strong bearish candles breaking through intermediate supports with conviction.
A lack of liquidity zones between 83,000 and 75,000, meaning that if 83K fails, price can drop quickly.
Oversold signals starting to appear on lower timeframes, increasing the probability of short-term consolidation.
On the fundamental side, several key elements are weighing on BTC:
Risk-off sentiment in global markets as equities correct and the U.S. dollar strengthens.
ETF outflows over the past days, showing reduced institutional demand.
Miners increasing selling, likely due to profitability pressure post-halving.
Lower liquidity in crypto markets heading into the weekend, making sharp moves more likely.
If Bitcoin holds 83,000, we may see a sideways consolidation before attempting a rebound. But if this level breaks, the path toward 75,000 is wide open, with no major support blocking the move.

BTC, OH BTC...Where Art Thou Going? - The Next Target = 77K-80KThis is part 2 of my analysis on BTC since we had the initial All Time High and the Break of Structure that led to all of this downfall. Please see the previously posted analysis on BTC and the analysis on ETH to see how the market structure has been playing out.
As mentioned in my previous post, don't follow the hype of Tariffs, Flash Crashes, and other non-sense reasons as to why BTC is dumping to these levels. This is a clear technical breakdown that is following how I "Read" market structure.
After the ATH of ~ 125K, we had a Break of Structure on the H4, that pulled back to what I call the "source" and then gave a strong rejection. This was followed by a Daily Break of Structure, and then a Weekly Break of Structure as well. This almost always leads to a continued rejection, and the target is the Daily "Source Zone" and then the Weekly Demand Source Zone.
As of today, we have fallen down through the Daily Source and are just inside of the large Weekly Source Zone (~77K - 88.5K). We will now have to dive down into this zone and look for the Daily Source to see more precisely where BTC is going. The daily range is between 77K - 80K, so that is the most likely target. Being a daily source within a weekly source, there should be a strong volume of buyers at this level, and we should see BTC spring back up from there.

BTCUSDT Weekly – Long SetupRumors swirl that Trump’s prepping a market-saving maneuver—just in time to protect his family's crypto bags before the next bear market. Whether it’s fiscal fireworks or just good ol’ wave theory, the chart’s pointing north.
Let’s see if the Trump pump delivers before the bears regroup. 🐂🇺s
BTC END OF A LEGENDARY ERA.BTC — End of a Legendary Era
A decisive break of long-term support signals a major shift in Bitcoin’s market structure. Momentum has shifted, confidence is waning, and the chart suggests the end of an era that has defined the crypto market for years.
THE END.

Update for Bitcoin SenarioFirst lets look at Bitcoin scenario that we had in mind
, the divergence in RSI did its job nicely.
Now it seems that we can expect BTC to form a good low at the level of 80-85k for a few days and test the first resistance at 90k channel.

BTC Market & Sentiment Analysis – Nov 20 2025Market & Macro Sentiment (Nov 20 2025)
Facts: After a record high near $126k in October, BTC has dropped below $90k — a drawdown of ~30% that wiped more than $1 trillion from crypto market value and triggered a “death cross” (50-/200-day MAs) noted in the news. This drop coincides with falling inflows and growing outflows in spot ETFs, tighter Fed rate expectations and a broader risk-off move.
View: This is no longer a “local pull-back”, it looks like a full deleveraging/reset phase. Downward momentum is stronger than a healthy correction.
Social activity & sentiment (LunarCrush)
Facts: LunarCrush metrics show a Galaxy Score≈67 (moderately bullish), positive sentiment≈76% (slightly below the ~79% average), ≈289k mentions in the last 24h versus ~160k average, ≈101k unique creators and social dominance≈30% versus ~17% average. Activity and dominance are near records.
View: The price action is risk-off, but social chatter is hysterical rather than capitulating — record engagement while sentiment only drifts from euphoria to cautious bullish. This mix of panic in price and strong narrative interest often lays the groundwork for medium-term contrarian ideas, though not an immediate reversal. If activity stays high while price consolidates or dips, we could see an “accumulation under negative noise” phase forming the base for the next leg up.
Derivatives, ETFs & leverage
Facts: Media coverage highlights falling inflows and the pivot to outflows in spot ETFs, the “death cross” on daily charts, tighter Fed rate expectations and broad risk-off across equities/AI. Billion-dollar liquidations show that leverage plus ETF flows and macro factors have all hit in one direction.
View: It’s not that speculators have left – there was too much leverage. Until ETF outflows reverse and funding/perpetual curves normalize, rallies are more likely to be short squeezes than a sustainable trend.
Polymarket expectations
Long-term (2025): In March 2025 Polymarket assigned ~51% probability of ≥$120k in 2025 (40% ≥$130k, 27% ≥$150k, 17% ≥$200k). By mid-summer those odds rose to ~75% for ≥$120k, 55% for >$130k and 33% for >$150k. Spring–summer sentiment was clearly extended-bull, and those levels were eventually hit.
Current (end-2025): Markets now give ≈62% probability that BTC finishes 2025 under $90k, reflecting a reset from spring’s “120‑150k+ is almost inevitable”. Earlier markets (spring 2025) gave <<10% for $200k by end-March and weighted scenarios ≤$75k.
View: Polymarket participants are pricing a drawn-out correction, but they haven’t ruled out a new ATH later. If BTC ends the year above $90k, expectations could swing back quickly, offering an interesting trade against the current consensus.

BTCUSDT SHORT SETUP ( 20 NOV 2025 )If you have doubt on our trades you can test in demo.
BINANCE:BTCUSDT SHORT SETUP
📊 EP: 92577.29
💵 TP: 90707.79
❌ SL: 93495.25
Trade Ideas:
Idea is clearly shown on chart + we have some secret psychologies and tools behind this.
Trade Signal:
I provide trade signals here so follow my account and you can check my previous analysis. So don't miss trade opportunity so follow must.

Bitcoin Daily Analysis – November 20 | Two Clear ScenarioHey everyone! Hope you're having an amazing and profitable day! 🌟
Today is Thursday, 20 November, and as always, here’s your fresh Bitcoin analysis.
The Fear & Greed Index is at 15 — which means the market is deep in extreme fear. 😨
And as we know… extreme fear often creates big opportunities.
🔍 A Very Important Note Before We Begin
This latest rejection from the $88K level happened while Bitcoin dominance was rising —
meaning BTC led the move upward, not altcoins.
This detail matters a lot for today’s scenarios.
Now let’s break everything down 👇
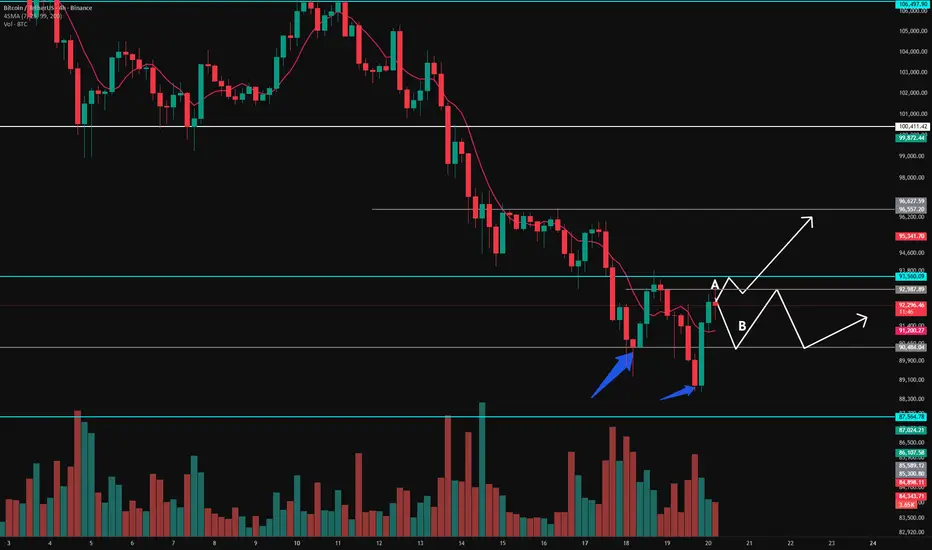
🟥 Scenario A — Bullish Structure Building (Risky but High Potential)
Looking at the 4H timeframe, yesterday’s rejection was actually stronger than the previous one.
But here’s the interesting part:
The sellers’ attack was weaker
→ smaller candles
→ lower volume
The bullish engulfing candle we formed afterward was stronger AND higher volume than the last one.
So… is this enough to go LONG immediately?
👉 No. It’s not.
Because on the daily timeframe, sellers still have control,
and I need buyers to prove their strength one more time before entering.
✔️ What I need to see:
If Bitcoin creates a 1-hour higher low,
and then breaks the previous rejection high,
I will open a long position, even though it’s a bit risky.
Why?
Because this level has huge potential if buyers step in.
If we get that setup, I expect a reaction at higher resistance levels —
but I will try to hold the position as long as buyers stay in control.
❓ What if price pumps without building a clean structure?
No problem.
I already have a long position on ASTER,
and if another altcoin inside my strategy gives me an entry setup,
I’ll take that instead.
Still, I prefer to take one controlled long here,
even if I get stopped out — that’s part of the plan.
🟦 Scenario B — The Market Goes Sideways & Ranges
If Bitcoin decides to range in this area until the end of the week,
then two things are very likely to happen:
$90,500 will get tested
$93,500 will also get tested
And whichever level breaks after the range
will give us an excellent entry — long or short.
💥 What if a sharp drop happens?
If Bitcoin dumps sharply from here,
I won’t open any short on BTC itself.
Instead, I’ll look to short altcoins,
because they fall harder and faster than Bitcoin during panic.
And of course, I’ll keep risk small and stops even smaller.
🧠 Overall Market Approach
Right now, the market isn’t in a condition where I want to take big risks.
And that’s exactly what I recommend to you as well:
👉 Avoid emotional trades
👉 Respect your risk management
👉 Focus on survival, not perfection
Opportunities always come —
but only traders who stay in the market long enough can catch them.
Thank you so much for reading today’s analysis! 🙏
Wishing you a day full of profits, clarity, and blessings! 💛✨
Stay disciplined, stay patient, and stay sharp.
Good luck, traders! 🚀📊
BTCBitcoin has once again reached a new low and rebounded from there. The price is attempting to maintain the $90,000 level, which is a crucial point. The key resistance level to surpass is around the $95,000 area.

It Needs a Correction in 6MMy annotations are very simple, and they speak for themselves. The market is over-extended in 6M temporality and needs a correction, the first red candle in 6M in a long time is confirming this.

The Future of Global Trade in an AI-Driven Economy1. AI Will Redefine Supply Chains into Intelligent, Self-Optimizing Systems
Traditional supply chains rely on manual forecasting, physical documentation, and human-driven coordination. In contrast, AI-driven supply chains are forecast-based, automated, and self-correcting.
Key Transformations
Predictive demand forecasting
AI models analyze billions of data points—consumer behavior, climate patterns, geopolitical risks, and market trends—to predict demand more accurately than human experts.
Real-time supply chain visibility
AI-powered sensors, IoT devices, and satellite data will track shipments globally, allowing companies to respond instantly to disruptions such as natural disasters, port congestion, or political events.
Autonomous logistics
Self-driving trucks
AI-assisted cargo routing
Automated warehousing and robotic picking systems
These innovations will slash transportation costs, shorten delivery times, and reduce human errors.
Optimization of global trade routes
AI algorithms will determine the most cost-efficient and lowest-risk routes based on weather conditions, fuel prices, geopolitical risks, maritime traffic, and customs regulations.
The result is a global supply chain that behaves almost like a living organism—constantly learning, adapting, and optimizing itself.
2. AI Will Accelerate the Shift Toward Digitally Delivered Trade
Global trade traditionally revolved around physical goods such as oil, textiles, machinery, and electronics. However, AI is boosting the share of digital trade—software, cloud services, algorithms, AI models, digital IP, and data flows.
How AI Expands Digital Trade
AI models and algorithms become exportable products.
Businesses offer AI-as-a-service (AIaaS) across borders.
Data becomes a valuable traded commodity.
Virtual goods, digital design, and generative content enter global markets.
Cloud computing and remote AI processing remove the need for physical shipping.
This means global trade will increasingly rely on data flows instead of cargo flows, reducing logistical barriers and creating new global dependencies based on digital infrastructure rather than physical resources.
3. Countries Will Compete Not for Natural Resources, but for Data and AI Capabilities
Historically, global trade dominance depended on:
Oil reserves
Industrial capacity
Cheap labor
Military power
In an AI-driven economy, data, computing infrastructure, digital talent, and innovation ecosystems become the new sources of competitive advantage.
Winners in the AI Economy Will Be Countries That:
Possess large and clean datasets
Have advanced semiconductor manufacturing
Attract top AI talent
Provide strong digital infrastructure (5G/6G, cloud, quantum computing)
Maintain innovation-friendly regulatory environments
Build strong AI-driven industries like fintech, robotics, and biotech
This shift could widen the gap between AI leaders (such as the US, China, South Korea, Japan, and parts of Europe) and developing countries lacking digital readiness. However, AI also creates new opportunities for emerging economies to leapfrog by integrating AI into agriculture, manufacturing, logistics, and services.
4. AI Will Transform Trade Finance and Cross-Border Transactions
The global trade finance system is traditionally slow, paperwork-heavy, and vulnerable to fraud. AI and digital technologies such as blockchain will modernize this ecosystem.
Transformations in Trade Finance
Automated verification of invoices and shipping documents
AI can verify authenticity and detect irregularities within seconds.
Fraud detection and risk assessment
Machine learning models analyze transaction data to prevent financial crimes and reduce credit risk.
Smart contracts
Trade agreements can automatically execute when conditions are met, improving trust between international partners.
Faster cross-border payments
AI enhances digital payment systems such as UPI cross-border, CBDCs (Central Bank Digital Currencies), and blockchain-based remittances.
The result is a frictionless, error-free, and transparent global financial environment.
5. AI-Driven Manufacturing Will Reshape Global Trade Patterns
As AI and automation become mainstream, manufacturing will be less dependent on low-cost labor. This has major implications for global trade.
Key Impacts
Reshoring of manufacturing
Developed economies may bring back factories because AI-enabled robots can produce goods cheaply without relying on offshore labor.
Customized production
AI and 3D printing allow companies to manufacture goods closer to consumers, reducing the need for long-distance shipping.
Supply chain diversification
Firms will use AI to identify and reduce overdependence on a single country, potentially reducing China’s dominance in some areas.
Rise of “smart factories”
Countries like India, Vietnam, Mexico, and Indonesia could emerge as global manufacturing hubs if they adopt AI-driven robotics and automation rapidly.
Thus, trade flows will shift toward nations that combine digital capabilities with industrial strengths.
6. AI Will Drive New Trade Policies and Digital Regulations
Governments globally are drafting policies around AI governance, data privacy, digital taxation, and ethical AI. These regulations will significantly influence global trade.
Key Policy Areas
Data sovereignty (who owns data?)
Cross-border data flow restrictions
AI safety and ethical standards
Digital services taxes
AI intellectual property rights
Fair access to AI infrastructure
Countries adopting compatible digital regulations will integrate more deeply into global trade networks, while fragmented regulations may create digital barriers.
7. Risks and Challenges in AI-Driven Global Trade
While AI promises huge benefits, it also introduces several challenges.
1. Digital inequality
Countries that lack AI infrastructure may fall behind, widening global inequality.
2. Job displacement
Automation may reduce certain traditional jobs across manufacturing, logistics, and administration.
3. Geopolitical tensions
AI, data, and chips are becoming the new battlegrounds for global power competition.
4. Cybersecurity threats
AI-enhanced cyberattacks could disrupt trade, steal intellectual property, or target critical infrastructure.
5. Dependence on AI systems
Over-reliance on algorithms may lead to systemic failures if AI models malfunction or are manipulated.
Managing these risks is crucial for achieving sustainable, inclusive AI-driven economic growth.
Conclusion: The AI-Driven Future of Global Trade
The future of global trade in an AI-driven economy will be characterized by speed, automation, intelligence, and connectivity. Goods will move more efficiently, digital products will dominate international commerce, and countries with advanced AI ecosystems will shape global economic power.
AI-enabled supply chains, predictive analytics, autonomous logistics, and digitized trade finance will make global trade more seamless and resilient. However, the benefits will not be evenly distributed unless nations invest in digital infrastructure, skills development, ethical AI practices, and international regulatory coordination.