Bitcoin: Areas of interest (supports and resistances,short term)Here you have some boxes that show support and resistance areas where you can buy and sell
Trade ideas

BTC Bearish Scenario This idea is comes from a place purely of pattern recognition, I believe BTC still has more to give this cycle but I have noticed similarities between the "Trump pump" top and the most recent top/ price action:
Both tops feature a wick into the diagonal resistance, followed by a slightly larger wick making a new high before selling off.
After the highs in January BTC sold off back towards the trend support level, could BTC follow this pattern this time around too? So far they are tracking very closely, the beginning of November would be the bottom at trend channel support if this was to play out.
For me $108,000 is the key S/R level in this idea, a break below it would definitely open Bitcoin to the possibility, all the time price stays above it does look significantly stronger.

BTC Flow Update – Sliding Toward the Next Big Reef🌊 BTC Flow Update – Sliding Toward the Next Big Reef 🏄♂️
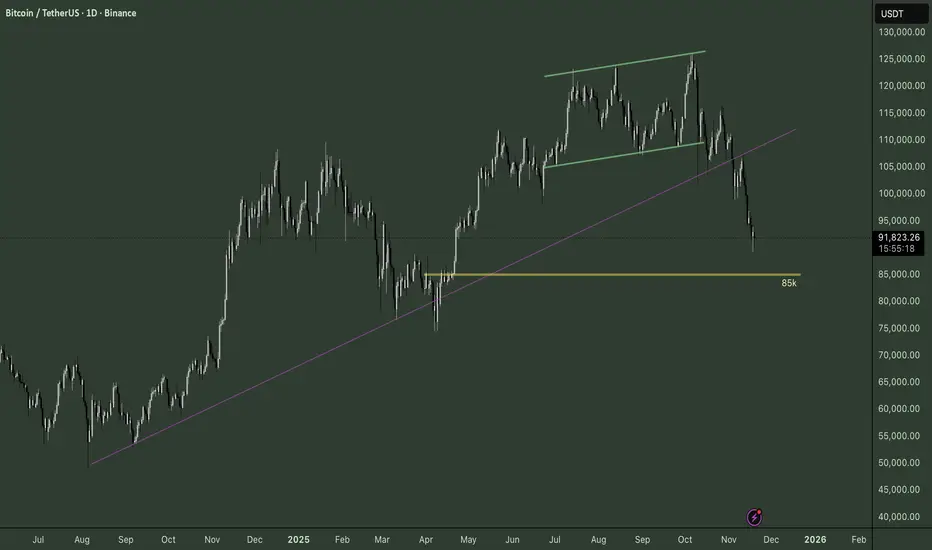
Rough waters out here, fam 🌊. BTC slipped right off that upper channel like a board losing grip on a fading wave, and once price cracked that purple trendline, the whole vibe shifted. No chaos, no messy chop — just a clean, controlled slide down the face of the move with barely a bounce in sight. Pure flow.
Right now the chart feels like it’s gliding toward that 85K zone — the next real reef under us. It’s got history, it’s got memory, and it’s the kind of level where price usually stops to breathe ⚓️. Above it? Open water.
No mid-range structure, no heavy footing — just a steady downhill drift through empty territory. These are the moves where charts move smooth but traders get shaken if they try to force direction.
Not calling shots here, not fighting the tide. Just reading the waves, watching how BTC approaches that 85K shelf, and letting the market tell its story 🌬️. It’s wild how calm everything feels once you stop forcing trades and start flowing with the rhythm of the trend.
💬 What do you think about this scenario? Only share your idea if you’ve got another opinion — otherwise just hit that button 👍
Thank God, another opportunity to buy Bitcoin is emerging...Bitcoin has clearly entered a downward and corrective phase. It is better to wait for short opportunities. Protect your money from time or price corrections. Thank God, another opportunity to buy Bitcoin is emerging. But now is definitely not the time to buy.

Bitcoin Analysis – November 19 | Two Main Scenarios Ahead
Hello everyone! Hope you're having a great day! ☀️
Today is 19 November, and Bitcoin is currently trading around the $90,000 zone.
The Fear & Greed Index is sitting at 16, which signals extreme fear in the market. 😨📉
For today, we have two major scenarios:
🟥 Scenario A – Bearish Continuation
Price could drop toward $87,000 after breaking below $90,500.
However, since my breakdown timeframe is the 1-hour, this setup does NOT give me a proper stop-loss.
Why?
No valid 1H swing high has formed to place a stop behind
The previous high is too far
R/R (Risk-to-Reward) would not reach 2R
So I am skipping this trade unless the market builds a new structure with a tighter stop-loss.
I’d rather miss a 2% move than take a poor-quality setup.
But…
👉 If your strategy gives you a valid small-stop trigger,
and the 4H candle closes below 90,500,
then price can fall to $87K.
🟩 Scenario B – Bullish Reaction
If price fails to close a 4H candle below $90,500,
I will take a long position only if the 1H candle closes above $93,500.
Since price hasn’t reached that level yet, it doesn’t make sense to give you an entry setup right now —
because Bitcoin may form a higher low above $90,500,
which would allow for a smaller stop-loss and faster R/R achievement.
So I’ll wait for confirmation.
🔔 Summary
Both levels — $90,500 and $93,500 — can provide trading opportunities when broken.
But I strongly recommend watching Bitcoin Dominance (BTC.D) during the breakout:
If BTC price and dominance move in opposite directions,
→ you can consider altcoins for entries
Otherwise, Bitcoin remains the safest and most logical option
⚠️ Important Notes
Always remember:
🧠 Risk management is the key to long-term profitability.
You’re not supposed to become profitable from a single trade —
You become profitable by staying in the market long enough, managing your capital,
and letting consistency build your edge.
I’d love to hear your thoughts in the comments! 💬
Wishing you a successful and profitable day! 🚀📊

BTCBitcoin bounced back after reaching a low, but this turned out to be a dead cat bounce. The price is now heading toward the $90,000 area, and we'll see if it can hold this level. The market remains bearish, and there are still no signs of strength.

BTC Sector 100150.0 — The Gates That Have Not Yet Opened🏷 BTC
🏷 19.11.2025
🏷 Capital Sector. Price Slice. System of Intelligent Anticipation. Capital Mapping — before instrument touch, this price slice is the planned action of major players.
🏷 Sector 100150.0 — The Gates That Have Not Yet Opened
🏷 The price has not touched the level — yet the market already stands at the threshold.
This is not resistance.
This is a sealed trajectory.
Those who see only candles — hear no whisper of liquidity.
Those who wait for signals — feel no pull of structure.
100150.0 is not a level.
It is the point where capital reconfigures its consciousness.
Some will buy.
Some will sell.
But only The Architect knows:
This is not the end of the move.
It is the beginning of its hidden cycle.
🏷 — The Architect, Capital Sector
🏷The language of markets is written in silence.
You do not predict it.
You recognize it — when it has already begun.

BTCUSDT _ Daily TimeframeBitcoin is currently sitting right on the midline support of a long-term ascending channel. This level has historically acted as a key decision zone for trend continuation or deeper correction.
Key Technical Levels
🔹 Support: ~$92,000 – $93,000 (mid-channel + demand zone)
🔹 Resistance: ~$105,000 – $110,000 (upper range)
🔹 Channel Ceiling: ~$145,000 – $160,000 (bullish target)
Scenario 1 – Bullish Continuation (Green Arrow)
If BTC holds above the mid-channel support, a bounce toward the upper trendline becomes likely.
Break above $110,000 would confirm momentum toward the long-term targets:
👉 $135,000 → $150,000 → $160,000
Scenario 2 – Bearish Breakdown (Red Arrow)
If price loses the $92K–$93K zone, BTC could slide into the lower channel support around:
👉 $82,000 – $86,000
This would still keep the long-term uptrend intact but indicate a deeper correction.
My Bias
BTC is at a critical support level. As long as this zone holds, the structure remains bullish with upside potential.
A clean daily close below the channel midline would shift the probability toward correction before any major continuation.

BTC Sector 85509.64: Capital Before the Tremor🏷 BTC Sector 85509.64: Capital Before the Tremor
🏷 19.11.2025
🏷 Capital Sector. Price Slice. System of Intelligent Anticipation. Capital Mapping — before instrument touch, this price slice is the planned action of major players.
🏷 85509.64 — As of publication, price has not yet reached this level.
🏷 The price has not yet touched the level — yet the structure already knows the path.
In the silence between orders, in the weight of unfilled volumes — the whisper of capital.
This slice is not a forecast. It is the market’s mind, frozen in numbers before the moment of truth.
🏷 Sector 85509.64 is active.
Touch — not if, but when.
Capital moves in silence.
The System sees ahead.
🏷 The light at the end of the tunnel — where others see only darkness.
🏷 — The Architect, Capital Sector

BTCUSD Daily Chart – Bearish Channel Breakout + Hidden DivergencPrice has broken below the bullish channel on the daily chart, signaling potential reversal. A hidden bearish divergence is confirmed on the stochastic oscillator, aligning with the breakout.
📌 Entry: After channel break and divergence confirmation 📌 Stop Loss: Above recent swing high 📌 Take Profit: Based on channel height projection or key support zone
System-based short setup using EMA structure and divergence logic.

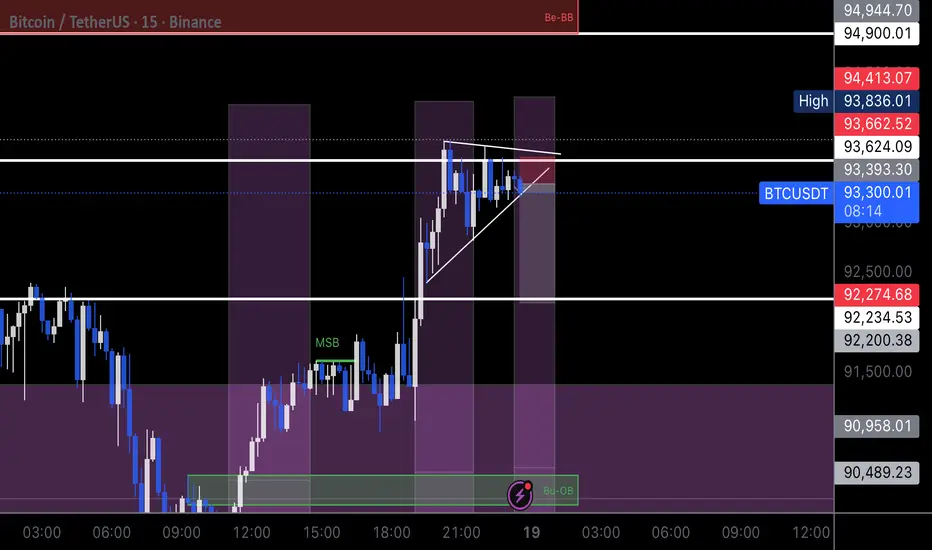
BTCUSDT.P - November 19, 2025Price is retesting the short-term resistance trendline and struggling to hold above the 93,000 area, suggesting weakening bullish momentum. A bounce toward the 94,000–95,500 resistance zone is possible, but failure to break higher may trigger a continuation of the broader downtrend toward the 89,000 support region.

BTC/USDTPERP BinanceBTC/USDTPERP #Binance #TA #Fibonacci
4H Hollows
As it was expected in the previous chart the price did indeed enter the support area, so at this point we have the following conditions:
first condition:
the price is expected to move sideways within the support area as shown in the extension of the Fibonacci retracement.
second condition:
a parallel descending channel has formed, where if the price moves within the parallel descending, it will advance within the support area.
if it does not break the support area, then the most likely is a rebound of the price, where the middle of the parallel descending channel will be broken.
third condition:
The price will continue to move within the parallel descending, until the price breaks out, either upwards or downwards.
Fourth condition:
The price, to move higher above $104,000 - $106,000, must break the upward diagonal line as we saw in the previous chart.
Good Luck
#CryptoHellas Team

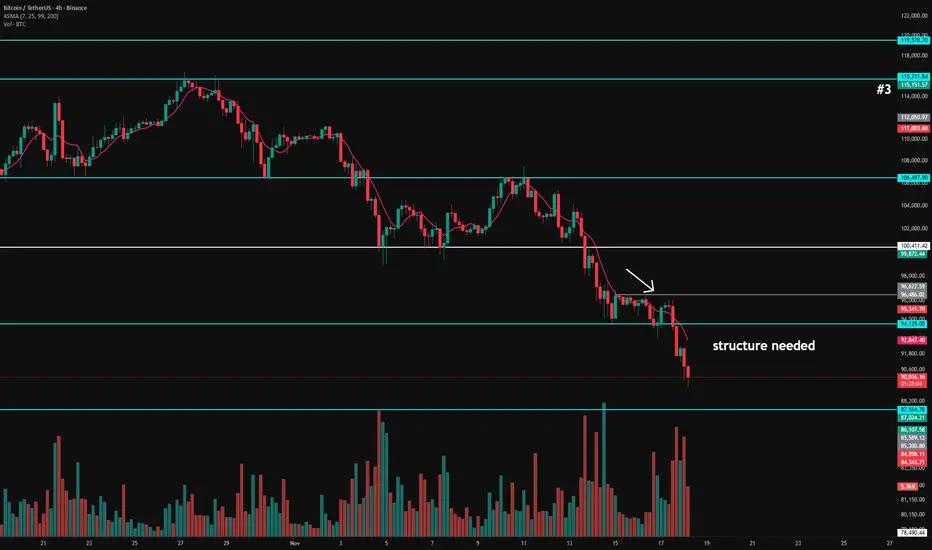
BTC trend wont be your friend forever. Bitcoin just bounced off the bottom of the downward channel. Momentum is trying to shift, but trend is still bearish until bulls reclaim the $96K zone.
Key points:
• Oversold signals firing across stoch & wave-trend
• MACD curling from deep red — early reversal signs
• Volume profile shows a low-volume gap above → clean path if $96K is reclaimed
• Rejection there = continuation of the downtrend
• Break above = room toward mid-$100Ks
Relief bounce is forming, but structure hasn’t flipped yet. Eyes on the yellow level — that’s where this move gets confirmed or denied.

BTC lost momentum in Small time frame. ShortingBTC going back to a demand zone after losing momentum. Hope it will play well.
Key Bitcoin & S&P Scenarios to Watch
S&P breaks out from triangle and daily trendline; Bitcoin forming a potential weekly head-and-shoulders — key levels to watch

$Bitcoing$A quick retest (here you'll see the most fakeouts) and a continuation.
Pls do your analysis before investing.

Bitcoin trend analysis!In our November 12 outlook, we noted that if price formed another lower high and failed again below the 107k resistance, momentum could fade quickly. That scenario played out: Bitcoin broke below the 102k support and slid into the 89k zone.
From here, if the current low holds, the next area that must be reclaimed is 92–93k. Buyers need to step in, a move back below this level increases the risk of a breakdown toward the 84k–82k region.
If price can stabilize and build a base here, upside hurdles to watch are 96–97k, followed by 100k and 107k

Bitcoin Analysis – November 18 | A Day for Patience & Observati
Hello to all my fellow traders! Hope you're having an amazing day! 🌟
Today is 18 Nov, and here’s the updated Bitcoin analysis.
I honestly expected the $93K level to break, as I mentioned before — I also said buyers needed to prove their strength one more time before any long position… but they couldn’t.
The market moved downward instead. 📉
My short position should have been opened below $94,000 yesterday, but unfortunately I wasn’t at the charts at that time and was outside.
🔍 So what are today’s scenarios?
Today, I’m simply going to be a viewer.
My main analysis timeframe is the 4-hour, and entries are on the 1-hour.
Right now, Bitcoin hasn’t built any clear bullish or bearish structure for me to take a long or short position.
❗Does this mean if BTC dumps to $87K or pumps back to $96.5K I still won’t take a trade?
Yes.
If my strategy doesn’t give me a setup, I won’t force a position. I’m not going to stress myself just to “be in a trade.”
So today's plan on Bitcoin:
➡️ Wait. Watch. Stay patient.
20 minutes before each 4H candle closes, I’ll check the chart again to see if a proper structure is forming.
📌 But today has a more important task: The Watchlist!
I expected BTC to lose the $93K level with rising dominance,
but the opposite happened — dominance fell, yet BTC still broke the level! 🤯
This means one thing:
I need to look at other crypto pairs against BTC — especially those with strong volume.
Examples:
ETH/BTC
SOL/BTC
If these pairs show a strong trend, then I will follow that trend in their USDT pairs.
In simple terms:
➡️ I want to find which coins dumped harder against BTC
➡️ or which ones did NOT dump at all
Those will be my priority today — that’s where I prefer to take risk.
🧠 Today’s Plan Summary
✔️ Wait for BTC to build a clear structure
✔️ Focus more on altcoins vs BTC pairs
✔️ Set alerts on important BTC levels: $87K and $96.5K
✔️ Build & update the watchlist
🔔 Final Note
Thank you for reading my analysis! 🙏
Wishing you profit, clarity, and blessings in every trade! 💛✨
The most important thing I can tell you is this:
⚠️ In unclear market conditions, it makes NO sense to take unnecessary risks or trade emotionally.
When we reach strong, meaningful levels in the future, I’ll say the opposite — but today is a day for patience.
Have a great day, traders! 🚀📊
BTC ON THE WAY 40KWake me up when BTC reaches that level — yes, the 40,000 zone.
Bitcoin is rising on its own.
Even at its ATH, it's still in a BEARSIH zone.
Besides that, alts are dying.
The comparison between their declines and their rises is insignificant.
For now, the alt season is just a small taste and sensation... and that's after a deep drop.
That's one thing I'm paying attention to.
I'm too lazy to comment any further.
The point is, BTC will reach 40,000. Wake me up when it gets there.

BTC the way on 89000🔍 What the chart is showing right now
1. Trend Bias:
Bearish Price is below EMA50 and EMA200 → structure still bearish.
Multiple lower highs and strong rejection from descending trendline.
Market is holding below major supply zones (100k–102k, 105k–107k, 109k–111k).
2. Current Area:
Demand reaction zone Price bounced from a blue demand block ~93.0k–94.5k.
Weak bounce so far — no strong volume or bullish displacement.
A lower-timeframe liquidity sweep happened at the bottom → short-term bullish correction possible.
3. Nearest resistance
First big sell zone: 97.8k–99.5k
If price reaches it, sellers will likely hit aggressively.

BTCUSDT Short – Absorption + Delta Shift Confirmation 11/18Reasoning / Analysis
Price is in a clear downtrend on higher timeframes – lower highs and lower lows confirming bearish structure.
On the 1-minute chart, price pulled back into previous supply and failed to break higher.
Inside the footprint chart, we saw positive Delta buying into resistance, but price failed to move higher → bulls got absorbed.
This is a classic Bullish Absorption → Bearish Reversal setup.
Key Signals:
🔹 Up-move into resistance with positive Delta, but no continuation → trapped buyers
🔹 Volume spike without follow-through = exhaustion
🔹 Trend remains bearish, so I trade in the direction of the higher-timeframe move
🔹 Clean entry after confirmation candle
Trade Plan
Entry: After confirmation candle failed to push higher
Stop Loss: Just above absorption wick (invalidates setup if broken)
Target: 1:1 RR at previous support
Session: Intraday scalp based on order flow / delta logic
Invalidation
❌ If price breaks the absorption candle body, signal is invalid
❌ If Delta continues rising while price pushes higher → buyers in control

BTC Approaches 89,256Hello, traders and investors!
This analysis is based on the Initiative Analysis (IA) method.
Bitcoin’s price is getting closer to the 89,256 level.
Yesterday, November 17, the daily candle closed as a seller candle.
The volume was accumulated in the upper part of the candle, and the candle itself showed increased volume.
In this configuration, a continuation of the seller’s move is quite likely.
Wishing you profitable trades!

BTC: 82 804.29 — The Price the Market Remembers.🏷 BTC
🏷 17.11.2025
🏷 Capital Sector. Price Slice. System of Intelligent Anticipation.
🏷 82,804.29 — As of publication, this price has not been reached.
You must understand: the market has prices — and each has its own timeframe of execution. Such is the mechanics of the market. One price may execute on the 1D timeframe; another, on the 1M. The retail sector must trade from levels with risk discipline — or comprehend the market, its mechanics, and move toward the price. You must understand that a price is being fulfilled — and allow the instrument to deviate from your target, creating momentum and distance toward its realization — then capture the move on significant, higher timeframes. ATH, bear market, or bull market — these are emotions. Timeframes, patience, and strategy — these are your allies.
Some paint decor and cling to indicators — but you must understand: the institution knows. Large capital paints the data behind your indicators. With one hand, it aids others; with the other, it drives you into losses. The liquidation machine understands technical analysis and the behavioral factors of the masses. Anticipatory markings — dynamic prices — outpace algorithms. By applying observation and statistical rigor, you can avoid being deceived by the theater of market makers — and take your move.
The trend for this week, as of publication, is defined by the price of 98,200. Over the coming days, we will advance above this level in the long zone, and decline below it in the short zone. Upper targets: the instrument is directed toward the price sector of 112K–118K. Beyond this range, the probability of executing unfulfilled prices within this period is minimal. Afterward, the instrument will continue its decline to collect liquidity and execute the prices that remain pending.
Instrument volatility averages 15–18%, distributed equally in both directions. In the prior publication, 88,194.49 was established as the decisive zone — confirmed by statistical behavior of institutional capital.
Our advantage lies not only in analysis — but in the price sector we define in advance. Until these prices are executed, the dynamic marking remains active.
We do not predict the market.
We record its reality.
Please excuse any stylistic imperfections—English is not my native language. I write not to perfect form, but to reveal substance. My authority lies in the structure of the market, not in syntax.
