btc_longhi
📈 signal BUY 🟢
🎲 Medium
📍 intry $94585.80
🎯 target $96487.02
🛑stop loss $92684.57
⚖️ ratio Risk/Reward: 1:1.00
please trade with a winner not me i am in loss monthly average.
Trade ideas

BTC Crash Warning! BEAR Market is here!BTC’s market structure is deteriorating. Order flow continues to weaken, and buyers are failing to absorb even modest sell-side pressure. The question now is whether the recent rally has reached its exhaustion point—and the evidence suggests it may have.
In a worst-case scenario, the broader market could push Bitcoin below 70k, with deeper downside levels at 50k, 40k, and an extreme capitulation zone near 28k. These levels are not predictions but plausible outcomes based on current momentum and structural breakdown.
The larger narrative is shifting. Cycles are no longer behaving as cleanly as before, and the era of “easy crypto money” appears to be fading. Potential reversal zones exist, but as long as the bearish structure remains intact, they offer limited reliability. Each attempt at a bounce has been met with stronger sell pressure, indicating absorption by larger players.
On the other hand, the 94–85k region stands out as an area where we could see a relief rally. However, expecting it to produce a new all-time high is optimistic under current conditions.
For now, I remain strategically bearish, not emotionally bearish. My first downside target is 92–90k, with the remaining levels outlined above depending on how the market reacts at each structural break.
For now BULL Market is OVER!
#Bitcoin #BTC #BTCUSD #Crypto #CryptoMarket
#BitcoinAnalysis #BTCAnalysis #CryptoAnalysis
#BearMarket #CryptoBearMarket #BTCBearish
#BitcoinCrash #BTCDowntrend #MarketBreakdown
#OrderFlow #PriceAction #MarketStructure
#CryptoTrading #TradingView #TechnicalAnalysis
#ReliefRally #LiquidityHunt #TrendReversal
#RiskManagement #SmartMoney

BTC ShortBTC wants to go down again. Ride the fall. Targets on the chart. DYOR
Take a look all our previous successful trades.

EVERYONE SELL NOW BTCUSDBTCUSD made a spike sharp retracement after the BOS and created an inducement and price made a pull back to reject from the ob zone with sharp rejections am looking forward to sell from this zone holding till new low is created87k is my measure target....

BTC | Monthly Cycle Exhaustion? Short Target to 78,275Bitcoin is currently trading around $95,800, and based on the higher-timeframe structure, I’m positioning for a bearish correction.
Setup
Entry: 95,800
Stop-Loss: 130,945
Target: 78,275
Risk-to-Reward: ~1:2 but inverse logic (stop is wider intentionally)
Why Short?
On the monthly chart, Bitcoin has completed what looks like a 5-wave impulsive rally, showing signs of cycle exhaustion. Logically, a corrective phase (A-B-C or range) becomes more probable after such a structured move.
Probability Estimate
📉 Bearish continuation probability: ~70%
📈 Bullish breakout probability: ~30%
This idea is not financial advice — just a probability-based positioning for a potential macro pullback before the next expansion phase.

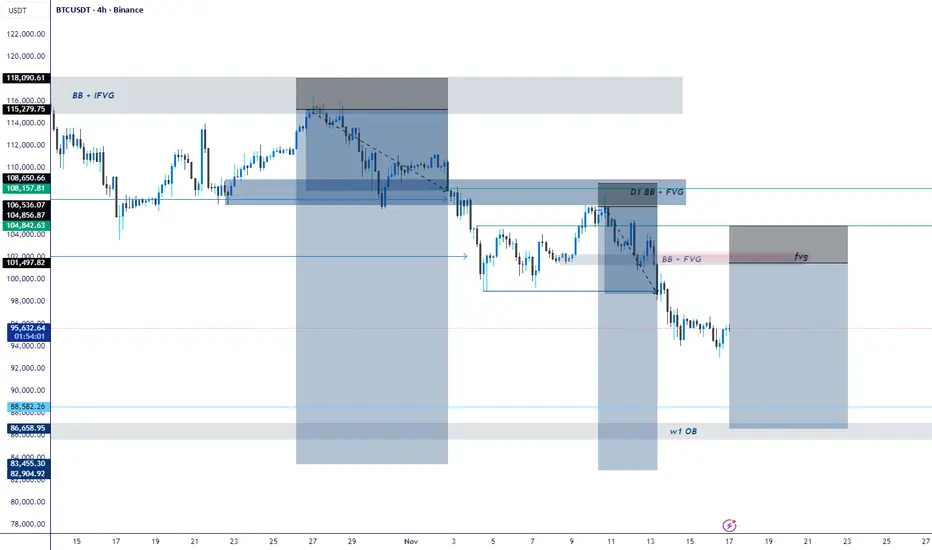
BTC Outlook: Premium Rejections, Clean Drawdown Targets, and KeyBTC continues to respect the higher-timeframe bearish order flow. Price tapped into the Daily Bearish Block + IFVG around the $104K–$108K premium zone, delivered displacement, and broke structure to the downside.
From there, the market formed a clean 3H Supply (BB + FVG) where sellers aggressively re-entered. Price rejected that imbalance and continued the markdown phase.
Structure remains bearish with lower-highs and lower-lows being printed. Current PA is consolidating below key structure, signaling that liquidity is being engineered for the next leg.
We still have an unmitigated Weekly OB at $83K–$86K, which aligns with the macro drawdown target. This zone remains the highest-probability area for a deeper corrective bounce.
K ey Levels
Premium Rejection Zone: $104K – $108K
3H Supply + FVG: $98K – $101K
Immediate Support: $92K – $95K
Major HTF Demand (Weekly OB): $83K – $86K
What I Expect Next
Retracement into the 3H FVG / inefficiency before another sell-off.
Liquidity below $92K likely to be swept.
High-probability macro reaction once price taps the weekly OB.
---------------------------------------------------------------------------------------------------------------------
CONFIRMATION ENTRY (Safer Approach)
Use this for precise execution:
Mark the 3H/1H supply zone.
Wait for price to tap the zone → no instant entries.
Drop to M15/M5 and wait for a clear CHOCH (shift) or BOS confirming sellers.
Enter on the pullback into the refined OB or FVG.
SL above the M5 POI that caused the break.
First TP at relative equal lows or clean inefficiencies.
This keeps you out of premature entries and filters manipulation.
Analytics: Market Outlook and Forecasts
📈 WHAT HAPPENED?
Last week, Bitcoin reached key resistance in the $105,800-$107,400 range, from which we expected a correction. If the seller showed weakness, it would be profitable to open long positions. However, there was no noticeable protection from the buyer, and the price decreased.
We’re currently at the lower boundary of the important medium-term support zone of $97,000-$93,000 (volume zone). The selling pressure is still high, but it’s not resulting in any significant movement. There is a lack of updates within the zone, and the angle of attack has decreased, while the volumes have increased. There are limit buyers present, but their activity is insufficient to indicate strength.
💼 WHAT WILL HAPPEN: OR NOT?
The medium-term market structure appears to be short-term. But the global picture still allows for a confident resumption — it just takes time.
We can expect a long exit from the current zone when a clear setup is formed. However, another decline wave is inevitable, as there is a strong volume zone above, which should be worked out under the current structure.
In a negative scenario, if there is no buyer interest, the decline will continue until the next global support.
Buy Zones
$97,000–$93,000 (high-volume zone)
$88,000–$82,000 (high-volume zone)
Sell Zones
$101,000–$104,000 (accumulated volumes)
$105,800–$106,600 (local resistance)
$109,500–$110,700 (accumulated volumes)
$112,400–$113,300 (accumulated volumes)
$114,700–$115,700 (accumulated volumes)
$120,900–$124,000 (high-volume zone)
📰 IMPORTANT DATES
Macroeconomic events this week:
• November 19, Wednesday, 7:00 (UTC) — publication of the UK Consumer Price Index for October;
• November 19, Wednesday, 10:00 (UTC) — publication of the Eurozone Consumer Price Index for October;
• November 19, Wednesday, 19:00 (UTC) — publication of the minutes of the US FOMC meeting;
• November 20, Thursday, 13:30 (UTC) — publication of the average hourly wage for September, the number of initial unemployment claims, the change in the number of non-agricultural workers for September, the unemployment rate in the United States for September, and the Philadelphia Fed's Manufacturing Activity Index for November;
• November 20, Thursday, 15:00 (UTC) — publication of data on second-hand housing sales in the United States for October;
• November 21, Friday, 14:45 (UTC) — publication of the US manufacturing and services business activity index for November.
*This post is not financial recommendation. Make decisions based on your own experience.
#analytics
101180Given that the price reached the 95,967 range, the bearish cycle will not continue for now and the 101,180 range will be available.

BTC possible scalping buyI would like to see BTC drop into the 94,100 zone to look for a potential bullish rebound, targeting the 97,900 area. This plan only becomes valid if we get a clear bounce inside the grey support zone marked at the bottom of the chart.
However, if price prints a strong bearish candle with a large body in that zone, I will not take the long setup. Instead, I would shift my bias and look for an opportunity to continue trading with the downward trend, aiming for lower levels.
The key here is confirmation, not anticipation — reacting to what price shows, not what we hope to see.
Summary:
📍 Long setup: Only if BTC shows a clear bounce at 94,100 → Target 97,900.
❌ Invalidation: A strong bearish candle in the zone.
🔄 Plan B: Look for shorts if support fails decisively.

The market seems to have completed the A wave of the ABC correctI mainly focus on Elliott Wave analysis. The chart has already completed a 5-wave impulse to the upside, and we are now in the ABC corrective phase. It looks like wave A has finished, and the market seems to be entering wave B at the moment.
I'm not sure how high wave B will extend, but I expect it to retrace to 0.382, 0.5, 0.618, or possibly 0.786 before dropping in a 1:1 measured move.

BTCUSDT Review November 17 2025Short-term price movement ideas.
Price has filled the monthly long FVG, which acts as a strong support zone and can trigger at least a corrective move. At the moment, after filling the FVG, we received a daily liquidity grab to the long side, with the next objective being the daily short FVG.
Following the liquidity sweep, a 4H FVG is forming. If price returns to test this 4H FVG and we get confirmation on lower timeframes, then a long position setup can be considered.
Be flexible, adapt to the market, and the results will come quickly. Good luck to everyone.

BTC Short Term Outlook Potential for a ReboundBTC Short-Term Outlook: Potential for a Rebound
***Warning*** : Personally, my average accuracy (win rate) is around 25-30% , but since this plan has an RRR (Risk/Reward Ratio) of 3:1 , it is still considered a playable setup
Positive Signal: Currently, the price is testing and bouncing off the lower support line of the Falling Wedge (around the 96,000 - 98,000 area). The price holding above this support level is a good sign.
Short-Term Target: The first objective of this rebound is to move up and test the upper resistance line . This aligns with the Take Profit target in your plan (around the ~102000-105000 area).
Strategy: The plan to enter a Long position at this point is, therefore, a strategy based on a Support Bounce. This offers an attractive Risk/Reward Ratio, as long as a clear Stop Loss is in place (e.g., at 90000~92000 as per the plan).

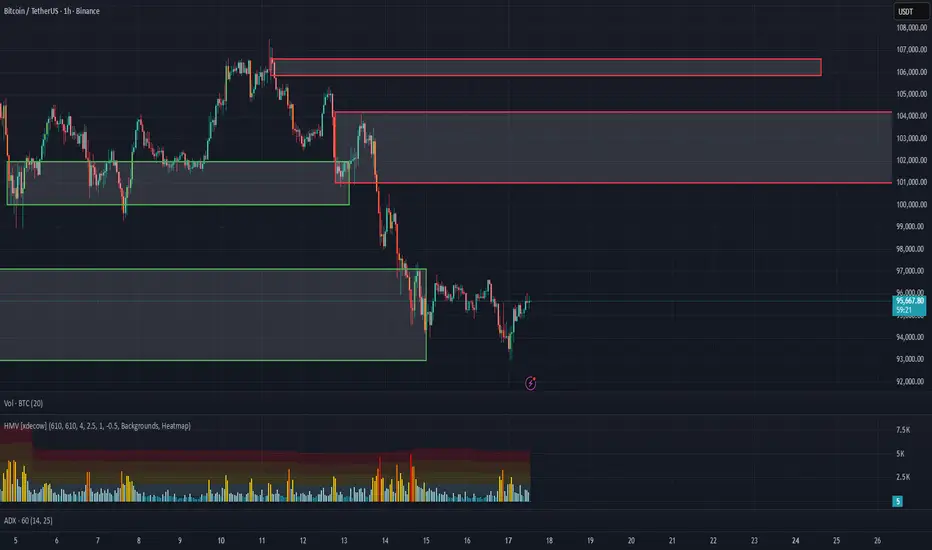
BTCUSDT – Trend Remains Bearish Below 97KPrice is still moving inside a clean bearish trend across all timeframes. Every bounce so far is just a pullback into supply with no real shift in structure. As long as price stays below 96.5K–97K, the bias remains bearish.
Resistance:
• 96.5K – 97.0K
• 98.0K – 98.5K
• 100.5K – 100.8K
Support:
• 93.9K (weak low)
• 92.8K
• 91.0K
Bias: Bearish
Setup: Sell pullbacks into supply
Targets: 94.5K → 93.9K → 92.8K

BTC | Long | Target: 114k - 116kThis technical analysis is for informational and educational purposes only. It does not constitute financial advice. Remember to always research and consult with a professional before making investment decisions. Good luck! 📈💼🚀

Buy the Fear: Top 5 Reasons to Buy Bitcoin at the Bottom Buy the Fear: Top 5 Reasons to Buy Bitcoin at the Bottom Right Now
The headlines are grim. The charts are painted red. The crypto Twitter euphoria has been replaced by a deafening silence.
It’s in these moments of maximum pessimism, when it feels like the entire market is throwing in the towel, that the greatest fortunes are often built.
While buying at the peak of a bull run is driven by FOMO (Fear Of Missing Out), buying at the bottom is an act of conviction and discipline. It’s not for the faint of heart, but for the
strategic investor, a market bottom represents a generational buying opportunity.
If you’re considering stepping in when others are stepping out, here are the top 5 reasons
to buy Bitcoin right now.
1. The Halving is on the Horizon
This is Bitcoin’s built-in economic catalyst, and it’s one of the most powerful forces in its ecosystem. Approximately every four years, the reward that Bitcoin miners receive for
validating transactions is cut in half. This event, known as the "halving," directly reduces the new supply of Bitcoin entering the market.
Think of it as a scheduled supply shock. History doesn't repeat itself, but it often rhymes. The previous three halvings (in 2012, 2016, and 2020) were each followed by monumental
bull runs that sent Bitcoin to new all-time highs. With the next halving expected in 2024, we are on the precipice of another major supply reduction. Buying before this scheduled
event positions you perfectly to benefit from the potential supply and demand imbalance that has historically followed.
2. The "Crypto Winter" Always Thaws
Crypto markets are cyclical. They are characterized by intense periods of growth (bull markets) followed by painful, but necessary, periods of contraction (bear markets). This
"crypto winter" serves a vital purpose: it flushes out weak projects, excessive leverage, and unsustainable business models, leaving the ecosystem stronger and more resilient.
We’ve seen this movie before. The 2018-2020 bear market saw Bitcoin drop over 80% from its high. Those who bought during that despair were handsomely rewarded in the
subsequent cycle. The current downturn, while painful, is part of this natural market rhythm. Winter doesn't last forever, and the spring that follows tends to see the strongest
growth. Buying now means you're acquiring assets before the thaw begins.
3. Unshakeable Long-Term Fundamentals Are Stronger Than Ever
Forget the short-term price noise for a moment and look at the foundational pillars supporting Bitcoin:
Digital Scarcity: There will only ever be 21 million Bitcoin. This fixed, predictable supply makes it a powerful hedge against the infinite money printing of central banks worldwide.
Growing Institutional Adoption: Major companies like MicroStrategy, Tesla, and a growing list of public and private institutions are adding Bitcoin to their treasury reserves. This isn't speculative day-trading; it's a long-term bet on a new digital asset class.
The Store of Value Narrative is Solidifying: In an era of geopolitical uncertainty and inflationary pressures, Bitcoin continues to prove its worth as "digital gold"—a decentralized, borderless, and censorship-resistant store of value.
These fundamentals haven't disappeared; they've become more entrenched. A low price doesn't mean a broken thesis; it means a discounted entry point.
4. Maximum Fear Signals Maximum Opportunity
Legendary investor Warren Buffett famously advised to "be fearful when others are greedy, and greedy when others are fearful." Right now, the market is drenched in fear. This is
quantifiable through metrics like the Crypto Fear & Greed Index, which has been languishing in "Extreme Fear" or even "Neutral" territory for months.
This pervasive pessimism is your best friend. It means the "weak hands" have already sold, and the assets are being transferred to the "strong hands" who believe in the long-term
vision. When there is no one left to sell, even a small amount of new demand can cause a
significant price increase. By buying when fear is at its peak, you are effectively going against the herd and positioning yourself for the eventual return of optimism.
5. The Dollar-Cost Averaging Advantage of a Lifetime
Trying to time the absolute bottom is a fool's errand. The smarter strategy is to use a market bottom as a prime zone for Dollar-Cost Averaging (DCA). By investing a fixed
amount of money at regular intervals (e.g., weekly or monthly), you smooth out your purchase price and avoid the risk of investing one large lump sum at a temporary peak.
A prolonged bear market is a DCA investor's dream. It allows you to accumulate a significant Bitcoin position at heavily discounted prices over time. When the market
eventually recovers and reaches new highs, your average entry price will be so low that
your returns could be exponential. You're not trying to catch a falling knife; you're systematically building a position in a foundational asset at a fire-sale price.
The Bottom Line
Buying at the bottom requires courage, a long-term perspective, and a steadfast belief in the underlying technology. It’s uncomfortable, and it will often feel like you’re making a mistake—until you’re not.
The combination of a looming supply shock, proven market cycles, rock-solid fundamentals, extreme market fear, and the strategic power of DCA creates a compelling
case for action. While the path may be volatile, for those with the fortitude to look beyond the daily charts, this isn't a moment of panic—it's a moment of profound opportunity.
Disclaimer: This article is for informational purposes only and does not constitute financial advice. Please conduct your own research and invest only what you are willing to lose. Cryptocurrency markets are highly volatile.

BTC 88194.99K the point where time bows before structure Carved in Stone: The Point Where Time Bowing to Structure
🏷 BTC
🏷 17.11.2025
🏷 Capital Sector. Local price slice at a moment. System of intelligent anticipation.
🏷 88194.99 — The price is carved. As of publication, the level has not yet been reached.
November 17, 2025 — not a date, but a portal .
Within it, as within an ancient temple, the number is inscribed: 88194.99 . Not approximately. Not “around.”
Carved — without room for interpretation, without space for opinion.
This is not a signal. This is the establishment of reality within the Capital Sector. Here, speculation ends; architecture begins. Lower timeframes fall silent. The crowd remains in shadow. Only those who understand the language of price sectors and anticipatory structures can read what has already been written.
To this core is bound a minimum impulse of 7% — not an option, but a structural imperative. Price does not merely move: it must validate the integrity of the sector. Thus, the range of realization is not shaped by desire, but by inevitability.
International horizons have long been marked: not all may approach the source without being burned.
To outsiders — no entry. Not because it is forbidden, but because it is inaccessible . Reality here is constructed according to rules that are not debated — they are executed.
The point is not an invitation. The point is a test.
— The Architect

BTC Weekly Outlook | November 17–21, 20251H timeframe — 50 EMA (black) for trend, 5 & 10 EMAs (white) for momentum.
Two scenarios I’m watching
Upper path (bullish): Reclaim the white EMAs, push and hold over the black 50, print a BOS up → ride impulse > shallow correction > continuation higher.
Lower path (bearish): Reject at/under the black 50, stay under the whites, print a BOS down → impulse down > corrective pop into the whites > continuation lower.
Bias: Leaning bearish while we sit under the 50. I flip bullish only after a clean upside BOS and a hold above the 50 EMA.

BUY BTCThe best area to buy Bitcoin
I think these are two good areas to buy and invest in and from these two areas Bitcoin can move upwards.
But please have a short-term volatility view and only keep a small amount for trend following.

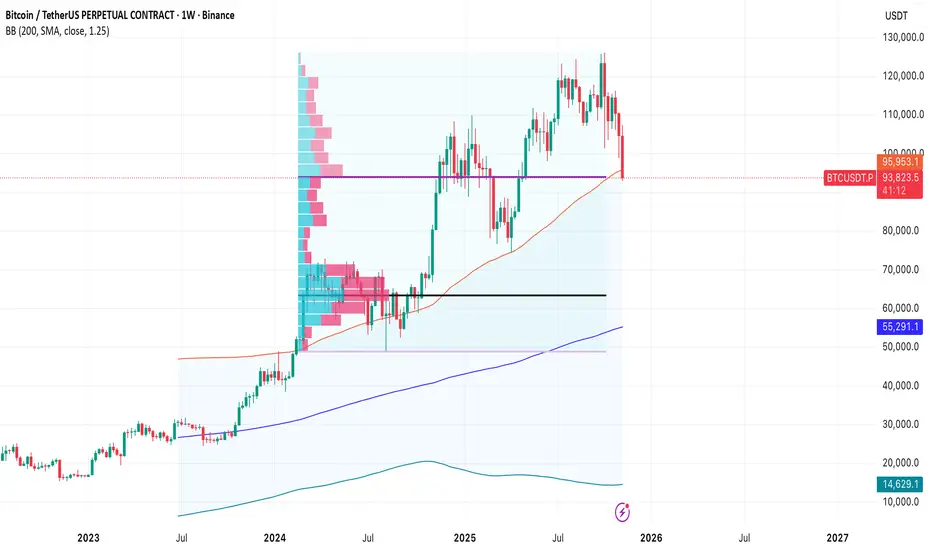
BTCUSDT has hit long term VAH. The bottom is in.I'm using BTCUSDT.P because FRVP uses volume.
long story short:
BTCUSDT has hit a very major VAH. it is likely going to hold. (starting points is when btc first broke out of 200 period weekly 1.25 std dev bollinger band a while ago cause thats when the major trend thats still going on started)
Fear and greed index at 10. so probably a good time to buy.
The overall sentiment is very negative, so probably time to buy!
also we're at the edge of the 50 period monthly 1.25 std dev BB too. a major long term support.
its time for a contrarian trade. ALL IN BABY!
BTC IDEABTC levels
Trendline level
Trend
Weekly
Support levels: ~$90K to ~$95K appears to be critical. If those break, further downside risk may follow.
Resistance / next move: Rallies above ~$110K–120K may mark a re-acceleration of bullish momentum.
Macro / institutional flows: Outflows from ETFs are a warning sign, while renewed inflows could trigger a move upward.
Regulatory & global factors: Clearer regulation and broader adoption may act as catalysts; conversely, regulatory crackdowns or macro stress (e.g., high rates, recession fears) could hurt.

The First Phase of Bitcoin’s Renewed Downtrend Begins📉 The First Phase of Bitcoin’s Renewed Downtrend Begins
After reaching the top of the descending regression channel,
Bitcoin has started its move toward the bottom of the channel.
This reaction confirms the preservation of the short-term bearish structure
and signals continued selling pressure in the market.
🎯 First Target: $90,000
📉 Next Levels: roughly $5,000 steps down
If the current momentum continues, the decline could extend toward the $70K–$75K range.

BTCUSDT LONGWe publish a short but accurate analysis. Bitcoin and the market will increase slightly. But the trend is still bearish.

BTC "Next infinity Movement"Geberated BY | 〽️YSignal Trader :
BTC "Next infinity Movement" achived its interaction with the intersections of GAN FAN & some trend lines
