$BTC Update – Quick & HonestStill bearish on Weekly & Daily.
Only 30-min & Monthly are holding green.
I know trading against higher TF trend is dangerous but here’s why I stayed calm & even bought the dip for members.
1- Weekly bounce zone + Monthly higher low
2- Weekly untested bullish Order Block + dynamic trendline support
Daily close below 83.4–85.6k = real trouble.
Till then → low volume, sideways, waiting for a trigger.
30-min flipped bullish yesterday → I posted free update here instantly.
Exact buy entries, SL & TPs → given in exclusive group.
That’s it. No hype, no bullshit, just levels & logic.
Trade ideas

Next Move Bitcoin Is 72.5K the Reversal Zone ?BTCUSD is still evolving inside a W-X-Y-X-Z complex corrective structure which is typical after a strong bullish leg this formation indicates that the market is still correcting but without showing any signs of a deeper bearish reversal
Based on my analysis Bitcoin seems to be targeting the $72,500 level which aligns with
A major liquidity zone
A relevant harmonic extension
The probable completion area for wave Z
A historically significant dynamic support zone
If price reaches this level and reacts with clean bullish signals rejection, divergence, momentum recovery this could mark the end of the corrective pattern and trigger a new bullish impulse
As long as BTC stays above major support levels the mid-term bullish structure remains intact.
I am closely watching the $72,500 zone as the key level where the correction might end and upside continuation could begin

BTC 1 week analysisbtc will take support from this area and 70% chance are the reversal going to happen from this area. we need to see how the BTC will react from this area.

BTC temporary recovery - short term this week📌 BTC Weekly Outlook Update — Plan Remains on Track
Bitcoin continues to follow the expected roadmap with precision. The recent price action confirms a corrective move to the upside before resuming the larger bearish structure.
📍 Current Structure & Price Behavior
BTC has shown a short-term bullish retracement after forming a temporary low. However, the overall outlook remains bearish as price continues to trade below key moving averages and under the major downtrend line.
Price is now heading toward the resistance area between 94,300 and 100,780 USD, where the following confluence exists:
Previous support turned resistance
Fibonacci retracement zone
Trendline rejection zone
Liquidity pool
This area remains the most important zone to watch early this week.
📈 Expected Move — Still Valid
The original plan remains unchanged:
Short-term move upward into the supply zone at 94K → 100K.
Rejection and continuation of the downtrend.
Price targets the Fibonacci 1.618 extension zone at ~80,000 USD.
🎯 Key Target: Fibonacci 1.618 (≈ 80,500 USD)
This level is crucial as it aligns with:
✔ A major demand zone
✔ The 1.618 Fibonacci extension
✔ A deep liquidity sweep level
✔ Potential cycle correction completion
This area is expected to act as the macro support level where buyers step in aggressively.

DeGRAM | BTCUSD continues to decline below $85k📊 Technical Analysis
● BTC/USD continues to move within a broad descending channel, rejecting the dynamic resistance line multiple times and forming lower highs.
● Price is failing to reclaim the 88–90K resistance zone, and the structure points toward a continuation lower into the 82–80K support region as momentum weakens.
💡 Fundamental Analysis
● Bitcoin remains under pressure as risk sentiment cools and ETF inflows slow, with stronger USD liquidity weighing on crypto.
✨ Summary
Resistance: 88–90K. Targets: 82K → 80K. Medium-term bearish bias while below channel resistance.
-------------------
Share your opinion in the comments and support the idea with a like. Thanks for your support!

BItcoin Short Term Analysis (4H)As we had already identified Bitcoin’s support zone in previous analyses, this area is still valid.
To assess Bitcoin in the lower timeframes, there are two possible scenarios:
One is that it starts moving upward from the current prices, and the other is that it revisits the green zone once more, forms a double bottom, and then moves toward the red target.
A daily candle closing below the invalidation level will negate this analysis.
For risk management, please don't forget stop loss and capital management
When we reach the first target, save some profit and then change the stop to entry
Comment if you have any questions
Thank You

BTCUSDT Long-Term Swing Setup: Key Supports to WatchBitcoin is consolidating above the $114,000 level, showing resilience after its latest pullback. The broader structure remains bullish as long as higher lows and the ascending trendline hold. Key supports below will be critical in determining whether buyers can sustain momentum or whether a deeper correction unfolds.
🔍 Technical Analysis
Current price: $114,405 (Binance Perpetual).
Price has bounced from recent lows and is attempting to reestablish upside momentum.
The long-term ascending trendline continues to guide bullish structure.
Strong demand zones remain layered below price action.
🛡️ Support Zones (if pullback occurs):
🟢 $101,412 – 1H Support (Semi-Risky Trade)
First reaction level, suitable for intraday setups.
Stop-loss: Below $97,802
🟡 $85,210 – Daily Support
A major base of demand, critical for maintaining broader structure.
Stop-loss: Below $83,701
🟠 $69,887 – Last 4H Support (Protected by Daily)
Long-term structural support and high-conviction entry zone.
Stop-loss: Below $68,614
🔼 Resistance Levels:
Immediate resistance: $116,000
Break above → continuation toward $120,000 psychological level.
🧭 Outlook
Bullish Case: Price sustains above $114,000 and pushes past $116,000 → opens the door to retest $120,000+.
Bearish Case: Break below $101,412 → correction into $85,210. Losing this zone exposes $70,000.
Bias: Bullish while above $101,412 and long-term trendline holds.
🌍 Fundamental Insight
Bitcoin remains supported by expectations of rate cuts, weakening USD momentum, and continued institutional adoption. However, macro risks (global liquidity, regulation, or risk-off sentiment) could add volatility, especially if equities face broader pressure.
✅ Conclusion
BTCUSDT remains structurally bullish above $114,000, with demand stacked across multiple support zones. Bulls aim for a push toward $120,000, but a break below $101,412 could trigger a deeper correction toward $85,210.
⚠️ Disclaimer
This analysis is for educational purposes only and does not constitute financial, investment, or trading advice.

Short-term analysis of Bitcoin (12H)After the heavy drops | which we had already identified in previous analyses () | Bitcoin is now approaching a strong supportive order block.
From the point where we marked the red arrow, Bitcoin entered a bearish phase, and it is expected that wave C of this phase will complete around the green zone.
We will see whether the price reaches the green area or not.
The initial target for this bounce can be the 95K to 96K range.
For any reason, the closing of a daily candle below the invalidation level will break the structure and invalidate this upward correction
For risk management, please don't forget stop loss and capital management
When we reach the first target, save some profit and then change the stop to entry
Comment if you have any questions
Thank You

Bitcoin pump will come soonBitcoin is standing at multiple support areas like the 0.702 Fibonacci, trendline, and weekly 100MA, and a pump is very likely to come soon pushing the price to 110k.

BTC/USDT | Bitcoin Hit Major Demand, What’s Next?By analyzing the #Bitcoin chart on the daily timeframe, we can see that the price dropped exactly as expected and fell sharply to $80,500. Once it reached this major demand zone, buyers stepped in and Bitcoin bounced back to around $83,900.
As long as BTC can hold above the large demand zone between $74,000 and $81,000, we can expect the next bullish wave to start.
From my perspective, the trend is not bearish! this is still a healthy correction.
From the ATH at $126,200, Bitcoin has corrected 36%, which is completely normal in strong uptrends. Now it’s time to watch for decreasing selling pressure and the beginning of a stronger upside move. This analysis will be updated soon.
Please support me with your likes and comments to motivate me to share more analysis with you and share your opinion about the possible trend of this chart with me !
Best Regards , Arman Shaban
Bitcoin Daily Analysis | Nov 22- Still a sellers’ market ?Fear & Greed Index is sitting at 12, which puts the market deep in Extreme Fear territory.
Today is one of those days where we simply wait for the market to show a reaction, and then we act based on our scenarios — not predictions.
Let’s break down the possible paths:
🔹 Scenario 1 — Bounce & Higher Low Formation
Bitcoin has shown a solid reaction to the $82,000 level and has bounced off that zone.
However, at the moment I still don’t have a valid long setup in my system. The structure simply isn’t ready yet.
What I’m waiting for:
A rejection from any nearby level
Followed by a higher low above $81,000 on the 4H timeframe
And then a breakout above the high that created that structure
That breakout would serve as my entry trigger.
Depending on Bitcoin Dominance (BTC.D), the position could be on BTC itself or on strong altcoins.
🔹 Scenario 2 — Retest of $82,000 & Short Opportunities
Another likely scenario is a retest of the $82,000 level.
If you're planning to take a short from that area, you’ll need to:
Drop to the 15-minute timeframe
Look for a clean structure
Enter only after a confirmed break of the local low (15m or 1H)
⚠️ Keep in mind:
Short trades here carry higher risk — simply because the market is printing lower highs and lower lows, meaning the trend is still bearish, and we want to stay aligned with the market’s momentum.
🔹 Scenario 3 — A Range for the Rest of the Week
There’s also a chance that this week will simply range.
If you haven't already picked out strong altcoins for the upcoming week, you might end up without a position — which is perfectly fine.
No position is better than a bad position.
✔ Final Notes
Never take risk management lightly — it matters more than any technical pattern.
Volume can be extremely helpful today to confirm whether the market supports your position’s direction.
Thanks for reading my analysis.
Wishing you a profitable day ahead — stay safe and disciplined! 🚀📉

Bitcoin Report — Is the sell-off over?Short answer: Not proven yet. Price is at a critical support area (≈ 85k–90k) after heavy selling; a bounce is possible but downside risks remain wide if that support fails.
Key technical facts
Current support zone: ~85,000–90,000 — price has bounced here recently and printed notable wicks around 80k during the weekend, showing buying interest. If this holds we may see consolidation in the 80–90k band.
Downside liquidity gap: There’s little on-chain / order-book support between 83k and 75k, so a break of 83k could accelerate a drop toward ~75k quickly.
Brave New Coin
+1
Momentum & structure: Market shows lower highs / lower lows and strong bearish candles—classic continuation structure until proven otherwise. Short-term oversold readings increase probability of a bounce or range, not a clean reversal.
CoinDesk
Fundamental drivers (why traders should care)
ETF flows: U.S. spot Bitcoin ETFs have seen record outflows this month, a big headwind to price (reduces institutional bid). This means less structural support and more sensitivity to risk-off moves.
CoinDesk
+1
Macro (Fed / USD): Market pricing around Fed rate cuts is moving; if expectations for no December cut stick, the USD stays strong and risk assets (incl. BTC) remain pressured. Recent news shows cut probabilities have weakened.
Reuters
+1
Miners / supply dynamics: Recent on-chain signals show miners moving from heavy selling toward more accumulation, which could reduce sell pressure over time — but this is early and not yet decisive.
The Coin Republic
+1
Practical trading plan (two scenarios)
Bullish (probability: conditional):
Condition: Clear double-bottom / strong bullish reversal candle in 85–90k zone + improving ETF flow or weaker USD.
Entry: Scaled longs on confirmed bounce (e.g., reclaim of local resistance).
Targets: 95k → 100k+.
Stop: below the weekend wick low (protect vs fast gap down).
Bearish (higher-probability while structure is bearish):
Condition: Close below 83k or failed bounce (strong bearish candle).
Entry: Short on break and retest or on conviction close below 83k.
Target: ~75k (fast path, low liquidity).
Stop: back above retest level / broken support.
Risks & timing
Weekend liquidity and ETF flow volatility can cause violent moves; use smaller size and wider stops.
Macro surprises (Fed commentary, US data) can quickly flip USD/risk dynamics — always check the economic calendar.
Bottom line: A bounce around 85–90k is plausible and would likely produce a choppy consolidation. But until 83k holds and macro/ETF flows stabilise, the door to 75k remains open. Trade small, wait for confirmation (retests / clean reversal candles), and manage risk tightly.

BTCUSDT SELL WITH LIMIT ORDER!!!!BTCUSD completed my last recent analysis predictions today we have the making a strong pull back into my poi after my inducement am taking a sell from that limit order after my min charts confirmations......

Lingrid | BTCUSDT April Lows Revisit - Possible Reversal ZoneBINANCE:BTCUSDT is rebounding from the major support zone near 82,300 after completing a full extension inside the downward channel. Price is now pressing into the descending trendline — a level that has capped every bullish attempt since early November. The market is forming a higher-low structure on the retest, hinting at an early accumulation phase.
From a fundamental side, Bitcoin is stabilizing as ETF inflows recover and risk sentiment improves after softer U.S. data this week, reducing pressure on high-beta assets. If buyers manage to break above the descending trendline and reclaim 93,300, this would confirm the start of a bullish recovery cycle.
➡️ Primary scenario: Break above the trendline → move toward 93,300.
⚠️ Risk scenario: Failure to break the trendline sends CRYPTOCAP:BTC back to for another liquidity sweep.
If this idea resonates with you or you have your own opinion, traders, hit the comments. I’m excited to read your thoughts!

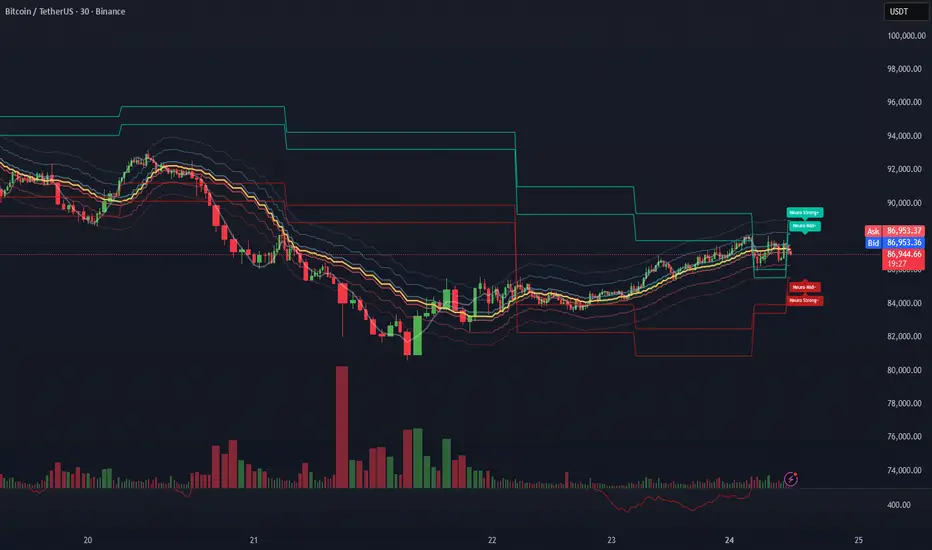
BTC (30m) – NPC-Based Rebuild After Dump | Volatility Zones After the sharp selloff, BTC has shifted from a momentum breakdown into a nonlinear stabilization regime inside the NeuroPolynomial Channel (NPC).
Instead of predicting direction, NPC helps quantify where price sits inside its volatility distribution.
1. Current Statistical Position
30m timeframe:
• Trading near NPC Core Cluster
• Distance from lower stress band: ~2.1%
• Distance from upper expansion band: ~1.8%
• Compression factor vs prior leg: ~0.63
This puts price in a statistical mean corridor, not in a trend exhaustion zone.
2. NPC Volatility Zones
Zone Area Distance Role
NPC Strong+ Upper 88,900 – 89,500 +1.8% Over-extension
NPC Upper Band 87,800 – 88,200 +0.8% Continuation band
NPC Core Cluster 86,900 – 87,300 Current Structural equilibrium
NPC Lower Band 85,600 – 86,000 -1.3% Rejection / test
NPC Strong- Lower 84,300 – 84,800 -2.6% Breakdown re-entry
3. Conditional Scenarios (Not Predictions)
Scenario A – Controlled Rebuild (~60%)
If price holds above the core cluster:
→ Rotation zone: 87,800 – 88,200
→ Stretch zone: 88,900 – 89,500
(~+1.8% to +2.3%)
Scenario B – Failed Rebuild (~40%)
If price loses the core cluster:
→ First test: 85,600 – 86,000
→ Risk zone: 84,300 – 84,800
NPC is used here only as a statistical structure lens, not a signal generator.
Let me know if you’re applying this on ETH / SPX / NIFTY — curious how it adapts across markets.
BTC/USDT CHART UPDATE !!Bitcoin (BTCUSDT) is currently approaching a major support zone between $76,000 and $80,000. The chart shows two possible scenarios:
If support holds, a rally to $90,000 or above is possible, continuing the overall long-term bullish trend.
If support breaks, a downward move is likely to retest the lower support zone before any major recovery move can begin.
The chart suggests that this area is crucial; the next major action depends on how the price reacts to this support zone.
DYOR | NFA

Could Bitcoin do another .79 retracement? The last major cycle saw bitcoin top & retrace to about the .79 level before strong buying interest re-entered it's market & propelled it to its most recent new highs. Could the start of a deeper correction be currently underway? 🤔

Banks and Global Markets: Their Crucial Role in World Trade1. Banks as the Financial Backbone of Global Trade
Banks have always played a central role in international commerce. From early merchant banking in medieval Europe to today’s digital global banking networks, banks provide the essential functions that allow trade to happen smoothly and safely.
1.1 Facilitating International Payments
The most basic function of banks in world trade is cross-border payments.
Exporters often demand payment certainty, and importers want delivery assurance. Banks bridge this trust gap using instruments such as:
SWIFT-based international transfers
Letters of Credit (LCs)
Bills of exchange
Bank guarantees
Documentary collections
A Letter of Credit, for example, ensures the exporter receives payment once shipment documents are provided and verified. This reduces default risk significantly and increases trade participation, especially in emerging markets where trust and creditworthiness are uncertain.
1.2 Financing Trade Operations
Trade finance is one of the oldest and largest banking activities. Banks provide capital for:
Pre-shipment finance (raw materials, manufacturing)
Post-shipment finance (waiting for payment)
Export credit from export-import banks
Foreign currency loans to purchase goods
Supply chain financing
Global trade is a long cycle—goods take time to produce, ship, and sell. Banks keep the cycle running by injecting liquidity, enabling even small companies to engage in large transactions.
1.3 Currency Exchange and Forex Operations
Every international transaction involves at least two currencies. Banks:
convert currencies for exporters and importers
provide hedging instruments (forwards, futures, swaps)
stabilize businesses against currency volatility
Since foreign exchange markets trade over $7 trillion per day, banks play a large role in making global trade more predictable by protecting businesses from sudden currency swings.
1.4 Risk Management and Trade Insurance
Trade naturally involves:
political risk
credit risk
transport risk
currency risk
legal and regulatory risk
Banks partner with insurers, export credit agencies, and global institutions to reduce these risks. For example, an exporter doing business in a politically unstable country may rely on export credit insurance provided through banks. Without such risk-mitigation tools, global trade flows would shrink dramatically.
2. The Role of Global Markets in World Trade
Beyond banks, global markets — stock markets, bond markets, commodity markets, and currency markets — form the infrastructure that supports the expansion of world trade.
2.1 Financial Markets Provide Capital for Expansion
Stock exchanges and global bond markets give companies the ability to raise funds for:
international expansion
building factories and export infrastructure
acquiring foreign companies
research and development
modernizing supply chains
Multinational corporations like Toyota, Apple, or Tata operate globally because they access international investors who fund their growth.
2.2 Commodity Markets Set Global Prices
International trade depends heavily on commodities—oil, metals, food grains, energy, chemicals, and more. Commodity exchanges like:
NYMEX (oil and gas)
LME (metals)
CME (agriculture, energy)
help determine global benchmark prices.
These markets:
ensure price transparency
reduce volatility through futures contracts
allow producers and buyers to hedge price risks
influence shipping routes and logistics costs
For example, when crude oil prices rise, global transportation and manufacturing costs increase, directly affecting trade flows.
2.3 Foreign Exchange Markets Enable Global Pricing
The global forex market ensures that:
companies can price goods in stable currencies
exchange rates remain liquid
central banks can stabilize currency movements
investors can allocate capital globally
Because of forex markets, a business in India can export to Japan, price goods in USD, hedge currency risk, and receive converted INR payments seamlessly.
2.4 Global Bond Markets Support Government Trade Infrastructure
Governments borrow from global investors to build:
ports
highways
airports
logistics parks
customs facilities
These projects reduce trade barriers and enhance a country’s export competitiveness. Countries with better credit ratings borrow at cheaper rates, giving them an advantage in global trade.
3. Banks and Markets Work Together to Power World Trade
Banks and financial markets are deeply interconnected. Their cooperation harmonizes global trade flows.
3.1 Banks Operate Inside Global Markets
Banks participate in:
currency markets
commodity trading
government and corporate bond markets
derivatives markets
This allows them to provide hedging and financing services to customers engaged in international trade.
3.2 Capital Markets Reduce Dependence on Bank Loans
When companies raise equity or issue bonds, they reduce stress on banks, freeing up bank capital for trade finance. This creates a balanced financial ecosystem.
3.3 Digital Platforms and Fintech Strengthen the Relationship
New technologies are transforming global trade:
Blockchain-based trade finance reduces fraud
Digital LCs speed up transactions
Fintech exporters’ platforms simplify international payments
Cross-border instant payment networks lower costs
Banks and fintech firms are creating a more transparent, faster, and more inclusive global trade system.
4. The Global Role of Banks and Markets in Shaping World Trade Patterns
Financial systems do more than facilitate trade—they influence who trades, what is traded, and how trade grows.
4.1 Emerging Markets Gain Access to Global Buyers
Banks in developing countries partner with global institutions to integrate local businesses into world supply chains.
4.2 Financial Markets Boost Competition
Open global capital markets allow companies from any country to compete on equal terms. For example:
Indian IT firms
Chinese manufacturing companies
Southeast Asian textile exporters
grew faster due to access to foreign investment.
4.3 Crisis Management and Global Stability
During crises (like 2008 or 2020), central banks and global markets stabilize economies by:
injecting liquidity
reducing interest rates
supporting currency stability
protecting banks and trade credit
This support keeps world trade from collapsing.
Conclusion: Banks and Markets Are the Lifeblood of Global Trade
World trade depends fundamentally on the smooth functioning of banks and global markets. Banks provide the trust, credit, payment systems, and risk management essential to international transactions. Global markets supply capital, set global prices, enable hedging, and ensure liquidity across borders.
Together, they form the invisible infrastructure powering globalization. Without banks and markets, trade would be slow, risky, and extremely limited. With them, businesses of all sizes—from small exporters to multinational giants—can participate confidently in the world economy.

BTC Retracement - Is it a FAKEOUT? Uh...YES!!!Following up on my analysis of BTC after this weekend and going into this Thanksgiving Week. Please take a look at my previous analyses of BTC after we hit the All Time High to see how I've mapped out this progression to where we are now. We have seen BTC drop down to exactly where we projected....the Weekly Demand Source. And as targeted for our more precise level, it came right down to the top of the Daily Zone of the Weekly Source (~80.6K). Wow! You can't make this stuff up, guys. This is solid thorough Technical Analysis that you too can learn!!!
Well, where do we go from here:
This review is a closer dive down into the Hourly time frame, where I think we have to monitor the prices for the short-term. We have seen a pullback this weekend that pushed us back up to the top of this Weekly Demand Source. That level is going to have strong resistance again, and I expect a rejection back down into this large Weekly zone.
It's important to note this weekend push up, we had an H1 BOS - H1 candle close above 86.4K. I expect that to be retested and see the price possibly bounce between this 86.4 - 88.4K range for a little bit. A close of an H1 candle back below 85.7K will be the sign that it is falling back to the source of this H1 break and back to the Daily Zone of the Weekly Source (80.6K).
Remember, we touched the top of the Daily Zone (80.6K), but I don't think that touch was significant enough. There are a LOT of buyers inside of that Daily Zone, and touching it with a wick is not sufficient from my experience. We need to see at least a 4 Hour Candle go deeper into that zone and see a strong bullish rejection.
When will we go bullish again:
The real sign of the fall being over is going to show up first on the H1, with an H1 BOS outside of that Daily Zone (77K - 80.6K). IF we see that, expect a return to the source of that BOS. From there, the bullish momentum needs to be confirmed on the H4 for the REAL BULL BUY.
For now, the higher time frames are still ruling. The Weekly MUST be satisfied with enough volume and activity within this weekly Source. Until then, again, don't get tricked into buying BTC unless you are short-term trading it.

Final 2025 Forecast for BTCUSDT 24th November 2025 (Updated)Same idea as previous post, just zoomed in to see the potential gyrations towards to move towards ~$128k and hopefully beyond ✌️
1. Friday session dip to around ~$81k
2. Pump to around ~$87k over the weekend
3. Dump down to ~$80k for Monday Trap
4. Black Friday Pump to ~$89k
5. Max Pain Dump to ~$75k-$79k
6. Final pump to ~$128k to end the cycle
If we are lucky and price pullbacks from ~$128k and then exceeds it. Here are the targets I would be looking at;
Target #1 $140k-$145k,
Target #2 $170k-$175k
Target #3 $200k-$205k
This of course could be 100% wrong so remember (as always) to ruthlessly ✂️ cut your losers when wrong, and hold ✊ onto your winners when right.
--
I might also add, come early December 1st - 5th the following celestial events will take place which support the run up to $128k (and possibly beyond);
1. Super Full Moon (“Cold Moon”) 🌖
• On December 4, 2025, there’s a nearly full moon (~98% illuminated). 
• This will be a supermoon, meaning the Moon appears slightly larger and brighter than average. 
• The Moon is in Taurus, and near the Pleiades (M45) — Taurus is represented no other than the Bull.
Supermoons correlate with:
• spikes in emotion
• increased speculative behavior
• temporary liquidity expansions
• bigger candles (up OR down)
A near-super full moon tends to:
• mark volatility apexes
• precede relief rallies
• create short-term “energy reversals”
2. Moon–Jupiter conjunction (Dec 7) — traditionally expansive 🌖
Jupiter is symbolically linked with:
• expansion
• optimism
• big moves
• risk-on thinking
• growth
• speculation
When the Moon (sentiment) aligns with Jupiter (expansion), it often coincides with:
• higher risk appetite
• FOMO
• bullish short-term flows
In Summary;
1. Moon–Jupiter conjunction (Dec 7) → Expansive, optimistic, risk-on symbolism
2. Super Full Moon (Dec 4) → Volatility peak → Reversal → Upward burst

BTC Fibo RetracementIn the meantime, here is my BTC plan. Now we are very close to ATH and I would wait for next retracement to enter long, if we are going to 120.
Zone Of Interest combines several reasons to make an entry.
• 0.5 Fibo
• Sell Side Liquidity
• Valid 8H FVG
• And a border of discount zone
It is not at all necessary that the price will fall to these levels, but if it will, I`ll be watching price action there and make my decision.
Have a good trades!

BTC MID TERM LONGWe can still wick to around 70k-ish levels on the weekly but no problem should close the month always above the middle green VIDYA line which currently sits at around 82k, any close below that would invalidate this and almost guarantee the 70k.
I don't believe the "cycle ended 1 year bear markat" narrative that everyone's talking about (yet?). Lots of bullish catalysts are upcoming such as further rate cuts, QT ending, QE starting, stimmy checks from Japan, China and U.S potentially. Global M2 supply increasing, potential gold profit taking and many others.

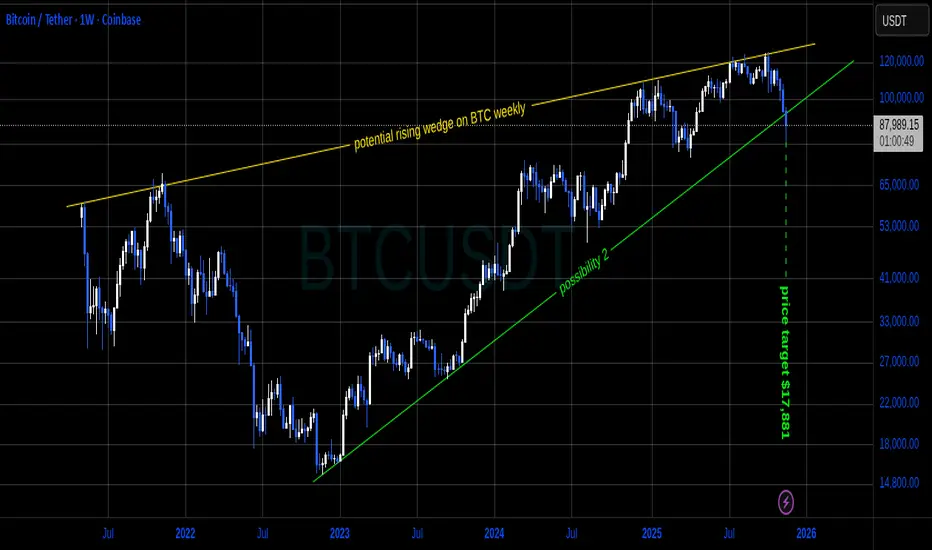
Update on a post I made Nov. 11thMy opinion on the matter still hasn't changed. This is only an idea. Do I believe this is going to play out this way? I have no idea. It for sure could though so still something to keep in the back of your mind. The weekly candle will be closing in roughly an hour. Closing at current price would indicate a clear breakout from the chart pattern and actually locking in a potential (sickening) price target of $17,881 USD per BTC. I'll be keeping this chart as is and post updates from time to time to see if this very large time frame chart pattern plays all the way out.
On a side note, I do not have any trades open based on this pattern breaking down. Nor do I plan to either. Just following this purely for educating myself and anyone else who might gain anything from it.