Bitcoin (BTC) – What Comes After the Sharp Drop?
A Technical Outlook Based on Smart Range Zones
🟦 Introduction
After a strong bearish move, Bitcoin has reached a critical juncture. The recent sell-off has driven BTC directly into the Low Range Zone , an area that historically generates strong reactions and often initiates relief rallies.
The market is now positioned between major higher-timeframe supports and mid-range resistance, making this an important decision point for BTC’s next major direction.
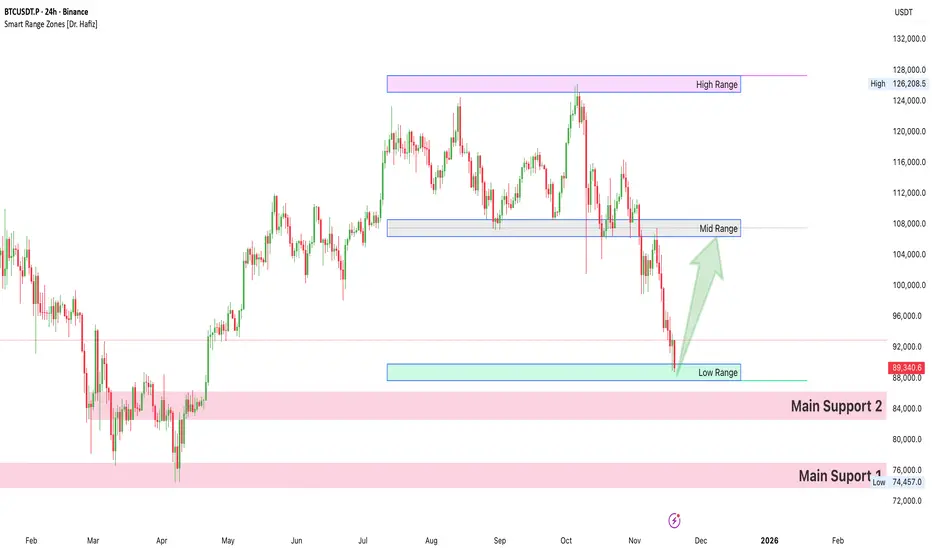
The attached Smart Range Zones chart shows precise High–Mid–Low ranges , plus two deep Main Support Zones, which together build a clear market structure roadmap.
🔍 Detailed Technical Analysis
1. Range-Based Market Structure
Smart Range System has clearly mapped the following key areas:
🔵 High Range Zone (≈ $124,000 – $128,000)
* Represents the upper distribution area.
* Strong supply; previous sell-offs originated from here.
* Bullish momentum must reclaim this zone for any attempt at new ATHs.
🟦 Mid Range Zone (≈ $104,000 – $110,000)
* Former support, now broken strongly.
* Likely to act as major resistance on any relief move.
* A textbook retest zone where trend continuation (bearish) often happens.
🟩 Low Range Zone (≈ $88,000 – $92,000)
* BTC is currently reacting inside this zone.
* Historically, this zone produced the largest bounce in July/August.
* If buyers defend here, a retracement towards Mid Range becomes highly probable.
2. Higher-Timeframe Support Blocks
Below the Low Range, your chart highlights two powerful demand areas:
🟥 Main Support 1 (≈ $74,500 – $76,000)
* Major untested zone.
* If reached, this would likely produce a l arge higher-timeframe bounce .
🟥 Main Support 2 (≈ $82,000 – $86,000)
* First deep HTF support block.
* Lines up with multiple historical volume clusters.
* Ideal for long-term spot accumulation.
If BTC breaks the Low Range cleanly, these supports become the next logical liquidity targets.
3. Price Action & Candle Behavior
* Long downward wicks inside the Low Range show buyer absorption .
* Momentum is slowing down, suggesting sellers are losing dominance.
* Strong, impulsive candles earlier indicate panic liquidation likely cooled off.
4. Market Sentiment & Liquidity
* The decline aligns with high-leverage liquidations.
* Fear index likely elevated, which historically aligns with bottom-zone entries.
* BTC dominance stable: no major altcoin rotation yet.
* Macro news still cautious but not aggressively bearish.
Sentiment currently favors a t echnical bounce rather than a full trend reversal.
📈 Potential Scenarios for BTC’s Next Move
🟢 Scenario 1: Relief Rally Towards Mid Range (Most Probable)
* BTC holds the Low Range (88k–92k).
* Short-sellers take profit → push price up.
* A bounce to 103k–110k (Mid Range) is likely.
* Here, BTC will face major resistance.
Key Level to Break for Bullish Continuation:
👉 **$110,000**
🔵 Scenario 2: Consolidation in Low Range (Neutral)
BTC may:
* Move sideways between 88k–95k
* Build a base for a stronger directional move
* This is typical after sharp drops
A consolidation would be healthy and would prepare liquidity for the next impulse.
🔴 Scenario 3: Breakdown Toward Main Supports (Bearish Extension)
If buyers fail to defend the Low Range:
First Target
👉 Main Support 2 (82k–86k)
Second Target (Max Pain Zone)
👉 Main Support 1 (74k–76k)
A drop this deep would require:
* Macro panic
* Major liquidation cascade
* Loss of current structural support
🎯 Summary
* BTC has entered the Low Range Support Zone , a historically strong reaction area.
* A bounce toward Mid Range (98–102k) is currently the highest-probability scenario.
* Failure to hold this zone opens deeper targets at 86k and 76k.
* Traders should monitor the Low Range for confirmation signals.
Trade ideas
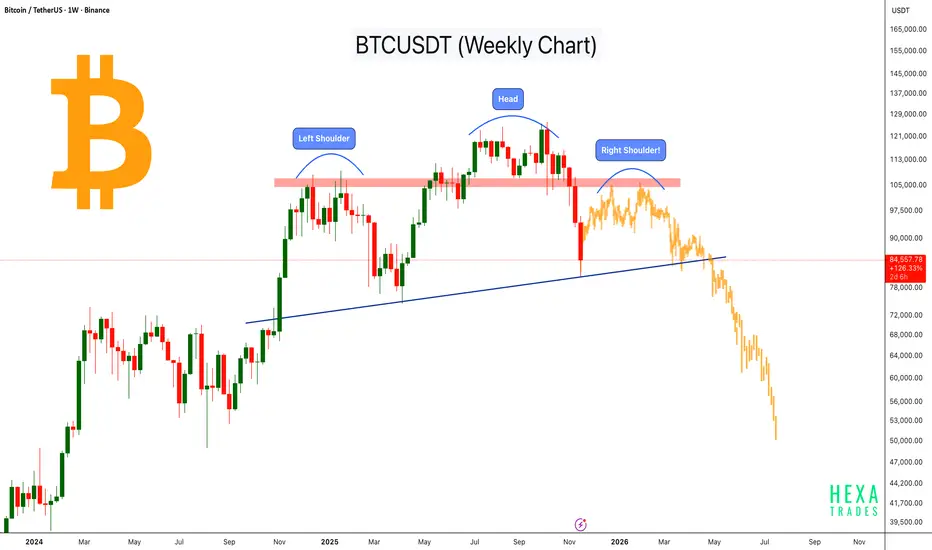
Bitcoin’s Macro H&S Structure Building Up!Bitcoin is developing a potential Head and Shoulders pattern on the weekly timeframe, a classic bearish reversal structure. The price has repeatedly rejected the major resistance zone marked in red, indicating strong selling pressure.
As of now, the left shoulder and head are already formed, and based on the current structure, the right shoulder could form within the next 1–3 months if BTC continues to face resistance near this zone $100k- $107k
Price is currently hovering near the long-term ascending trendline (neckline), which will play a key role in determining whether this pattern completes and confirms.
The yellow candles represent a forecast, illustrating a possible scenario if the right shoulder forms and the neckline breaks.
Key Highlights
- Left shoulder and head are already formed; right shoulder may form in the next 1–3 months.
- Strong rejection from major resistance, similar to classic H&S structures.
- Ascending neckline acting as final support.
- Yellow candles are only a forecast, not actual price data.
- Pattern confirmation requires a decisive break below the neckline.
This is an early-stage macro pattern, and traders should watch how BTC reacts around the resistance zone and the neckline in the coming weeks.
Cheers
Hexa
BTCUSD ShortAs you see in the chart, I see many reasons that we can see BTC to the level of 85,000$ by end of the year. So the reasons are:
Head&Shoulder pattern
Started the downtrend channel
The bold blue trendline is what the price is expected to touch.

BTCUSDTBTCUSDT price is near the support level 90196-88441. If the price can hold above 88441, it is expected that the price will rebound. Consider buying the red zone.
** This is not financial advice.
🔥Trading futures, forex, CFDs and stocks carries a risk of loss.
Please consider carefully whether such trading is suitable for you.
>>GooD Luck 😊
❤️ Like and subscribe to never miss a new idea!

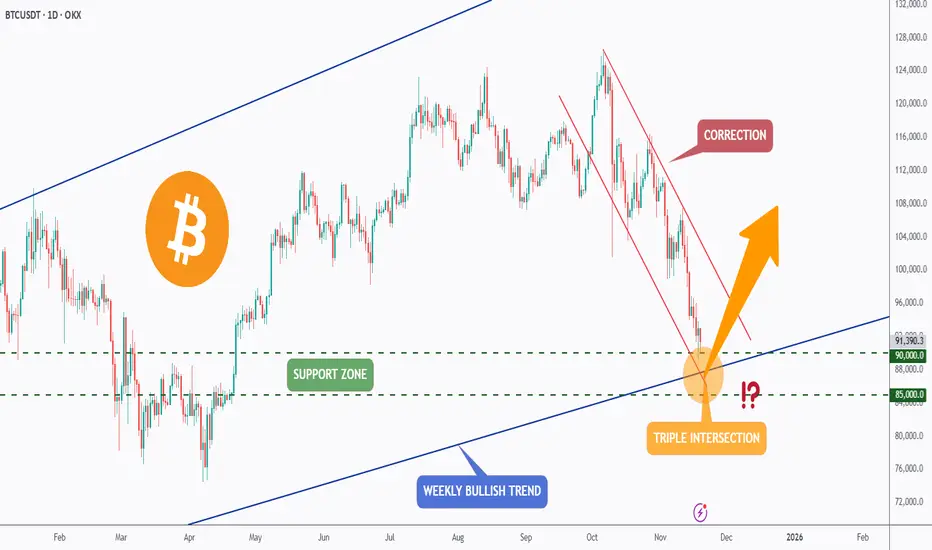
BTC - Triple Intersection… Now or Never for the Bulls?Bitcoin has been in a steep correction for weeks, sliding inside a clear falling channel. Despite the heavy sell-off, price is now approaching one of the strongest confluence zones on the entire chart, a triple intersection.
This key level combines:
1- The major weekly bullish trendline
2- The horizontal support between $85,000–$90,000
3- And the lower boundary of the falling corrective channel
This kind of alignment doesn’t happen often. It’s the area where long-term bulls typically show up.
As long as BTC holds above $85,000–$90,000, the macro bullish structure remains intact. A strong reaction here could trigger a reversal and kick off the next impulsive wave upward. However, if this triple confluence fails, the market may face a deeper correction before stabilising.
We’re standing at a decisive moment… will this zone ignite the next bullish leg or break down into another wave of fear? 🤔
⚠️ Disclaimer: This is not financial advice. Always do your own research and manage risk properly.
📚 Stick to your trading plan regarding entries, risk, and management.
Good luck! 🍀
All Strategies Are Good; If Managed Properly!
~Richard Nasr.
BTC Daily Analysisbased on our previous analysis bitcon made an announced ATHs and drop down from that point.
it is near our important support levels. we expect BTC ranges between its support and resistance levels.
in weekly timeframe we can't see any signs of downward movement.
if any of these levels breaks with ichimoku confirmation, i will update the analysis.

TradeCityPro | Bitcoin Daily Analysis #227👋 Welcome to TradeCity Pro!
Let’s dive into the Bitcoin analysis. The market is still very bearish and moving down rapidly.
⏳ 1-Hour Timeframe
Yesterday, the market continued its downward movement, and after breaking the 88,825 support, it made a very brief correction before breaking even the 83,333 level.
⭐ The support level we had for the RSI was 21.53. As you can see, RSI reacted to this level, and after its correction, it has now reached this area again.
🧮 From a momentum perspective, the market is highly bearish, and the movement has been very sharp. Volume is fully confirming the downtrend, and I believe after this sharp decline, we could see the start of a correction phase.
💥 We have a very important support zone at 80,000, where the price could move towards and potentially enter a corrective phase. However, in any case, I think the market has made its move, and for the downtrend to remain healthy, a correction is needed.
✅ At the moment, we can’t provide a trigger for a new position since the market has moved so sharply, like a speeding train. It’s better to wait and then hop on once the correction has started.
📊 For long positions, it’s clear that the market is still in a downtrend, and there is no structure supporting a long position. We’ll consider opening a long position only once the trend changes.
❌ Disclaimer ❌
Trading futures is highly risky and dangerous. If you're not an expert, these triggers may not be suitable for you. You should first learn risk and capital management. You can also use the educational content from this channel.
Finally, these triggers reflect my personal opinions on price action, and the market may move completely against this analysis. So, do your own research before opening any position.

BTCMy view on CRYPTOCAP:BTC has shifted. It looks like we are forming a descending channel and a small breakdown is playing out. Overall this will trap bears and create the illusion that the market is finished, but structurally it sets up a powerful rally to the upside.

BTC spot plans Bitcoin – Higher Timeframe Structure Update
Back in August, I highlighted that BTC’s move to the upside wasn’t impulsive but corrective. That played out exactly as expected: Bitcoin completed Wave B (yellow) near 126K and then sold off sharply into Wave C.
Zooming out, BTC is still in a larger Wave 4. Historically, Wave 4s tend to form triangle structures (A-B-C-D-E) rather than simple ABC corrections. These patterns are usually long, sideways, and extremely frustrating for traders.
At this stage, I’m tracking two possible scenarios, but based on current price action, there’s roughly an 80% probability that BTC is developing a Wave 4 triangle.
Key takeaway:
The market is still corrective on the macro level, and patience is required while the triangle completes.

BTCUSDTThe chart illustrates Bitcoin’s recent price action on the 30-minute timeframe, showing a steady recovery inside an ascending channel after a sharp prior sell-off. Price has been consistently respecting the green trendlines that define the channel, forming higher highs and higher lows as it climbs toward overhead resistance zones.
A broad blue consolidation zone occupies the middle of the chart, representing a region where price previously ranged before breaking upward. The latest candles are positioned near the upper boundary of this zone, suggesting a potential breakout. The chart highlights two major resistance levels, the first around $89,007, and a higher target near $91,044. Two upward arrows indicate a bullish projection, showing a possible continuation toward these resistance levels if momentum holds.
Below, the shaded red zones mark significant demand/support areas where buyers have previously stepped in—particularly around $84,739, and much lower near $81,000–$80,400. These areas act as safety nets should price pull back.
Multiple trendlines from earlier price action intersect above the current candles, showing previous downward pressure that has now been broken. The overall structure suggests an ongoing transition from a bearish drop to a controlled bullish climb within the channel.
In summary, the chart signals a constructive bullish setup: price is holding the ascending channel, attempting to break above local resistance, and eyeing higher targets if it can maintain strength.

BTCUSDT.P - November 24, 2025Bitcoin recently formed a short-term ascending channel, showing improving momentum after a strong prior selloff. Price is currently consolidating near 86,900, with key support at 85,900 and 84,400, and resistance at 88,100 and 91,900. A breakout above 88,100 would signal additional bullish momentum toward 91,900, while any failure to hold above the rising trendline could trigger a retest of lower support levels. The current structure suggests neutral to slightly bullish momentum in the immediate term.

Final 2025 Forecast for BTCUSDT 23rd November 2025 (Updated)Same idea as previous post, just zoomed in to see the potential gyrations towards to move towards ~$128k and hopefully beyond ✌️
1. Friday session dip to around ~$81k
2. Pump to around ~$87k over the weekend
3. Dump down to ~$80k for Monday Trap
4. Black Friday Pump to ~$89k
5. Max Pain Dump to $79k
6. Final pump to ~$128k to end the cycle
If we are lucky and price pullbacks from ~$128k and then exceeds it. Here are the targets I would be looking at;
Target #1 $140k-$145k,
Target #2 $170k-$175k
Target #3 $200k-$205k
This of course could be 100% wrong so remember (as always) to ruthlessly ✂️ cut your losers when wrong, and hold ✊ onto your winners when right.

If the 83292 is not broken,the price will increase to the 91732Given the fluctuations of the last 24 hours, if the mentioned range is not broken, Bitcoin will rise to the 91,000 range.

Btcusd update ooooopMany of you may be surprised, but unfortunately this decline will continue, at least to $74,000. But I will expect a temporary high. If you have seen the previous analysis, you will understand what I expect from the price.

Bitcoin Elliot Wave Correction : 40K Bitcoin completes it’s Elliot wave pattern with 24K marking the top of this cycle .
85K likely the bottom for this first wave down with a relief rally expected to 113K .
From there 42K is the next possible support for the second wave down. Saylor is in trouble.

A possible mid-term path for BTCUSDTWe may see a short-term move up to form the right shoulder. If that plays out, a corrective C-wave could follow. Under this scenario, a target below $47,000 comes into view.

Long btcLong btc
E1:77
E2:73
Bitcoin Approaches Key Weekly Support
Higher Volume Loss Pushes Price Towards 77&73 Levels
Stay With Us

BTCUSDT.P - November 23, 2025Bitcoin remains in a pronounced daily downtrend with persistent lower highs and lower lows, reflecting strong bearish momentum. The price is now targeting major support zones near 78,250 and 60,300. There is currently no indication of reversal; a sustained move above support would be necessary to suggest any bullish recovery. Until then, momentum and trend bias remain decisively bearish.

BTC bullish ideabitcoin has been moving inside a triangleand it's time to breakout and I believe itt will break from the top.

Bitcoin Faces Renewed Pressure as 91,900 Support WeakensHello everyone, looking at BTC on the 4H timeframe, I can clearly see the market leaning decisively to the downside after failing to break through the 93,160 USD zone. The current rebound is quite weak — small candles, thin buying pressure — indicating that the market is simply taking a “technical breath” rather than preparing for any meaningful push upward.
The 91,900 USD level is acting as the nearest support, but the chart reflects clear hesitation from buyers. The expanding red FVGs above show that selling pressure continues to dominate. If BTC slips below 91,500 USD, the bearish structure will extend and price could quickly retreat toward 90,000 – 89,500 USD, where a significant amount of liquidity is waiting.
The news backdrop isn’t helping buyers either: the Fed maintains a hawkish tone, the USD is strengthening, market sentiment has turned cautious, and capital is favouring the sidelines instead of stepping in to support price.


BITCOIN — THE SUPPORT LINEBitcoin’s ultimate support for bulls lies between the two black lines shown above.

fé
Having faith in God means believing that, even in the face of difficulties, there is a higher power that understands human suffering and can help overcome it.
