BTCUSDT - Technical Analysis📊 BTCUSDT - Technical Analysis (1H)
As you’ve seen, the bearish scenario I projected earlier has played out almost perfectly — just about one day earlier than expected.
Currently, based on the regression channel patterns observed in previous downtrends, the candle shadows haven’t yet broken out of the lower boundary.
This indicates that the market is likely to experience one more leg down before the corrective structure completes.
🔻 Expected Final Drop Zone:
📍 94,200 – 93,000 USDT
Until we see confirmed consolidation above this range, the short-term trend remains bearish.
After this final drop, Bitcoin is expected to enter a temporary recovery phase, retracing part of the decline before preparing for the next major bearish wave.
These corrective upswings typically last around 4 to 7 days, serving as a “cool-down” or “rest” phase within the larger downtrend.
⚖️ Always remember:
Bitcoin moves like a ball — the higher it goes, the harder it falls; and the harder it hits the ground, the higher it bounces.
💬 Now I’d love to hear your thoughts!
What do you think about this setup?
Drop a comment below — your perspective could help others (and me) see the market from a new angle.
Trade ideas

$BTC's Perilous Support Dance: Hold at 93.6K or Plunge to 90K?BINANCE:BTCUSDT CRYPTOCAP:BTC 's Perilous Support Dance: Hold at 93.6K or Plunge to 90K? 📉🔴
Current trend screams bearish short-term—price testing that critical 93.6K support amid heavy long liquidations (1.75B hit!).
Neutral RSI & MAs offer no lifeline, while high volume hints at more selling pressure from ETF outflows.
Expect a deeper dip to 90K if support cracks; breakout above 106K resistance feels like a pipe dream for now.
Watching volume spikes & 50-day MA crossover next.
Tight stops, folks! 🚨
#BTC #CryptoCrash #TradingView

Bullish support in BTCBtc is changing its movement before showing its next move.
Marked levels are support and resistance zone according to me. This is not a signal or tips it's just my analysis.
Let's see the results 😇.
Hope getting some people to discuss in more instruments.
Happy trading and happy weekend 🎊.

IMPORTANT INFORMATION This will be BTC last dip whatever level it reaches. Whether it tests the support or skip it again. I know exactly which pattern number BTC is currently in.
It’s true that BTC needs this dip to continue its next uptrend, or to restore it's previous broken pattern. Key quarterly support level are $62,676 and $48,000, and lowest skip support levels noted at $1,071, $415 and $7, they all are 100% accurate. (Minimum dip required $62,676 which is slso BTC skip quarterly support)
But I am also 100% certain after this correction BTC for next 40 to 45 years, almost 4 to 5 decades will not return back to this level
So my advice, Buy the dip so that no regrets remain.
This message is for educational purposes only. Always DYOR.

BTCUSDTmy entry on this trade idea is taken from a point of interest below an inducement (X).. I extended my stoploss area to cover for the whole swing as price can target the liquidity there before going as I anticipate.. just a trade idea, not financial advise
Entry; $79262.51
Take Profit; $120432.65
Stop Loss; $74034.25

$BTC Trendline Snap – Liquidation Storm Ahead?BINANCE:BTCUSDT CRYPTOCAP:BTC Trendline Snap – Liquidation Storm Ahead?
Current trend: BTC's shattered the descending trendline, plunging from 103K highs into a bearish freefall—now eyeing the 95.8K support with liquidation clusters looming like dark clouds ⚡.
Hold support? Dicey 50/50; volume surge on reds could flush it, but oversold wicks might trigger a vicious V-reversal if buyers defend.
Breakout above resistance? Far-fetched short-term—needs 107K reclaim and trendline flip for any bull hope, unlikely without macro tailwinds 🚀.
Dip risk? Severe to 94K or sub-90K cascade on break, with 1.048B liqs as gasoline.
Target: Downside 95K test; rebound cap at 102K if holds.
Indicators tracking: RSI (25, extreme oversold), MACD death cross, and liquidation heatmaps 📉.
#BTCBreakdown #CryptoLiquidation #AltcoinPioneers

BTC todayScenario 1: Bounce from upper trendline and W FVG (93/87k) - Bullish.
Scenario 2: Breaks upper trendline and Keeps free falling to retest 74k support - Bearish.
STOP listen to influencers that don't make money from trading. They make money from the shit they sell you and the money you put on their affiliate code.

GG. Bitcoin on the brink of death!So I have been preaching this upcoming dump since des last year. We had consolidation since that time. And now we are showing exhaust in price action.
See you guys sub 10k.
Enjoy this fabulous dump.
I will be buying.

BTC AT A CROSSROADS A make or break moment for CRYPTOCAP:BTC
If market holds @ 95k we could get a reversal otherwise this may be one of the deadliest crash

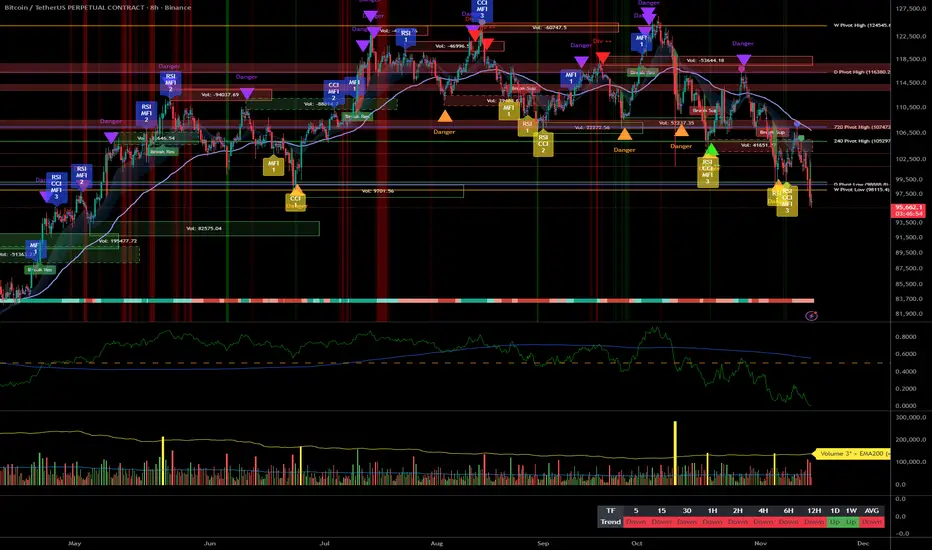
BTC at HTF Shelf: Execute Only on ≥2H Reversal__________________________________________________________________________________
Market Overview
__________________________________________________________________________________
Risk-off momentum drove Bitcoin into a dense multi-timeframe demand shelf, where price is probing for a reaction after losing 98k–100k. The next impulse likely comes from the battle around 95.8–95.9k and whether buyers can stage a clean reversal.
Momentum: Bearish drive into HTF demand; intraday trend remains down while daily is mixed-to-up in the background.
Key levels:
- Resistances (12H/1D): 97,300–98,200; 100,000; 101,600–103,000
- Supports (2H/4H/12H/1D): 95,820–95,920; 95,200–95,000; 92,000
Volumes: Very high on 12H and below (sell waves); normal on 1D — momentum is flow-driven, not a pure volume vacuum.
Multi-timeframe signals: 12H/6H/4H/2H/1H downtrends; 1D uptrend — execution should respect 12H Down unless ≥2H prints a confirmed reversal at 95.8–95.9k.
Harvest zones: 95,900 (Cluster A) / 95,000–95,200 (Cluster B) — ideal dip-buy zones for inverse pyramiding if a ≥2H reversal confirms.
Risk On / Risk Off Indicator context: Neutral Sell — confirms the risk-off push and argues for patience on longs unless the cluster defends with real follow-through.
__________________________________________________________________________________
Trading Playbook
__________________________________________________________________________________
We operate in a corrective, risk-off tape pressing into HTF demand; take a tactical stance and let ≥2H confirmation lead.
Global bias: Neutral Sell while under 98,000–100,000; key invalidation for shorts = reclaim and close above 98,000 with follow-through.
Opportunities:
- Buy: Only on a ≥2H bullish reversal from 95,800–95,900; target 96,600–97,000 then 97,800–98,200.
- Breakout: Reclaim >98,000 with momentum → ride into 100,000 then 101,600–103,000.
- Tactical sell: Fade failed retests at 97,800–98,200 or a ≥2H close below 95,800 with a failed retest.
Risk zones / invalidations: A sustained ≥2H close below 95,800 would invalidate the bounce idea and open 95,200–95,000, then 92,000.
Macro catalysts (Twitter, Perplexity, news): Heavy spot ETF outflows reinforce risk-off; global equities in broad risk-off; upcoming FOMC/CPI could shift dollar/liquidity and the crypto beta.
Harvest Plan (Inverse Pyramid):
- Palier 1 (12.5%): 95,900 (Cluster A) + reversal ≥2H → entry
- Palier 2 (+12.5%): 92,100–90,100 (-4/-6% below Palier 1)
- TP: 50% at +12–18% from PMP → recycle cash
- Runner: hold if break & hold first R HTF (97,800–98,200 zone)
- Invalidation: < HTF Pivot Low 95,000 or 96h no momentum
- Hedge (1x): Short first R HTF on rejection (97,800–98,200) + bearish trend → neutralize below R
__________________________________________________________________________________
Multi-Timeframe Insights
__________________________________________________________________________________
HTF uptrend (1D) conflicts with intraday downtrends, placing the burden of proof on buyers at the 95.8–95.9k shelf.
12H/6H/4H/2H/1H/30m/15m: Downtrends with very high sell-side volume; repeated tests of 95.8–95.9k raise risk of a flush if it fails, while failed breakdowns can spring sharp squeezes into 97.3–98.2k.
1D: Still up but losing momentum; the 95.8–96.0k cluster aligns with multiple prior pivot lows — a defendable shelf if buyers print a clean reversal and reclaim 97.8–98.2k.
Divergences/confluences: ISPD DIV = BUY at the cluster while Risk On / Risk Off Indicator = Neutral Sell — confluence for reactive bounces only, not blind catching; wait for ≥2H confirmation.
__________________________________________________________________________________
Macro & On-Chain Drivers
__________________________________________________________________________________
Macro risk-off and ETF outflows pressure BTC; the path hinges on whether flows stabilize and the 95.8–95.9k shelf holds.
Macro events: Global equities are risk-off; energy/geopolitics keep volatility elevated; upcoming FOMC/CPI loom as catalysts that can swing liquidity and risk appetite.
Bitcoin analysis: Breakdown below 100k with a six-month low near ~97k; weekly close vs ~101k is pivotal. Heavy ETF outflows and liquidations weigh unless key resistances are reclaimed.
On-chain data: Long-term holders have been distributing, but sellers show signs of exhaustion — a setup for relief if flows stabilize and levels reclaim.
Expected impact: If the shelf holds and outflows cool, a relief bounce toward 97.8–98.2k and 100k is likely; otherwise, a clean failure risks 95.0k then 92k.
__________________________________________________________________________________
Key Takeaways
__________________________________________________________________________________
We are in a corrective, high-volatility test of a dense demand cluster.
- Trend: Intraday bearish within a mixed HTF context; respect 12H Down unless ≥2H prints a clean reversal.
- Best setup: Reactive long only on a ≥2H reversal at 95.8–95.9k; otherwise fade failed retests at 97.8–98.2k.
- Macro factor: ETF outflows are the main headwind; watch FOMC/CPI for a regime nudge.
Stay patient, let the shelf prove itself, and treat each move like a boss fight — confirm the phase before committing.
Is 92k possibly the target?BTC might go for a trip near key support zones.
92 first
Or 130 next?
I think we are going for quite a trip before the next ATH

BTC AND XAU (GOLD) CHART COMPARISON Today, I compared the BTC chart with the historical XAU (Gold) chart. BTC is currently in the same pattern number that Gold occupied in the past. From that point, Gold took 20 months to test its support without breaking above resistance or experiencing any further price increase. Afterward, without breaking the pattern, it continued its uptrend with the same structure for another four years, before eventually breaking the pattern and entering a correction, forming multiple new patterns that led to the next uptrend, which is still ongoing.
Based on the analysis of both charts, BTC may test its support around October/November 2026.
This message is for educational purposes only. Always DYOR.

h-pattern usually takes the targets There are patterns that simply play out. Regardless of news, politics, and hopes. The h-pattern is one of them.
Further confirmation comes from the rejection of S4 on Camarilla pivots.
The usual behavior of assets, not just BTC, is to bounce off S4 and, if the trend is bullish, continue to P—the main pivot point and even up to R4 of time-limited movement within the week.
The rejection of S4 is most often a signal that the asset does not have the strength to continue upward.
The approximate coincidence between the target of the h-pattern and S5 from Camarilla pivots gives reason to watch for the next support zone in the 93500 - 92500 area.
Stay safe. No fear, no fomo, risk management is the key.

BTC Bearish Structure Targeting Lower LiquidityBTC is maintaining a clear bearish trend on the higher timeframes. Price keeps forming lower highs and lower lows, confirming seller momentum. As long as BTC stays below 103,800 any bounce is likely just a pullback into supply before continuing downward.
Resistance / Supply
103,800
106,700
111,100
Support / Targets
99,800 broken
96,000
94,000 to 92,000 liquidity zone
Direction
Bearish toward the lower liquidity areas unless price reclaims the structure.

BTC >> Bearish signal As shown on the chart Bitcoin has a negative signal and near to continue failing to the 91-92 area and then will see the reaction of the bitcoin
in all situation bitcoin will keep bearish till closing weekly above 107-108 area then we can update the continuing of the bull run situation
# This is not a financial advise
#do your own research
thanks .

BTC: The Key Buyer Zone Lies Even LowerThe 89,256 level remains a relevant demand zone across all timeframes — from monthly to daily. The 86,000–79,500 area is the key volume zone where a long-term buyer is most likely to appear.
Hello, traders and investors!
This analysis is based on the Initiative Analysis (IA) method.
Let’s take a look at the Bitcoin monthly chart and identify the zones where a buyer is likely to appear.
The last buyer initiative began at 74,508 and ended at 126,199.
The 50% level of this initiative — 100,353 — was already tested in November.
The key candle (marked on the chart as KC, the candle with the highest volume within the buyer initiative) sits at the base of the move.
Notably, this key candle formed as a manipulation (false breakout) of the 89,256 level.
For this reason, the 89,256 level remains highly relevant on the monthly timeframe — this is a zone where a long-term buyer may reappear.
During that manipulation, the key volume was accumulated in the 86,000–79,500 range (!).
On the weekly chart, the 89,256 level is also important — it represents the previous lower boundary of the weekly range, which is still relevant.
On the daily chart, this level remains meaningful as well, since it is an untouched target from the previous daily range (marked with a red line).
Thus, the area around 89,256 — together with the volume zone 86,000–79,500 — is a strong candidate for finding long setups.
Wishing you profitable trades!

BTC JUST TESTED DECODED SUPPORT 🚨The support level at $96,800 that I mentioned yesterday has just been tested by BTC, The remaining support levels are likely to be tested in the coming days🚨
Follow to stay updated.

Btc will go to $94k.Hello Trader's
Currently BTC/USDT pair looks more bearish then bullish as bulls fails to defend $100k level. According to chart we are in 4th wave in Elliot wave theory which gives target of $94k and as per stochastic RSI in Weekly timeframe we are about to flip trend. As per History In weekly time frame for RSI is also important If we Stays above 41-42 There is more Gains in BTC to Come. However 4 Year Cycle Concept ( I ALSO BELIVED IN IT) Seems braking because of Institution's Entry in this cycle ( Tarif Effect also ). I still believe that After reaching 94k We can see fresh surge in Crypto in Coming Months. On the other hand we have just touch falling wage pattern target we can also see possible pullback from hear also.

btc_long_1nighthi
please trade with your strategy
follow winner traders not me.
thanks
inter: 100,000
target:102,000
stop loss: 98000

BTC/USDT Trend Break Analysis & Target 101000This BTC/USDT 1-hour chart shows price moving within a downtrend, breaking below multiple trendlines. A key support zone around 97,800 is holding the price, while a resistance zone near 101,000 is highlighted as the next target. The chart also marks an FVG (Fair Value Gap) and two breakouts from the trendline. Current price action suggests a possible bullish move toward the 101,000 target zone if support continues to hold.

BTC upside ideaI expect at least a 50% pullback at some point in both the bullish and bearish cases.
My plan is to find an entry on the 3-15min timeframe and go break-even once a clear higher high prints.
I’m not claiming to be an expert — just sharing my perspective.
Trade safe and use proper risk management .

Análise BTC 13/11Okay my friends, two targets set, 1st at 155k, and second at 177k. I believe in the 2nd target at 177k. Let's go for it.
We can't miss the bottom of this widening, otherwise we'll be aiming for the 85-89k region.
Let's go for it!

ESTUDO BTC 13/11Okay my friends, two targets set, I believe in the 2nd target at 176k. Let's go for it.
We can't miss the bottom of this widening.
Let's go!
