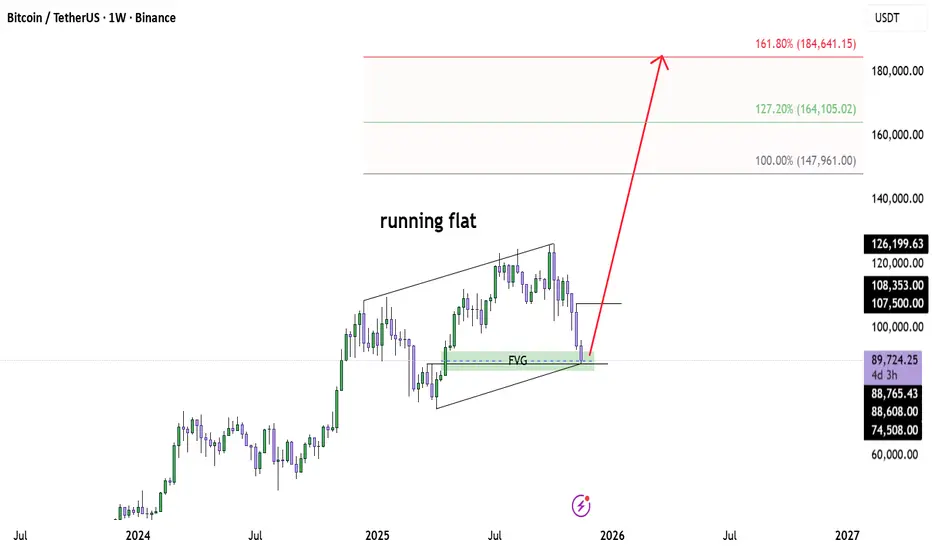
Bitcoin Macro Support Hit — Bull Cycle Ready to ExtendBINANCE:BTCUSD BINANCE:BTCUSDT
Bitcoin just tapped the weekly FVG + channel support, completing what looks like a running flat correction.
This zone has acted as a major demand area, and price reacted exactly where a higher-timeframe Wave 2 should finalise.
As long as BTC holds above this green support block, the bullish macro structure stays intact.
Upside targets for the next impulsive leg are:
147,961 (1.0 extension)
164,105 (1.27 extension)
184,641 (1.618 extension)
If this running flat is confirmed, Bitcoin may be entering a large Wave 3 — historically the most explosive phase.
Still watching weekly close for validation, but momentum is shifting.
⚠️ Disclaimer
This analysis reflects my personal view based on market structure and Elliott Wave principles.
It is not financial advice.
Always do your own research and manage your risk — the market doesn’t forgive careless entries.
Trade ideas
I will buy BTC nowBitcoin is currently testing a major weekly support zone which forms the first strong buy area (Buy 1).
If this support is broken, a second strong buy zone (Buy 2).
A lower-probability scenario is a deeper correction toward (Buy 3), which is a major long-term support.
Summary:
Bitcoin is currently in a strong buying zone on weekly support, with medium-term upside targets extending toward 150,000$ and possibly 200,000$ and more to 1M (Why not)

BTC/USDTPERP BinanceBTC/USDTPERP Binance
1D hollows
As we saw in a previous chart, since the price broke the support point of approximately $108,000, a price drop of 12.58% followed in a period of three days.
An uptrend diagonal line has formed on the chart.
The price should have stayed above this uptrend line.
So since it broke downwards, the price should then touch the support level as seen from $87,470 - $91,781.
The support area results as an extension of the Fibonacci retracement, to the exact point of the golden ratio, which is 0.618 and 0.666.
The price is expected to reach the support area and we will see a price rebound.
Crypto Market Cap: $3.26T +1.61%(24h)
Bitcoin Dominance
Bitcoin: 58.7% -0.15%
Ethereum: 11.9% -0.97%
Others: 29.4% +1.13%
Good Luck
#CryptoHellas Team
16/11/2025

The key is whether support can be found around 89294.25
Hello, fellow traders!
Follow us to get the latest information quickly.
Have a great day.
-------------------------------------
(BTCUSDT 1D chart)
This period of volatility is expected to last until November 22nd.
If the price fails to find support and rise near the M-Siganl indicator on the 1M chart after this period of volatility, it is likely to decline to the 69,000-73,499.86 level.
Therefore, the key question is whether it can find support and rise near the HA-Low indicator level of 89,294.25 on the 1D chart.
-
(1M chart)
It is showing a downward trend, failing to reach the Fibonacci ratio 2.618 (133,889.92), which was considered the target level.
However, if the price maintains above the 69,000.0-73,499.86 level, it is expected to maintain an upward trend in the long term.
-
(1W Chart)
If the price rises above the HA-High indicator, it is likely to form a stepwise uptrend.
Since a stepwise uptrend usually ends in a decline, this decline could be a sign of a bearish trend.
The M-Signal indicator on the 1M chart can be used as a benchmark for bullish and bearish trends.
Therefore, if the price remains below the M-Signal indicator on the 1M chart, it should be considered a bearish trend and a response should be considered.
However, considering the overall trend of BTC, the most important range is the 69,000-73,499.86 range. As long as it does not fall below this range, the price is expected to maintain an upward trend in the long term.
-
Thank you for reading to the end.
I wish you successful trading.
--------------------------------------------------
- This is an explanation of the big picture.
(3-year bull market, 1-year bear market pattern)
I will explain in more detail when the bear market begins.
------------------------------------------------------

BITCOIN – THE TIDES ARE TURNING Traders,
On November 5 I mapped out a scenario where Bitcoin would push into 107k to 108k and then decline to 98k first and 89k second.
This entire scenario has now played out perfectly to the pixel. We swept 108k, we dumped to 98k, and then we flushed into 89k. Where I expected price to retrace from exactly this level: $88.912
So the real question now is simple. What now? Do we break lower, or do we go up?
Let’s break Bitcoin down cleanly, without bias, and only by reading structure, levels, and order flow.
Levels, Structure and Order Flow
AVWAP at the core of the structure
Bitcoin is currently trading right near the AVWAP from the 06 August 24 anchor. This is the blue line on your chart and the exact level is 90.881. This anchor began with a large volume impulse.
When heavy volume kicks off a leg, the AVWAP from that point becomes a core reference level for the entire future auction. We are now sitting right on top of it, which is exactly where you would expect absorption or a strong reaction.
The market is basically deciding if this AVWAP will hold or break.
AB=CD completion
The full AB=CD measured move has completed exactly into the AVWAP zone. This is a clean harmonic completion and adds confluence to why price reacted here. AB=CD means the downside leg is symmetrical and usually marks exhaustion inside a trend.
Fixed Range Volume Profile
Using a FRVP from the start of the current HTF auction (07 April until now), we see price wicked directly into the LVN that sits inside the weekly FVG. This area had imbalance and low participation. A wick into an LVN inside an FVG often means that the inefficiency is now cleaned and the auction has reached completion for that side of the range.
Wedge breakout
Bitcoin technically broke out of the falling wedge, but the breakout does not look clean.
We are outside the wedge, but momentum on the breakout is weak. True confirmation would come if price re-enters the wedge from the outside and climbs back through the wedge body.
Re-entering the wedge tells you that the breakdown was liquidity and not a structural continuation. If we reclaim it, upside targets become more likely.
Order Flow – What the data shows
Spot and Futures CVD
Across the 15m, 30m and 1h charts, Spot CVD is forming a bullish divergence. Price keeps making lower lows, but Spot CVD is holding higher. This shows that spot buyers are stepping in at the lows and absorbing sell pressure.
Futures CVD on both stablecoin margined and coin margined contracts continues to push lower.
Price is not following these lower lows. This creates hidden bullish divergence and confirms that aggressive sellers are hitting the market while limit buyers are absorbing the pressure.
This is a classic sign of absorption. Selling continues, but the market is refusing to break lower with the same intensity.
Open Interest – A shift
Earlier in the dump, Open Interest was falling. This means positions were being closed.
Most of this was shorts taking profit or exiting the move. When OI drops during a downtrend, continuation becomes harder because the move loses fuel.
Near the end of the screenshots, there is a shift. Both stablecoin margined and coin margined OI start to rise again.
This rise in OI happens while:
CVD continues to make lower lows
Price stops making new lows
Price begins to stabilize
This tells us that new positions are being opened at the lows. Given the CVD behavior, most of these are new shorts entering the market.
When new shorts enter and price does not break, the probability of those shorts becoming trapped increases. If buyers step in, this setup often leads to a short squeeze.
This is how reversals form in a controlled market.
Funding rate – Binance
Funding is positive but very small. This means there is no extreme long pressure. There is no overcrowding on the long side. The market is not stretched. With fresh shorts entering at the lows and funding staying neutral, the market can turn quickly if support holds.
What this means
The combination of:
Spot CVD divergence
Hidden bullish divergence on futures CVD
Rising Open Interest at the lows
Neutral funding
Price refusing to break down - So price needs to hold.
shows that the market is absorbing aggressive selling at a key level. If buyers defend the current level, this can force newly opened shorts to cover, which would fuel the next move up.
Targets
109k
This is the first upside objective.
There is a CME ETH gap resting at this level and gaps of this type tend to get filled.
109k also aligns with the 1.113 Fibonacci extension of the latest wave.
This makes it the first logical level if price continues to hold the AVWAP and absorb selling pressure.
112k
The next major level is 112k.
This area contains single prints on CME and matches an AVWAP level on the BTC CME chart.
112k also lines up with the 1.272 extension of the wave.
From a Fibonacci rotation perspective, 1.272 is the next stop after 1.113 and often acts as a mid-cycle continuation target.
118.800
The final target sits at 118.800.
This is the full 1.618 extension of the wave and mathematically completes the auction.
If the market rotates from AVWAP support, this level becomes the natural endpoint of the move.
As long as price continues to hold the AVWAP at 90.881 and the market keeps absorbing futures selling, all three upside targets remain in play.
Invalidation
The structure changes only if price breaks below 88k. A clean drop under 88k opens the door for the next major high timeframe support at 85k.
85k carries strong confluence. It aligns with the 0.786 Fibonacci retracement on the HTF move and sits directly on a Point of Control zone within the Fixed Range Volume Profile.
Below that level, the auction shifts into a lower structure entirely.
TLDR
Bitcoin completed the downside scenario perfectly.
Price is now sitting directly on the AVWAP at 90.881.
AB=CD is complete.
LVN inside weekly FVG has been cleaned.
Futures CVD is still pressing lower but price is not. That is absorption.
But the key update is OI. OI was dropping earlier on the LTF, but now OI is rising again, and this is happening while CVD continues down and price holds steady.
That means new shorts are entering the market and getting absorbed.
If AVWAP holds, expect a bounce.
Targets:
109k
112k
118.8k
If 88k breaks, 85k is next.
--------
Abbreviation List
AVWAP
Anchored Volume Weighted Average Price. A dynamic support or resistance level based on volume since a chosen anchor.
AB=CD
A harmonic measured move where AB equals CD.
FRVP
Fixed Range Volume Profile. Shows where volume was traded inside a chosen range.
LVN
Low Volume Node. A low interest level where price often rejects strongly.
FVG
Fair Value Gap. An imbalance left by aggressive price moves.
CVD
Cumulative Volume Delta. Tracks buying vs selling pressure.
OI
Open Interest. The amount of open futures positions.
POC
Point of Control. Level with the highest traded volume.
--------
If you like this kind of analysis, drop a like and leave a comment. Everything here is shared for free so more people can cut through the noise and finally see what is actually happening under the surface. No hopium. No fear. Just real data, real structure, and real order flow.
The goal is simple. To help traders stop guessing and start understanding what the market is actually saying.
Stay sharp.
Stay objective.
And remember… the chart whispers long before it speaks.
- ThetaNomad


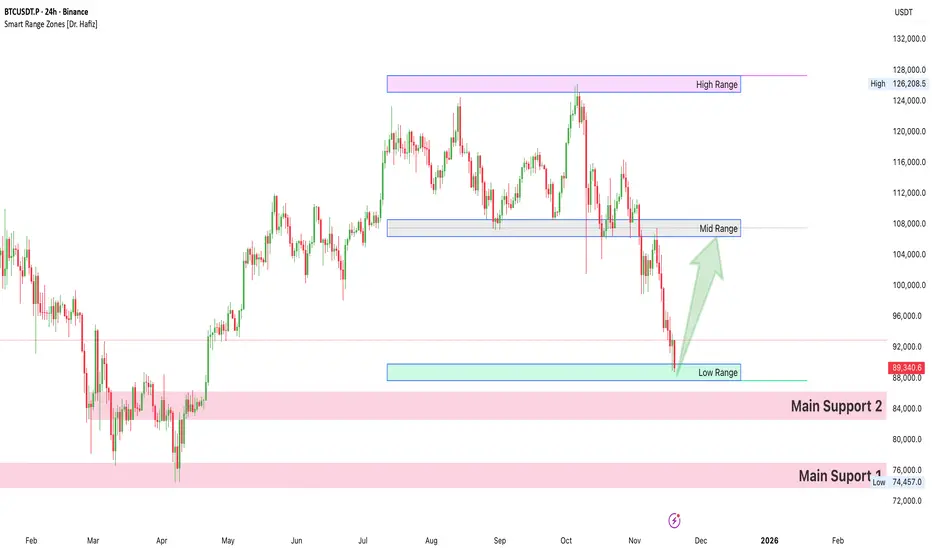
Bitcoin (BTC) – What Comes After the Sharp Drop?
A Technical Outlook Based on Smart Range Zones
🟦 Introduction
After a strong bearish move, Bitcoin has reached a critical juncture. The recent sell-off has driven BTC directly into the Low Range Zone , an area that historically generates strong reactions and often initiates relief rallies.
The market is now positioned between major higher-timeframe supports and mid-range resistance, making this an important decision point for BTC’s next major direction.
The attached Smart Range Zones chart shows precise High–Mid–Low ranges , plus two deep Main Support Zones, which together build a clear market structure roadmap.
🔍 Detailed Technical Analysis
1. Range-Based Market Structure
Smart Range System has clearly mapped the following key areas:
🔵 High Range Zone (≈ $124,000 – $128,000)
* Represents the upper distribution area.
* Strong supply; previous sell-offs originated from here.
* Bullish momentum must reclaim this zone for any attempt at new ATHs.
🟦 Mid Range Zone (≈ $104,000 – $110,000)
* Former support, now broken strongly.
* Likely to act as major resistance on any relief move.
* A textbook retest zone where trend continuation (bearish) often happens.
🟩 Low Range Zone (≈ $88,000 – $92,000)
* BTC is currently reacting inside this zone.
* Historically, this zone produced the largest bounce in July/August.
* If buyers defend here, a retracement towards Mid Range becomes highly probable.
2. Higher-Timeframe Support Blocks
Below the Low Range, your chart highlights two powerful demand areas:
🟥 Main Support 1 (≈ $74,500 – $76,000)
* Major untested zone.
* If reached, this would likely produce a l arge higher-timeframe bounce .
🟥 Main Support 2 (≈ $82,000 – $86,000)
* First deep HTF support block.
* Lines up with multiple historical volume clusters.
* Ideal for long-term spot accumulation.
If BTC breaks the Low Range cleanly, these supports become the next logical liquidity targets.
3. Price Action & Candle Behavior
* Long downward wicks inside the Low Range show buyer absorption .
* Momentum is slowing down, suggesting sellers are losing dominance.
* Strong, impulsive candles earlier indicate panic liquidation likely cooled off.
4. Market Sentiment & Liquidity
* The decline aligns with high-leverage liquidations.
* Fear index likely elevated, which historically aligns with bottom-zone entries.
* BTC dominance stable: no major altcoin rotation yet.
* Macro news still cautious but not aggressively bearish.
Sentiment currently favors a t echnical bounce rather than a full trend reversal.
📈 Potential Scenarios for BTC’s Next Move
🟢 Scenario 1: Relief Rally Towards Mid Range (Most Probable)
* BTC holds the Low Range (88k–92k).
* Short-sellers take profit → push price up.
* A bounce to 103k–110k (Mid Range) is likely.
* Here, BTC will face major resistance.
Key Level to Break for Bullish Continuation:
👉 **$110,000**
🔵 Scenario 2: Consolidation in Low Range (Neutral)
BTC may:
* Move sideways between 88k–95k
* Build a base for a stronger directional move
* This is typical after sharp drops
A consolidation would be healthy and would prepare liquidity for the next impulse.
🔴 Scenario 3: Breakdown Toward Main Supports (Bearish Extension)
If buyers fail to defend the Low Range:
First Target
👉 Main Support 2 (82k–86k)
Second Target (Max Pain Zone)
👉 Main Support 1 (74k–76k)
A drop this deep would require:
* Macro panic
* Major liquidation cascade
* Loss of current structural support
🎯 Summary
* BTC has entered the Low Range Support Zone , a historically strong reaction area.
* A bounce toward Mid Range (98–102k) is currently the highest-probability scenario.
* Failure to hold this zone opens deeper targets at 86k and 76k.
* Traders should monitor the Low Range for confirmation signals.
BTC critical !!!! Daily chartSo previous setup played out unfortunately to the downside ,we are in a critical stage for BTC, Currently pricing at
$89 000.00 at time of analysis so we hope for a bounce upwards and at least a close on the weekly above the $92 000-$94 000.00 if we can not do that I suspect more downside. Please leave comments and share ideas.
Good luck to everyone.

Bitcoin Elliot Wave Correction : 40K Bitcoin completes it’s Elliot wave pattern with 24K marking the top of this cycle .
85K likely the bottom for this first wave down with a relief rally expected to 113K .
From there 42K is the next possible support for the second wave down. Saylor is in trouble.

BTCUSDT.P - November 20, 2025The chart shows a clear downtrend marked by descending highs and lows, with price currently heading near a key horizontal support around the 88,000 level. A descending trendline acts as overhead resistance, while the shaded area near 92,000 represents a notable resistance zone. Price action suggests two possible outcomes: a bearish breakdown below support could extend the decline toward 85,000, while a successful breakout above the trendline may trigger a reversal toward 92,000 resistance. Momentum currently favors the bears as the market retests support after sustained selling pressure.

$BTC Correction 3 in Progress – Exactly on Script!KUCOIN:BTCUSDT CRYPTOCAP:BTC Correction 3 in Progress – Exactly on Script! 📉🚨
Altcoin Pioneers! ⚡ Bitcoin is following the historical fractal to the dot:
- Correction 1: -34% ✅
- Correction 2: -32% ✅
- Correction 3: currently -29.5% and counting (price ~89,130)
We’re now deep into the scariest phase of every bull market – the one that shakes out weak hands before the real parabolic run. This weekly candle is testing the 0.618 Fib + previous cycle highs zone (~84–88k).
What happens next:
- Hold 84k → final capitulation wick → explosive markup to 150k+
- Lose 84k decisively → extended correction toward 70–74k (less likely)
Indicators: Weekly RSI at 58 (still healthy), no bearish divergence yet, volume rising on panic = perfect washout setup.
Bias: This is the ultimate buy-the-fear moment as long as we stay above 84k. History says the biggest gains come right after Correction 3. Stay strong! 🐂💎
#Bitcoin #BTCFractal #BullMarket

BITCOIN Short term view What do you think guys about this trade...we are going to capture 3000 pips....A one hour strong bullish candle is confirmation....

BTC - Another (Drastic) Possibility For those who have been following my bitcoin short ideas, another possibility in this movement that I urge you NOT TO DISCREDIT so easily:
We see a flash crash / wick beginning from 89,000-89,500 region - and we drop straight to sub 10,000
My expected bottom of this wick is precisely 7,250
Now why would this happen, or be possible?
DXY is breaking down a major multi year bearish structure. This means the US dollar will fall in value over the next years, and lead to one of the largest bull markets we’ve ever witnessed on stocks, equities, and securities.
Bitcoin has been steadily rising and collecting not only long position stop loss orders, but liquidation orders for all the leveraged buys (including Microstrategy).
This leaves a massive chain reaction of sell orders ready to trigger off, one into the next, below price.
As price falls, more liquidity is removed and more sell orders are filled - this equals a drop at incredible speed that does not stop until there are no more orders.
So while I have been urging a 3 way corrective drop as such:
89,500 to 34,800
34,800 to 61,000-63,000
61,000 to 8,000
It’s entirely possible we see the following:
89,500 to 8,000
Happy trading,
- DD

BTC short TermDear Traders,
i expect to reach 119,200 it can go more up little bit but a second dump can be cooking
im publishing this idea bcz a lot of ppl lost money and most of you follow the wrong ppl
market is green yes but fully manipulated


BTC – SMC Suite Follow-Up: Liquidity Grab at 116K and the Drop!!BTC – SMC Suite Follow-Up: Liquidity Grab at 116K and the Drop That Followed
This is a follow-up to my earlier idea “ BTC – Liquidity Grab at $116K Before Deep Correction? ” where I highlighted the danger of price trading into stacked SMC levels on the 1D chart.
1️⃣ Quick recap of the original idea
In the previous post, price was trading around the $112K–$116K zone.
Using the SMC Suite on the 1D chart, I highlighted:
• A high-timeframe supply / OB cluster around 116K.
• A liquidity grab above prior highs – price spiked into fresh liquidity sitting above the range.
• A confluence of Breaker + OB Re-test + FVG acting as a “danger zone” for fresh longs.
• The idea that this move could be a distribution / liquidity grab before a deeper correction.
The key message was: this is not a safe place to be aggressive long; watch for rejection and potential downside.
2️⃣ How price reacted afterwards
Since that post:
• Price respected the 116K zone as supply – every attempt to hold above it failed.
• The highlighted OB + Breaker block acted as a ceiling; price consolidated there and then rolled over.
• After losing the mid-range structure, BTC started a trend of lower highs and lower lows , confirming distribution.
• We have now traded all the way down into the d emand / support zones below 92K and then lower , which were also plotted in advance by the same SMC levels.
In simple terms, the area we marked as a “ danger zone for longs ” turned out to be the top of the move before this large downside leg.
3️⃣ What the SMC levels showed well
This move is a nice case study of how the SMC concepts aligned:
• Liquidity Sweep : Price ran above previous highs into fresh liquidity, then failed to hold.
• Breaker + OB Re-test : Former demand became supply; retest of this breaker block rejected price.
• FVG + Imbalance Zones : Upside imbalances got filled and then flipped into resistance.
• Structure Shift : After the rejection, market structure shifted bearish with clean breaks of prior swing lows.
None of this is about “perfect prediction”, but about reading where smart money might be offloading risk and where retail is most vulnerable.
4️⃣ Takeaways & what I’m watching next
• HTF SMC levels matter. When multiple concepts cluster (Breaker, OB, FVG, previous highs), treat that zone with respect.
• Liquidity grabs at highs are great warning signals – especially when followed by a clear structure shift.
• For now, I’m watching how price behaves around the current demand zones and whether we see:
• Strong rejection + reclaim of broken levels (potential swing-long areas), or
• Continuation of lower highs pointing to further downside.
This post is for educational purposes only, not financial advice.
Bitcoin - Relief rally is imminent!Introduction
Bitcoin (BTC) has shown strong downward pressure over the past several days, yet it is beginning to display early signs of stabilization within key higher-timeframe fair value gap zones. Even though the current market structure remains bearish, several technical elements are aligning that suggest the potential for a relief rally. With multiple patterns and liquidity levels converging, the market may be preparing for a temporary upside correction before determining its next major direction.
Weekly FVG
On the weekly timeframe, BTC recently tapped into the weekly fair value gap and filled roughly fifty percent of this imbalance. This partial fill often indicates that the market is collecting liquidity before initiating a larger move. As a result, this weekly FVG acts as a strong demand zone where buyers tend to become active again, offering an area where price often stabilizes, even if only temporarily. The reaction here suggests that BTC may be forming a short-term base.
Daily FVG
On the daily timeframe, another fair value gap is present, and it aligns almost perfectly with the weekly zone. Above current price action lies a clear descending trendline, which is likely to act as resistance on any upward push. The combination of the daily FVG and the downward trendline creates a technically significant decision point. If BTC reaches this area, it may face renewed selling pressure, making this zone crucial for determining whether the market can extend higher or whether the downtrend will reassert itself.
4H Timeframe
On the 4-hour chart, BTC has formed a falling wedge, a pattern that is typically considered bullish. Initially, price broke downward out of the wedge, which seemed like a continuation of weakness. However, BTC quickly moved back into the structure, signaling a fake-out. This type of movement often occurs when liquidity is collected beneath the pattern before a reversal begins. The return into the wedge strengthens the case for a short-term upward correction, suggesting that buyers may be gaining traction.
Relief Rally
The first zone to watch lies just above the current price level, where a 4-hour bearish FVG overlaps with the descending trendline. This confluence is likely to act as immediate resistance, making an initial rejection from this level highly plausible. After a potential rejection, price may revisit the bullish 4-hour FVG below, where buyers are expected to step in again. From this supportive zone, BTC could attempt to break through the descending trendline and continue higher toward the upper 4-hour bearish FVG around the 98,000-dollar region. This serves as a logical target for a relief rally, should momentum continue to build.
Conclusion
BTC is currently positioned within an important higher-timeframe demand zone, strengthened by the overlap of both the weekly and daily FVGs. Although the broader market structure remains bearish, the fake-out within the falling wedge on the 4-hour chart signals that a relief rally may be developing. The immediate resistance above price will provide the first major test. If Bitcoin finds renewed momentum from the bullish 4-hour FVG and successfully breaks the descending trendline, an upward move toward 98,000 dollars becomes increasingly realistic. For now, BTC appears to be setting the stage for a corrective bounce, with key levels offering clear guidance on how this scenario could unfold.

Bitcoin last chance before the market bull season endThe market is at a critical technical juncture. A decisive breakdown and sustained close below the $90,000 support zone would signal a confirmed shift into a sustained bearish cycle. In such a scenario, the next significant structural support is projected near the $60,000 level, representing a potential depreciation of over 30% from current levels.
Conversely, this level also presents a pivotal opportunity for the bulls to defend the market structure. A strong rejection and consolidation above $90,000, forming a robust base, would be the first step towards stabilization. Following this, a recovery and sustained break above $110,000 would be required to invalidate the bearish outlook and signal the probable start of a new bull phase.
DISCLAIMER: ((trade based on your own decision))
<<press like👍 if you enjoy💚

TradeCityPro | Bitcoin Daily Analysis #225👋 Welcome to TradeCity Pro!
Let’s jump into today’s Bitcoin analysis. After the pullback to 93,555, Bitcoin has moved into a ranging phase.
⌛️ 1-Hour Timeframe
Yesterday, after reaching its support zone, Bitcoin made a corrective upward move and pulled back to 93,555.
💡 Right now, after completing that pullback, the price has dropped back down to 90,489 and has shown a reaction to this level.
✔️ As you can see, selling volume has been increasing during this move, and we haven’t seen any significant buying volume enter the market yet.
✨ Today’s trigger for opening a position is the break of 90,489.This is a suitable trigger for a short position, and breaking it could be the start of the next bearish leg.
⭐ If the move toward 90,489 comes with increasing volume, we can even enter earlier using a candle setup, before the full break happens.
📊 For a long position, it’s still too early.We first need to see the price stabilize above 93,555, and only then we can look for long triggers.
❌ Disclaimer ❌
Trading futures is highly risky and dangerous. If you're not an expert, these triggers may not be suitable for you. You should first learn risk and capital management. You can also use the educational content from this channel.
Finally, these triggers reflect my personal opinions on price action, and the market may move completely against this analysis. So, do your own research before opening any position.

BTC DAILY KEY LEVEL APPROACHING BTC has been on a down trend for a while now and is currently approaching a daily demand zone which is the zone that caused the break of structure of the previous high on the daily time frame. So let wait for price to Tap into the zone and see if buyers will eventually kick in or probably break below it to continue the downtrend. Let wait for clear confirmation.
BTC - Short Update - Next Expected MovesBitcoin “Ultimate Swing Short” has been playing out beautifully from our upper entry of 121,500.
Here are updated details of expected path from here:
SHORT - 91,500 Entry - Target of 35,500
LONG - 34,700 to 35,200 Entry - Target of 62,000
SHORT - 63,000 to 63,900 Entry - Target of 10,000
BUY - 7,600 to 9,000
Here is a list of the take profit targets not yet hit for those holding the short:
1) 87,400
2) 67,900
3) 43,800
4) 21,600
5) 10,100
Expect these last moves to be very fast, best to plan ahead and be prepared.
Much love and happy trading.
- DD

Bitcoin long term view Almost 70million Bitcoin bought in just 5 months and that's why we saw a huge rally....now it's time to sell...it will reach below level
