BTC: (BTCUSDT) Current Update Today.Hi everyone,
Lets take a view on BTCUSDT. lately the price has been scaling up deliberately, trending in momentum region of highs and lows. there is fair prospect of it heading toward $116K, as next partial high and resistance as we can notice in the structure.
In addition the price might break above $116K and continue rising gradually.
Meanwhile a firm reversal below our target would activate a short down to the next lows.
Happy weekend
Thanks for reading.
Trade ideas

Big Short is Ready BTC to 93000 USDTAs you can see, if the order block breaks down to the yellow area of 109,000, I expect to short Bitcoin to the area of 93,000 to 90,000. This is a big short. Be careful with your capital.
This is not investment advice. Check it out for yourself. Also observe risk and capital management. Thank you for your attention.

$BTC Long or Short?Since the Oct 10 nuke from $120K → $101K, Bitcoin has been trapped in a distributional range. First wide range formed $115K → $103.45K, then compressed tighter over the last 2 weeks into $114K → $106K.
We’re now trading around $110.7K, sitting in premium but below the previous $112K high — which is a critical decision level.
• Fail to clear $112K → locked lower-high → momentum confirms exhaustion → expect a drive back into $108K → $106K demand
• Decisive reclaim + acceptance above $112K → we sweep $113–114K supply, with potential extension into $116–117K liquidity
This is the exact point where the next leg reveals intent — continuation or rejection.
I’m watching how price evolves here to position aggressively on either the next short or long.

BTC Intraday Trap? Price Spikes, Volume Stalls
🕵️♂️ Observation:
- Price made a sharp spike upward, grabbing attention.
- But behind the scenes, volume told a different story—slow, hesitant, and lacking buyer aggression.
- CVD showed no real pressure from buyers; AO momentum faded quickly after the spike.
- This looks like a classic liquidity grab or engineered move to trap breakout traders.
- No follow-through from buyers = no conviction.
- Price structure remains vulnerable, especially near supply zones or previous POC.

BITCOIN BTCUSDTBitcoin is a decentralized digital currency and the first cryptocurrency, created in 2009 by an anonymous entity known as Satoshi Nakamoto. It operates on a peer-to-peer network using blockchain technology, which is a public ledger that records all transactions securely and transparently without the need for a central authority.
Key Features of Bitcoin
Decentralization: No central bank or government controls Bitcoin, making it resistant to censorship and centralized manipulation.
Limited Supply: Total supply is capped at 21 million bitcoins, which introduces scarcity and potential value appreciation over time.
Pseudonymity: Transactions are publicly recorded but can be conducted without revealing personal identities directly.
Security: Uses cryptographic proof and consensus mechanisms (Proof of Work) to secure transactions and prevent double-spending.
Divisibility: One bitcoin can be divided into 100 million smaller units called satoshis for microtransactions.
Use Cases
Store of Value: Often referred to as "digital gold," Bitcoin serves as a hedge against inflation and currency devaluation for many investors.
Medium of Exchange: Used for peer-to-peer payments, remittances, and merchants accepting it for goods and services.
Investment: Trading and holding Bitcoin as an asset for speculative gains or portfolio diversification.
Financial Inclusion: Provides access to financial services for the unbanked and underbanked populations.
Market Overview 2025
Bitcoin continues to hold the largest market capitalization among cryptocurrencies.
It experiences significant price volatility but has shown resilience through macroeconomic uncertainties.
Regulatory frameworks around Bitcoin vary globally, impacting adoption and market dynamics.
Increased institutional adoption, development of Bitcoin ETFs, and integration with traditional finance continue shaping its ecosystem.
TECHNICAL INFORMATION AND TRADING BIAS.
(1) on daily time frame the structure has formed a double bottom a bullish price action ,if you look critically from Friday 17th October 2025 to Thursday 23rd 2025 we have a clear double bottom on daily and if the chart pattern break out of 110k-111k on daily ,it would have broken the neckline and also breakout of the 4hr descending trendline ,if we have this as a new case scenario then we will be looking for buy confirmation by the close of the weekly candle.
(2) if we get a weekly rejection below 110-111k then the double bottom neckline failed and we wont be considering that chart pattern as a bullish price action .the nest thing to do is to allow our daily support to be broken the look for sell opportunity
key watch list 103,408k
key watch list will be 94,022-93500k
key watch list will be 56k-55k on the descending trendline connecting and providing liquidity in the past.

BITCOIN BTCUSDT THE STRUCTURE OF BITCOIN IS STILL BEEN WATCHED, the right direction will hinge on the weekly candle close, buyers are holding a small demand floor at 103,400 which is not strong enough after the break of a demand floor from 107k level
if the weekly candle closes without buy momentum we will look for more bearish correction on 15min.
on technical bitcoin structure suggest more drop in price and am hoping that 94k-95k -finds the impulse/
on daily time frame the ascending trendline will be watched because its acting as dynamic resistance to downswing.

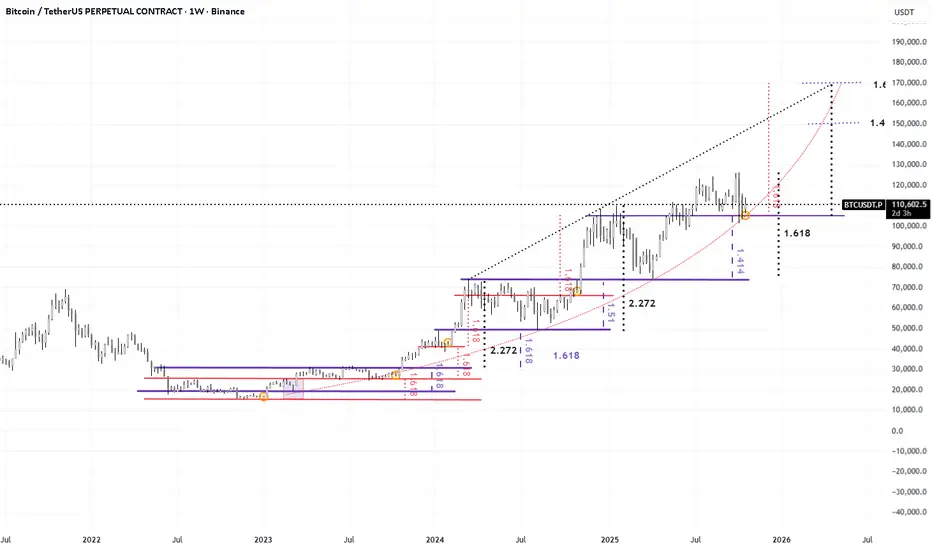
Bitcoin - How the cycle end's going to go down This idea examines the Fib relationships that have already played out this cycle, combined with the 1.618 curve obviously in motion to arrive at a likely cycle top.
The most likely cycle top is in the vicinity of $170k, I give this idea a 50% chance of playing out. the path to 170k likely involves a correction around $150k and drop to meet the rising 1.618 curve - somewhere around $138k. The final blow-off would then reach $170k
The 2nd most likely possibility is a top at $150k and an extended distribution there with no blow-off top of significance. I give this idea a 25% chance of playing out.
The 3rd possibility, which cannot yet be invalidated despite all the macro evidence being to the contrary, is that we are topping and in full distribution in the $105k-$125k range. This chart shows some confluence for that idea, and of course it aligns with 4-year cycle theory and eclipses - and so I will give it also a 25% chance of playing out.
That said - whilst we are clearly distributing, with OG whales selling enthusiastically, I do not believe this is THE distribution. Rather I believe it to be a transfer from OG whales fixed to the 4-year cycle ideology to smart(er) money, predominately TradFi.
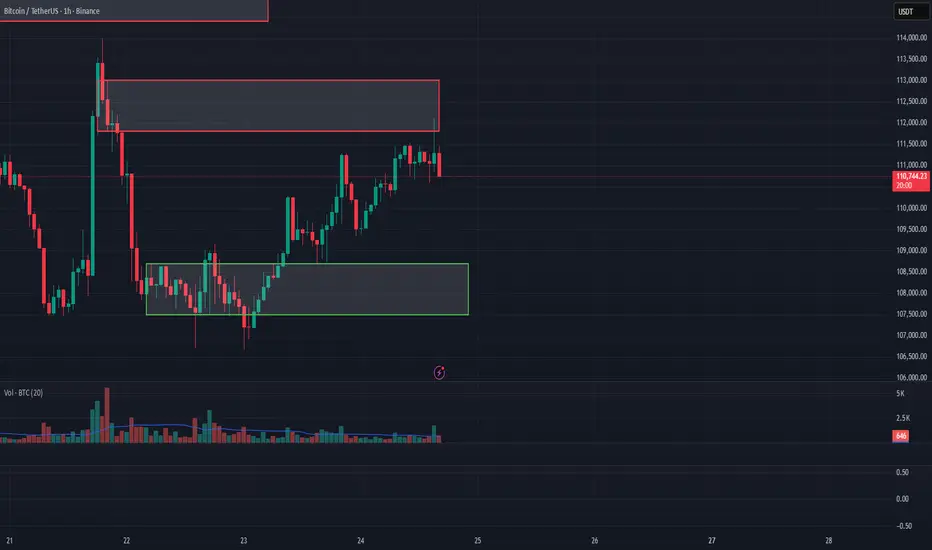
Bitcoin playing games at critical levelsBTC is clearly causing the market to capitulate over time. Price capitulation has already been achieved for the most part. The current sideways chop causes many traders to lose focus and exhaust their patience. This is what the market wants. There are some good signs of support at the current H1 structure, but let your guard down, this PA is CRAZY.

“Bitcoin is consolidating after a strong recovery from the deman “Bitcoin is consolidating after a strong recovery from the demand zone around 108,800. The orange circle highlights a clean higher low, confirming buyers’ control. Right now, price is holding above the 50% Fibonacci retracement and testing the 61.8% level near 111,200. If bulls manage to break and close above this yellow resistance zone, the next target sits around 112,400 — the 78.6% Fibonacci level.

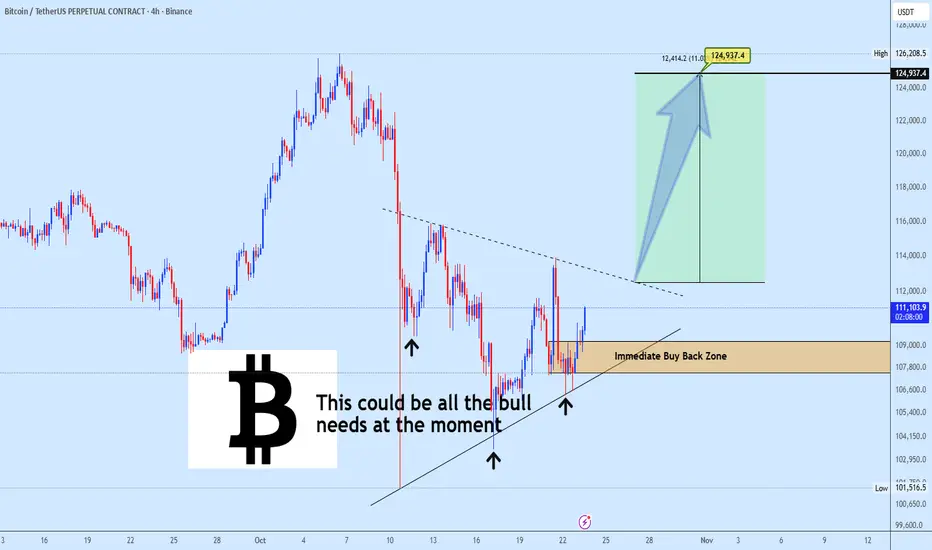
BITCOIN Update: ISHS Setup in Play! Bitcoin continues to respect the ascending structure with a potential Inverse Head & Shoulders forming along the Immediate Buy Back Zone (107k–109k).
The current bounce aligns perfectly with the neckline projection towards $124,937, which also sits near the previous resistance zone.
As long as price holds above the short-term trendline, bullish continuation remains valid. Any rejection around $113k may still retest the zone before the next impulsive leg.
📈 This could be all the bulls need at the moment.
Share what you think about this short play.
Btcusdt Easily 90k by December i think the bull market is over Macd looks bad on the weekly in the monthly btc can’t even get above 115k no one is buying at this levels but Micro strategy i think btc looses this support and falls in the coming months

POTENTIAL HEAD AND SHOULDER BEARISH PATTERNTrendline: There’s a descending resistance connecting the recent lower highs.
Measured target (1.618 Fib): ~99,800–101,500 USDT range.
RSI: Around 52 — neutral, but the RSI divergence indicator shows multiple bearish signals at local highs.
Trendline: There’s a descending resistance connecting the recent lower highs.
Measured target (1.618 Fib): ~99,800–101,500 USDT range.
RSI: Around 52 — neutral, but the RSI divergence indicator shows multiple bearish signals at local highs.
Key Technical Points
The right shoulder is forming just below the downtrend line → showing lower high confluence.
Volume is declining, typical before a breakout.
Neckline support is being tested multiple times — each bounce is weaker.
📉 My Bias: Bearish
Unless BTC breaks above 111K–112K with strong volume, this chart suggests:
A Head and Shoulders breakdown is likely.
Break below 104.5K confirms the pattern → possible target near 100K or 99.8K (1.618 Fib extension).
🧭 What to Watch
Bullish invalidation: Break and close above 112K → shifts bias to bullish continuation.
Bearish confirmation: 4H close below 104.5K neckline.

bitcoin preparing for a strong rally toward 140k$After a brief correction and consolidation near the 103000$ support zone, bitcoin appears to be preparing for a potential rally toward the 140,000$ target.
#btc #bitcoin

BITCOIN + ETH SIGNALS: MASSIVE MOVE INCOMING!!!(Nobody Watching)Yello Paradisers! Enjoy the video!
And Paradisers! Keep in mind to trade only with a proper professional trading strategy. Wait for confirmations. Play with tactics. This is the only way you can be long-term profitable.
Remember, don’t trade without confirmations. Wait for them before creating a trade. Be disciplined, patient, and emotionally controlled. Only trade the highest probability setups with the greatest risk to reward ratio. This will ensure that you become a long-term profitable professional trader.
Don't be a gambler. Don't try to get rich quick. Make sure that your trading is professionally based on proper strategies and trade tactics.

[SeoVereign] BITCOIN BEARISH Outlook – October 24, 2025Today, as of October 24th, I would like to share my bearish (short) outlook on Bitcoin.
Currently, after taking partial profits from the short position entered on October 21st, I am still holding the remaining portion.
A meaningful short entry zone has been identified on the chart today, and I am considering an additional entry.
If a downward move unfolds, I plan to scale into the position further based on this idea.
However, since part of the position has already been established and the new entry zone overlaps with the previous one,
I will proceed with caution, gradually adding to the position rather than entering aggressively.
The reasons for considering an additional short entry are as follows:
First Basis — FIBONACCI 0.886~1.13
Bitcoin is currently positioned within the 0.886–1.13 range relative to the upper structure.
This zone is generally interpreted as an overbought region, often marking the final extension of a prior upward wave.
Therefore, once the price enters this zone, selling pressure tends to increase,
which can signal a short-term correction or a potential trend reversal.
Second Basis — WAVE.M = WAVE.N × 0.786
In terms of wave structure, the ongoing arbitrary M wave
shows a ratio of approximately 0.786 relative to a previous arbitrary N wave.
This ratio frequently appears near turning points,
indicating that the momentum of the upward wave is gradually weakening.
Accordingly, the average target price is set around 108,347 USDT.
Depending on future price developments,
I will provide further updates regarding any changes to this idea
and my position management strategy.
Thank you for reading.

BTC/USDT Analysis. Testing a Key Support Point
Hello everyone! This is CryptoRobotics trader-analyst, and here’s your daily market review.
Yesterday, Bitcoin fully followed the scenario we outlined earlier. As selling pressure weakened, buyers stepped in, pushing the price toward the strong resistance area with major volume anomalies we mentioned before.
At the moment, expectations are tilted toward short positions — the first test of this zone has already shown a spike in volume followed by an immediate pullback. The buyer’s price action looks weaker, suggesting a higher probability of further decline.
The nearest target is support at $108,700–$107,500, while the main target remains the $105,600–$104,500 zone (volume anomalies).
Buy Zones:
$108,700–$107,500 (volume zone)
$105,600–$104,500 (volume anomalies)
$97,000–$93,000 (volume zone)
Sell Zones:
$111,800–$113,000 (strong volume anomalies)
$114,400–$115,600 (local volume zone)
$120,900–$124,000 (volume zone)
This publication is not financial advice.
Doji Candlestick: A Key to Market ReversalsAlright, let’s break down the Doji candlestick pattern.
If you're trading crypto, you've probably bumped into this little guy at some point. It’s not a wild trendsetter on its own, but it definitely has something to say about the market’s mood 🤔. The Doji is one of those candlestick patterns you’ll want to pay attention to if you're trying to catch reversals or just understand what's going on in the market.
What is the Doji Candlestick Pattern?
A Doji candlestick pattern forms when the opening and closing prices are almost identical. The body of the candle becomes tiny, while the shadows (the lines extending above and below the body) are long. It might look like a cross, plus sign, or even an “✖️.” The key point is that the market is indecisive, which is why this pattern gets so much attention.
🐂Bullish Doji Candlestick Pattern
So, what happens when you spot a Doji after a downtrend? You might be looking at a potential reversal, signaling that the bears are running out of steam. A bullish Doji candlestick pattern forms when the market closes near the opening price but after a steady downtrend. It’s like the bulls are just waiting for the right moment to step in. But don’t jump in too quickly! A single Doji doesn't mean the market's ready to flip. Look for confirmation in the following candles — ideally, a strong bullish candle that closes above the previous high.
🐻Bearish Doji Candlestick Pattern
Now, flip the script. If you see a bearish Doji candlestick pattern after a nice uptrend, it’s time to pay attention. This signals that the bulls might be running out of energy, and the bears could be gearing up for a push. It’s not an instant signal to sell, but it’s a red flag that the market’s strength is weakening. After spotting the Doji, wait for confirmation — usually in the form of a bearish candle that closes below the previous low.
How to Use the Doji Trading Pattern Effectively?
So you’ve spotted a Doji chart pattern. Now what? This pattern is all about context. If it shows up in the middle of a strong trend, it’s probably just a pause in the action — not a reversal. But, if it appears after a big rally or a significant drop, it could indicate that market sentiment is shifting.
Here’s the key: Confirmation is king. The Doji itself doesn’t tell you where the market is going. It only tells you that the market is uncertain. Look for the next few candles to see if they support a reversal — a bullish follow-up candle after a bearish Doji or a bearish candle after a bullish Doji.
🏁Final Thoughts
The Doji candlestick pattern can be a valuable addition to your trading strategy, offering insights into market sentiment when combined with other indicators. While it highlights moments of indecision, it's essential to exercise caution and not rely solely on a single signal. In trading, context, confirmation, and proper risk management are key. Remember, tools like the Doji are meant to inform your decisions, but ultimately, it's your judgment and strategy that will guide your moves. Happy trading!

BTCUSDT.P - October 24, 2025Based on the 15 minute chart for BTCUSDT, price is currently testing a rising trendline support around the $109,970 area after a slight pullback. A long bias suggests an entry near this support targeting the previous high near $111,750 as resistance. This is a high-risk setup.

BTCUSDT.P - October 24, 2025This indicator introduces a minimalist Buy/Sell signal methodology designed for clarity and power. The goal is to strip away all visual clutter—no trendlines, no Boxes, no FVGs—to focus solely on generating precise market directional signals.
It is specifically developed for stability and reliability on well-established major-cap cryptocurrencies (e.g., ETH, BTC). It is not intended for use with high-volatility, low-cap, or memecoins.
Observed Performance
The underlying logic has shown strong results on major pairs. A sample backtest on BTCUSDT.P demonstrated a focus on quality over quantity, yielding 4 clean trades over a 5-day period with a 100% win rate.
The methodology is currently for private study and application, serving as an example of how powerful, clean indicators can be developed for traders focused on large-cap stability.
This content is for educational and analytical purposes only and does not contain any promotional material, solicitation, or fundraising requests.

BTC accumulates and starts to recoverBitcoin (BTC/USD) – Daily Analysis
BTC continues to trade within a broad ascending channel, currently rebounding strongly from the key demand zone around 106,000–108,000. This zone has acted as a major liquidity area where buyers have repeatedly stepped in to defend price.
After forming a double rejection at the lower channel boundary, BTC has reclaimed the EMA 34 and is now attempting to stabilize above 110,000, signaling early bullish recovery momentum.
If buyers can maintain price action above 110,000, the next resistance levels to watch are:
113,000–114,000: confluence of EMA 89 + prior structure resistance.
126,000–127,000: upper trendline of the ascending channel and potential medium-term target.
Technical Outlook:
Price respected long-term ascending channel support.
EMAs show potential for a bullish crossover if momentum continues.
Higher low formation supports a recovery scenario.
Bullish Scenario:
Holding above 110,000 would confirm strength, with possible continuation toward 113,000 → 126,000.
Bearish Scenario:
Failure to hold 108,000 could trigger a deeper retracement toward 106,000 or even 102,000 (next demand zone).

TradeCityPro | Bitcoin Daily Analysis #205👋 Welcome to TradeCity Pro!
Let’s analyze Bitcoin today, as the market is making an upward move, so it's important to have a solid analysis to stay ahead of future movements.
⏳ 1-Hour Timeframe
Bitcoin's upward movement continues, and after yesterday's correction, the price is now moving upwards again toward the 111645 level.
This movement is accompanied by weak momentum, and the volume is decreasing, so opening a long position right now is a bit risky.
However, if 111645 breaks, we can open a long position with a very low risk. The break of this level will be our next trigger for a long position.
The main long trigger is 113429. Breaking this resistance can initiate the next upward movement for Bitcoin.
But the volume needs to increase. Any movement accompanied by decreasing volume is a strong sign of trend weakness and won’t last long.
If you already have a long position from 108943, you can take profits if the trend confirms and the price gets rejected at 111645.
For short positions, we should wait for the market structure to change and for a short trigger to appear.
❌ Disclaimer ❌
Trading futures is highly risky and dangerous. If you're not an expert, these triggers may not be suitable for you. You should first learn risk and capital management. You can also use the educational content from this channel.
Finally, these triggers reflect my personal opinions on price action, and the market may move completely against this analysis. So, do your own research before opening any position.

BTC to 116k?Let's see if btc cand hold this level. We have some form of compression here, and if we get the breakout, that should mean 116k is in play

$BTC might explode after the washout!CRYPTOCAP:BTC is once again reacting strongly from the lower channel support, similar to the previous green-circle bounces we’ve seen this year.
Each green circle has marked key accumulation points — followed by strong upside momentum.
Meanwhile, red circles highlight resistance rejections where profit-taking zones formed near the upper channel boundary.
🧭 Key Levels to Watch:
Support: $106.8K – $110.5K
Resistance: $120.1K – $123.5K
Trend: Holding firmly inside the rising channel
If CRYPTOCAP:BTC continues to respect the green zone, we could be looking at the early stages of another leg up toward the top of the channel.
But if support fails, expect a deeper retest of the lower structure.
Note:
History doesn’t repeat perfectly — but it rhymes. Stay calm, stay patient, and let the chart tell the story.
