BTCUSDT Short IdeaPrice has tapped into a supply zone and is showing rejection. The recent push upward looks like a liquidity grab rather than a genuine bullish move. Momentum is slowing, and structure is beginning to shift in favor of sellers.
If price continues to reject this zone, downside continuation is likely. Wait for a clear bearish confirmation candle or break in structure before entering to avoid early entries.
Trade ideas

Btc/Usdt - Trendline Break With Order Block RejectionBitcoin has tapped into a well-defined order block where buyers previously stepped in, and the market is showing a clear bullish reaction from that zone. After a prolonged move down under a descending resistance trendline, price has now broken above this trendline, suggesting a potential shift in short-term momentum from bearish to bullish.
The break of the trendline indicates that sellers are losing control, and buyers are starting to gain strength. If price holds above the breakout level and continues forming bullish structure, we could see a continuation toward the next liquidity area. The projected path points to a move toward the 103.8–104K target zone, where previous liquidity and fair-value areas may attract price.
Points to watch:
✅ Strong reaction from the order-block zone
✅ Trendline breakout confirming bullish pressure
✅ Potential higher lows forming to support an upward move
✅ Next target zone sits around 103.8–104K
As long as Bitcoin remains above the broken trendline and maintains bullish structure, upside continuation remains likely.
(Not financial advice.)

Only a few hours left until the BTC weekly close.Bitcoin must not close the candle below the 50-week moving average
in order to reach $107,000,
or unfortunately, the price may drop to the next resistance around $96,350.
The whole world is waiting.
This is technical analysis only and not investment advice.

Bitcoin | Long | 3 Hrs This technical analysis is for informational and educational purposes only. It does not constitute financial advice. Remember to always research and consult with a professional before making investment decisions. Good luck! 📈💼🚀

BTC/USD) Bearish trend analysis Read The captionSMC Trading point update
Technical analysis of BTC/USDT (4-hour timeframe). Here's the idea breakdown:
---
1. Overall Structure
The price is moving within a descending channel, suggesting a broader downtrend.
The two black trendlines show clear lower highs and lower lows forming.
---
2. Key Zones & Indicators
Blue Zone (104,000–106,000 region):
This is a major supply/resistance zone where price has repeatedly rejected.
The two red arrows mark failed attempts to break above it — confirming strong bearish pressure.
EMA 50 (blue line) and EMA 200 (black line):
Price is trading below both EMAs, confirming bearish market structure.
The 50 EMA is below the 200 EMA, indicating a bearish crossover (momentum continuation signal).
---
3. Expected Move
After the recent rejection from the supply zone, the chart projects a bearish continuation:
A possible small pullback or consolidation.
Then a drop toward the target area near $90,099, which aligns with the lower boundary of the channel (major support).
---
4. Target
Target Point: Around $90,100, which could be the next liquidity zone or potential demand area.
---
5. Summary
Trend: Bearish
Structure: Lower highs & lower lows (descending channel)
Bias: Continuation to the downside
Confirmation: Rejection from supply + EMA resistance alignment
Target: $90,100
Mr SMC Trading point
---
Trading Idea Summary:
“BTC is maintaining a bearish structure under EMA resistance and rejecting the 104–106K supply zone. Unless price reclaims that level, continuation toward 90K support remains the high-probability scenario.”
Please support boost 🚀 this analysis

ABCD Pattern Part 1: Double BottomsWe find the root of technical analysis in the systematic study of repetitive patterns in the historical price record. In the previous article, I explored key aspects of this discipline, such as its history and the fundamentals of its creation. Today, I will focus on a specific pattern, which I like to call the ABCD pattern , and specifically show its logic and practical uses for detecting entries in double bottoms. If my contribution is well received, I will soon show other variants.
ABCD is a basic price action structure; what would be an impulse (AB), a retracement (BC), and the continuation of the impulse (CD).
Historical Background
Classic authors such as R.N. Elliott, Goichi Hosoda, and Alan Andrews dedicated decades to the study of impulsive and corrective waves in the markets. Specifically, the ABC pattern (composed of an impulsive segment and a corrective one) has been a pillar in these theories. For R.N. Elliott, Fibonacci ratios were essential to predict future fluctuations in his Elliott Wave Theory. Alan Andrews developed his own tool, known as the Andrews Pitchfork, and Hidenobu Sasaki contributed to the popularization of Goichi Hosoda's methods in the 1990s, showing how his mentor used measurements to project waves and corrections.
As a contemporary reference, we have Scott M. Carney, a pioneer in harmonic trading. His methodology, inspired by the ideas of Elliott, W.D. Gann, J.M. Hurst, and H.M. Gartley, seeks to predict probable reversal zones in price action through Fibonacci ratios. Carney popularized the AB=CD pattern as a four-point structure where the initial segment (AB) partially retraces (BC) and then completes with an equidistant movement (CD), allowing the identification of entry opportunities at market extremes. This pattern, along with its alternate variants, forms the basis of his approach in books like The Harmonic Trader, where he emphasizes the convergence of ratios to maximize trading precision.
Let’s Keep It Simple: Description and Psychology of the ABCD Pattern
It is extremely harmful to memorize tricks, formulas, and patterns while discarding understanding. Price charts are, above all, a psychological phenomenon. Forgetting this, at best, would be underestimating our greatest advantage as technical analysts.
After investors profit from an impulsive wave (AB), at some point many will take partial or full closes of their positions, triggering a correction (BC). Once the price resumes its impulse in the direction of the prevailing force (CD), the eyes of many participants will be on the next correction or inflection point (D).
There are many psychologically attractive zones for taking partial position closes, and a Fibonacci extension is a useful tool, but there are so many implications of each ratio that investors will often feel overwhelmed by so much information.
Practical Use in Double Bottoms
Figure 1.1
In Figure 1.1, I show what would be a bearish impulsive wave making a correction. The horizontal lines show the zones where the price can approximately change direction, forming a double bottom.
Instead of memorizing and aligning Fibonacci combinations, I recommend detecting ABCD patterns over the zone, which will increase the effectiveness of our market entries. As confirmation, we will wait for a high-volume entry and a candle pattern that shows strength (false low, bullish engulfing candle, bullish hammer with a large wick or shadow).
A false low occurs when the price falls below the price action and bounces upward with force, leaving a wick or shadow at the bottom of the candle and an elongated body at the top (preferably without a wick or shadow), indicating strong rejection by buyers.
Figure 1.2
In Figure 1.2, we can observe a real example of the ABCD pattern application in corrections. Our lower line of interest is the one that truly confirms a double bottom thanks to a notable volume entry and an engulfing candle pattern.
It is necessary to train our eyes to volatile scenarios, quite unlike those we would find in books.
Figure 1.3
Figure 1.3 shows the scenario of an ABCD pattern at our first line of interest. Generally, the first line of interest will be around the 0.786 Fibonacci retracement zone, while the second line of interest is a bit more imprecise, but volume will tend to provide solid confirmation of buying strength.
Figure 1.4
Figure 1.4 shows in more detail how, over the zone of our first line of interest, we find a notable increase in volume. In this case, our entry confirmation would come from a false low.
Why is the second line of interest more imprecise to calculate than the first line of interest, but one of my favorites?
When the price reacts strongly below what would be a support zone in a double bottom, we are generally facing a bear trap, a scenario of extreme volatility.
Many bears who entered expecting the continuation of the downtrend will be forced to capitulate in the presence of strong buyer entry. This, added to the capitulation or partial closes of sellers who had positions taken previously, generates a scenario of extreme bullish volatility. I especially like these formations because of the notable volume presence that precedes them and the bullish force unleashed afterward.
Trade Management and the Importance of Break-Even
A Stop Loss (SL) adjusted below the zone where a bullish candle shows us strength will be extremely necessary in this type of formation, but it will be equally useful to understand that we want to use the force in our favor in the safest way possible.
A scenario where we ensure we don’t lose a penny will be psychologically comfortable, so setting an SL at a break-even zone once the price moves in our favor will be an excellent decision, especially in bear trap scenarios, where volatility will generally be high and consistent.
We should ensure a risk-reward ratio superior to 1:1, which will be straightforward if we use the SL as described before.
In Figure 1.5, you can see how a failed entry in interest zone 1 (which did not confirm correctly with a bullish candle pattern) would not mean a monetary loss if the SL had been moved to break-even; and in Figure 1.6, you will observe the correct trade management in a confirmed entry in interest zone 2.
Figure 1.5
Figure 1.6
Importance of the ABCD Pattern
The ABCD pattern reflects a part of investor psychology that, in the right context, can give us an extra point of statistical effectiveness. In double bottoms, I recommend taking entries at the first line of interest (around the 0.786 Fibonacci retracement) without neglecting the detection of the ABCD pattern and the always necessary volume and price confirmations.
At the second line of interest, considering that bear traps are extremely volatile, I believe we could overlook the detection of this type of pattern (ABCD), without discarding the notable volume entry and the candle pattern that confirms the entry.
Final Words
There are many contexts where an ABCD pattern will be our edge, but I have limited myself to addressing my personal application in double bottoms due to the complexity of the matter and the considerable time it would take me to exemplify each scenario.
If what is presented here proved useful, I will continue sharing in subsequent articles about different ways to establish effective entries using this pattern.
Bibliography
Bulkowski, T. N. (2005). The simple ABC correction. Technical Analysis of Stocks & Commodities , 23 (1), 52-55.
Carney, S. M. (2010). Harmonic trading, volume one: Profiting from the natural order of the financial markets. FT Press.
Elliott, R. N. (1946). Nature's law: The secret of the universe.
Morge, T. (2003). Trading with median lines: Mapping the markets. Market Geometry.

Another drop for BitcoinHi traders,
Last week Bitcoin finishedthe small correction up (bearish) and went down again. After that it made another correction up.
So now we could see another drop to the Weekly FVG after the finish of the correction.
Let's see what the market does and react.
Trade idea: Wait for a correction up on a smaller timeframe and a change in orderflow to bearish to trade shorts.
This shared post is only my point of view on what could be the next move in this pair based on my technical analysis.
But I react and trade on what I see in the chart, not what I've predicted or expect.
Don't be emotional, just trade your plan!
Eduwave

BTCUSDTHello Traders! 👋
What are your thoughts on BITCOIN?
Bitcoin has entered a corrective phase after reaching the top of its ascending channel and setting a new high.
The correction is still ongoing, and the price is now approaching a major support zone that aligns with the ascending trendline.
This correction is expected to extend toward the marked support area, where we anticipate a positive price reaction that could trigger a bullish reversal and lead to new highs.
In this region, traders can consider using the DCA strategy to accumulate long-term positions, as the overall market structure remains bullish.
Don’t forget to like and share your thoughts in the comments! ❤️

$BTC - Dumping Before NY - OpenIt’s always the same, and one of my most promising strategies is the “dump before NY open” — considered a lower time frame reversal strategy.
Since Asia dumps and UK accumulates, I’m pretty sure the price will pump during the NY open — though I might be wrong here.
Take this as educational content.
#NFA

what happen next ? to btcI’m not saying this scenario will repeat exactly, but the probability is high.
Please don’t forget proper risk management.

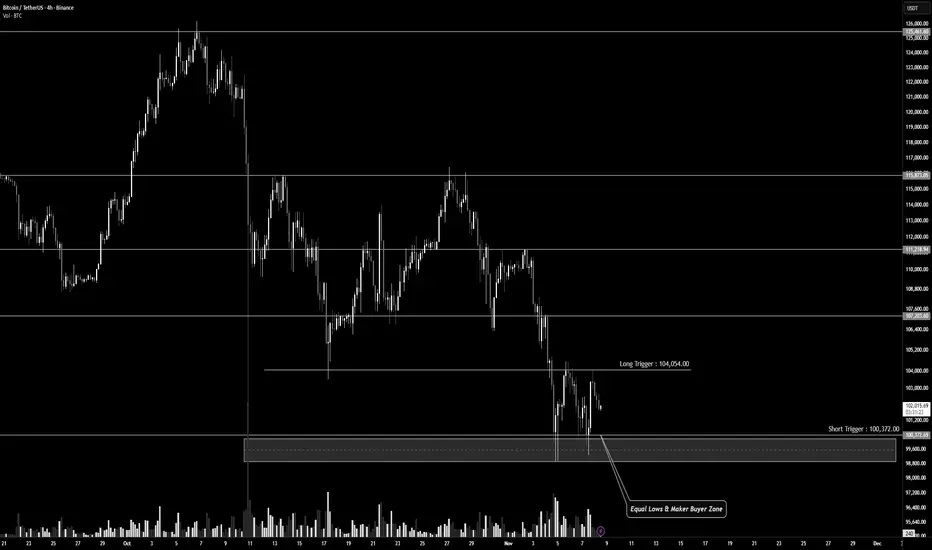
Bitcoin in a 4H Range: Critical Levels and Trade Scenarios Ahead👋🏻 Hey everyone! Hope you’re doing great! Welcome to SatoshiFrame channel.
✨ Today we’re diving into the 1-Day Bitcoin Dominance analysis. Stay tuned and follow along!
🪙 On the 4-hour timeframe, Bitcoin is currently moving within a clear trading range.
The highs and lows in lower timeframes are nearly equal, providing solid trigger zones for potential trades.
The range resistance is around $104,054, while the range support lies near $100,372, which can be considered a micro buyer zone.
💰 During Bitcoin’s first upward move, the volume increased, indicating an attempt to shift momentum bullishly.
However, after forming a lower high, buyers experienced FOMO but failed to push the price further up.
A pullback then occurred toward the support zone at $100,372, where another equal low was formed.
As price moved upward again, buying volume decreased, showing weakening buyer strength, and the move concluded with a blow-off 4H candle near the previous top.
✍️ Below are the potential trading scenarios for Bitcoin.
Review them and align with your own strategy and risk management before taking positions.
↗️ Long Position Scenario
A breakout above the resistance zone (the 4H trend-change area) around $104,054, followed by the formation of a higher low on that level, could provide a solid long setup.
Ensure this move is confirmed by increasing volume and buying pressure convergence for a higher win rate.
📉 Short Position Scenario
A breakdown below the support zone (two equal lows and a key weekly/daily support) around $100,372, combined with the formation of a lower high below that zone and strong selling pressure, could offer a short opportunity.
Watch out for large whale candles — it’s best to wait for confirmation before entering.
❤️ Disclaimer : This analysis is purely based on my personal opinion and I only trade if the stated triggers are activated .
BTC/USDT 1DAY CHART ANALIYSIS. BTCUSDT chart analysis and a brief update.
BTC remains above the key daily demand zone (green box) of $100,000–$104,000. Previous visits to this level have generated strong bullish momentum.
Pattern: The chart setup indicates a rounded bottom, and if the support zone holds, BTC is likely to move higher.
Upside Target: If demand returns, a bullish reversal towards $123,000–$124,700 remains anticipated, following the 46% rally seen after a similar pattern previously.
DYOR | NFA

BTC/USDT (4H Analysis)BTC/USDT (4H Analysis)
– Price: 102,530 USDT (-0.75%)
Market Structure
Bitcoin remains in a bearish market structure on the 4-hour timeframe, forming a sequence of lower highs and lower lows.
The recent rebound from the 100,000–101,000 USDT demand zone (green area) shows short-term bullish relief, but the broader trend continues to point downward.
The Premium zone (around 114,000–116,000 USDT) remains a major supply area where strong sell pressure was confirmed multiple times.
Current price is trading below the 50 EMA (white) and 200 EMA (yellow), both sloping downward — confirming momentum remains bearish.
Key Levels
Resistance Zones
103,000–104,000 USDT: Near-term resistance (PDH region)
106,000 USDT (PWL) → mid-range equilibrium resistance
109,900 USDT (200 EMA) → strong bearish continuation zone
114,000–116,000 USDT (Premium Supply) → Major sell zone / “Strong High”
Support Zones
102,000 USDT (PML) → minor support, currently being retested
100,000–101,000 USDT (PDL / Demand Zone) → key support and possible bounce area
Below 100,000 USDT: potential liquidity grab / panic sell zone
Indicators
Stochastic RSI is entering the overbought region (84.9–77.9), signaling potential bearish reversal pressure soon.
Momentum divergence visible between recent lows suggests short-term recovery might continue before the next leg down.
Technical Outlook
Structure: Bearish
Short-term move: Likely pullback to 103,500–104,000, then potential rejection
Mid-term bias: Bearish continuation toward 100,000 USDT
Invalidation of bearish bias: 4H close above 106,000 USDT
Correlation Summary
DXY → bullish and near resistance (USD strength = bearish for BTC)
USDT Dominance (USDT.D) → rising and consolidating (money flowing into stablecoins = bearish for BTC)
BTC/USDT → rejected from resistance, following macro bearish momentum
📉 Conclusion:
The market remains risk-off. As long as BTC stays below 106,000 USDT, expect continued bearish pressure with potential tests toward 100,000 USDT. Only a sustained break above 109,000–110,000 USDT would shift momentum back to bullish territory

TradeCityPro | Bitcoin Daily Analysis #214👋 Welcome to TradeCity Pro!
Let’s dive into the Bitcoin analysis. The market is finally showing signs of turning bullish. Let's do a complete analysis of Bitcoin.
⏳ 1-Hour Timeframe
Yesterday, Bitcoin faked the low it had formed, which helped the bullish momentum enter the market.
✨ Currently, after reacting to the 103,855 level, Bitcoin has entered a correction and is now attempting to form a higher low.
✅ If this higher low is formed and the price moves towards 103,855 again, we can open a long position when this level is broken.
⭐ This trigger is the first for a long position and, naturally, it will be a bit risky. However, I prefer to keep this position open because if the market decides to move upward in the future, we can more easily open new positions.
📊 For a short position, I am currently waiting for the market to create more structure and new triggers to emerge. For now, the only trigger we have is the 100,308 level.
🎲 The volume has slightly decreased compared to yesterday, which is normal because today is Saturday. We need to observe how the buyer and seller volume compares today, and based on that, we can determine the strength of the buyers and sellers.
❌ Disclaimer ❌
Trading futures is highly risky and dangerous. If you're not an expert, these triggers may not be suitable for you. You should first learn risk and capital management. You can also use the educational content from this channel.
Finally, these triggers reflect my personal opinions on price action, and the market may move completely against this analysis. So, do your own research before opening any position.

Bitcoin Technical Analysis and Price forecast: Bitcoin made another pullback from the key psychological of $99k support price level.
Bitcoin is struggling to maintain its price above the resistance $104k. CRYPTOCAP:BTC has to make a day above this resistance to keep the bullish momentum continue. A day close above the resistance will help bitcoin to extend the rally $107K.
However a day close below $104k could result in fall of the price to $99k again.
Relative Strength Index RSI is at 37 low then the level of neutral indicating the bear hold in the market. Moving Average Convergence Divergence made a bearish crossover Monday forming weaker histogram indicating that bearish momentum is getting weaker.
#BTC

BTC/USDT – 4H Market Outlook BINANCE:BTCUSD
Bitcoin is currently trading around the 102,000 zone, sitting directly inside a well-defined demand region that has previously acted as an accumulation area. The market has aggressively sold off from the 116,000–118,000 rejection range and has now tapped into the deeper liquidity pocket highlighted on the chart.
Price action within this zone shows repeated wicks into the demand block, signaling that sell-side pressure is slowing down while buyers are beginning to react. Structurally, the market has swept liquidity below the previous lows and is now consolidating above the 100,000 psychological value area. This behavior typically precedes a corrective move or a full bullish reversal.
Based on the current reaction and the broader market context, my expectation is for Bitcoin to push upward from this demand zone and target the previous major high. The imbalance left on the move down and the inefficiency between 112,000 and 116,000 create a natural upside magnet for price once bullish momentum resumes.
My invalidation level remains firm: the stop loss sits on the red line around 98,200. A clean break below this level would signal that the demand zone has failed and that further downside becomes highly probable.
For now, as long as Bitcoin holds above the current demand structure, the bullish projection toward the previous high remains the primary scenario.

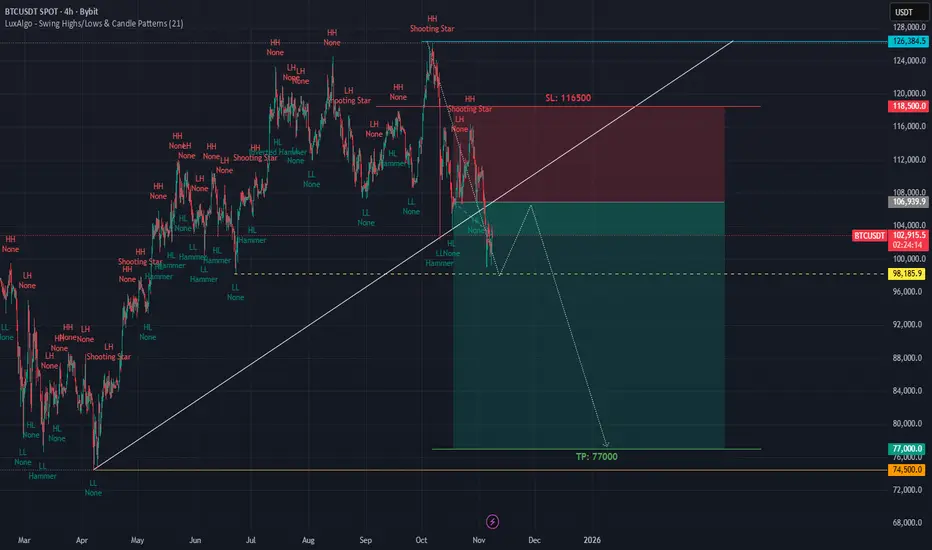
BTC/Alt Season Blue Print Till Oct 2026Bitcoin has started its dead cat bounce from $98,962 to $117,186(wave 2). During this time alts will go crazy. It could take 3 weeks to hit $117,186 or even a month and 3 weeks. Either way when BTC hits 117k that is your sign to take profit immediately from BTC and all alts. Everything will flash crash horribly after that.
We are in a bear market which is when alt season starts, it marks the top for BTC. If history repeats itself BTC will bottom out Oct.6 2026 around $35,000. With institutions in the market it may not go that low this time around so be weary.
The end of wave 3($69,573) will initiate the gaming bull run in early 2026 until we hit wave 4 around 98k. From there everything will crash again for the last wave all the way to $35,000.
Goodluck.

Technology and Innovation in Global Trade1. The Digital Transformation of Global Trade
The digitization of trade processes has drastically simplified international transactions. Earlier, global trade relied heavily on paper documentation, manual inspections, and lengthy approval systems. Today, electronic documentation, blockchain, and digital customs systems have replaced much of this inefficiency.
For instance, electronic bills of lading (eBL) and digital trade finance platforms now allow exporters and importers to complete transactions in hours instead of days. The use of smart contracts—automatically executed agreements coded on blockchain—ensures faster payments, reduces fraud, and enhances trust among international trading partners.
Moreover, e-commerce platforms like Amazon, Alibaba, and Shopify have empowered millions of small and medium-sized enterprises (SMEs) to reach global customers. These platforms integrate digital payment systems, AI-driven logistics, and marketing analytics, allowing businesses to compete globally without a physical presence.
2. Artificial Intelligence and Big Data in Trade
Artificial Intelligence (AI) and Big Data analytics are revolutionizing trade decision-making. With the massive volume of data generated through online transactions, AI systems can now analyze global supply chains, predict demand, and optimize pricing in real time.
AI in logistics enables route optimization, reducing delivery times and fuel consumption. Predictive analytics helps businesses anticipate market fluctuations, currency risks, and consumer trends, making trade more resilient and cost-efficient.
For example, ports like Singapore and Rotterdam use AI-based traffic management systems to coordinate ship arrivals, minimizing congestion and improving turnaround times. Similarly, AI-powered customs systems are now capable of identifying high-risk shipments using image recognition and machine learning, improving border security and efficiency.
Big Data also aids trade policy analysis. Governments and trade organizations use data analytics to monitor import-export trends, detect unfair trade practices, and assess the impact of tariffs. This data-driven approach has replaced traditional manual monitoring systems, enabling more adaptive and informed trade policies.
3. Blockchain: Ensuring Trust and Transparency
Blockchain technology is one of the most transformative innovations in international trade. It provides a secure, decentralized ledger system that records every transaction transparently and immutably.
In global trade, trust among multiple parties—exporters, importers, banks, shippers, and insurers—is essential. Blockchain eliminates intermediaries by creating a shared and tamper-proof record of trade documents, payments, and logistics.
For instance, TradeLens, a blockchain-based platform developed by IBM and Maersk, connects shippers, customs authorities, and logistics providers on a single network. It enhances visibility across the supply chain and reduces the risk of document fraud or manipulation.
Additionally, blockchain-based trade finance allows small exporters to access financing quickly since banks can verify transactions and documents instantly. This inclusion is critical for SMEs that traditionally struggled with high entry barriers in global markets.
4. Automation and Robotics in Logistics
Automation has significantly improved the speed, accuracy, and cost-efficiency of global trade operations. Robotics and automation are transforming warehousing, cargo handling, and transportation systems.
In modern ports and warehouses, automated guided vehicles (AGVs) and robotic arms handle container loading and unloading with minimal human intervention. Drones are increasingly used for inventory management and delivery in remote areas.
The Internet of Things (IoT) also plays a vital role by connecting devices and sensors across supply chains. IoT systems track shipments in real time, monitor temperature-sensitive goods, and detect disruptions instantly. This real-time visibility minimizes losses, enhances traceability, and ensures compliance with international trade regulations.
Furthermore, autonomous ships and trucks are being tested to reduce human error and improve delivery efficiency. As automation continues to evolve, it is expected to redefine labor markets and supply chain management globally.
5. Fintech and the Evolution of Cross-Border Payments
The financial infrastructure supporting international trade has been revolutionized by financial technology (fintech). Traditional cross-border payments often involved high fees, currency delays, and compliance hurdles.
Today, innovations like digital banking, cryptocurrencies, and blockchain-based remittance systems are making global payments faster, cheaper, and more secure. Platforms such as Ripple and SWIFT gpi enable near-instant international money transfers with transparent tracking.
Central Bank Digital Currencies (CBDCs) are also being explored by major economies as a way to simplify global trade payments while maintaining regulatory oversight. For example, China’s Digital Yuan and the European Union’s proposed Digital Euro aim to reduce dependency on the U.S. dollar and create more efficient cross-border trade settlements.
Moreover, decentralized finance (DeFi) is emerging as a new model for trade finance, providing blockchain-based lending and credit systems accessible to anyone globally. This democratization of finance could enable millions of smaller exporters and importers to access capital more easily.
6. 3D Printing and Decentralized Manufacturing
Another groundbreaking innovation influencing global trade is 3D printing (additive manufacturing). By enabling production closer to the point of consumption, it reduces dependency on global supply chains.
Instead of importing finished goods, companies can now trade digital design files and manufacture locally. This shift could drastically reduce shipping costs and carbon emissions while increasing customization and flexibility.
Industries such as automotive, aerospace, and healthcare are already using 3D printing to produce specialized components on demand. While it may reduce the volume of traditional goods traded, it creates a new category of digital trade — the trade of design, software, and intellectual property.
7. Sustainability and Green Innovation in Trade
As climate change concerns grow, sustainability has become central to global trade innovation. Green technologies such as renewable energy, electric transport, and carbon tracking tools are shaping how trade operates.
Companies are investing in carbon-neutral supply chains by adopting eco-friendly packaging, optimizing routes to reduce emissions, and using alternative fuels like hydrogen. Digital platforms now track the carbon footprint of each shipment, enabling environmentally conscious consumers and partners to make informed decisions.
The rise of Environmental, Social, and Governance (ESG) standards in trade finance further encourages sustainable practices, as banks increasingly offer better terms to companies meeting green criteria.
8. Cybersecurity and Digital Trade Governance
With digitalization comes the challenge of cybersecurity. As trade systems rely more on data and connected networks, protecting them from cyberattacks has become a priority.
Governments and corporations are investing in advanced encryption, AI-based threat detection, and cybersecurity frameworks to secure trade infrastructure. Simultaneously, international organizations like the World Trade Organization (WTO) and UNCTAD are working to develop digital trade rules, ensuring fairness, privacy, and interoperability across borders.
9. The Future: AI-Driven, Inclusive, and Sustainable Trade
Looking ahead, global trade is set to become more AI-driven, inclusive, and sustainable. Technologies like quantum computing, 5G connectivity, and digital twins will further enhance efficiency and simulation capabilities across global supply chains.
Moreover, digital trade agreements and virtual trade missions will enable more countries and individuals to participate in international commerce without physical limitations. The future of trade will depend not just on moving goods but on exchanging data, knowledge, and digital assets.
Conclusion
Technology and innovation have redefined the global trade landscape, transforming it into a fast, transparent, and data-driven ecosystem. From AI and blockchain to IoT and fintech, each advancement contributes to making trade more efficient, inclusive, and resilient.
However, this transformation also brings challenges—cybersecurity threats, unequal access to technology, and regulatory complexities. Balancing innovation with security and inclusivity will be crucial for the next phase of global trade development.
Ultimately, the synergy between technology and trade holds the power to create a more connected, sustainable, and prosperous world—where borders matter less, and opportunities are truly global.

BTC correction update
After the BTC expand triangle reached the top at around 120,000, BTC continue to drop when the time is at the cycle turning points. Expect it to go down to around 96,200 and side way until around 2026.


BTC will dump to $7600 follow my structure last month Oct 25BINANCE:BTCUSDT BTC I said on Oct 17, 2025 last month will dump to $7600, now new month in November 2025, look like follow my structure
BTC Strong Surge: Heading Towards 110,700 USD!BTC/USDT is in the process of a strong recovery after reaching the important support level at 99,500 USD. After forming a bottom and bouncing from this level, the current trend indicates a high potential for continued growth.
The next resistance level for BTC is 110,700 USD. If the pair can break through this level and maintain above it, the price could continue its strong upward momentum, opening the opportunity to reach higher levels in the short term.
However, if it fails to hold above the 99,500 USD support, BTC may face difficulties and could pull back to lower support levels. Despite this, with the current positive technical signals, the likelihood of BTC continuing to rise in the next 24 hours is very high.
Traders should carefully monitor these support and resistance levels to formulate an appropriate trading strategy.

BTCUSDTBitcoin (BTC) Price Analysis: Bearish Outlook
Based on the daily chart for BTC/USDT, a bearish sentiment is building. The analysis is supported by a classic RSI (Relative Strength Index) divergence, a strong signal that the current uptrend is losing its momentum.
An RSI divergence happens when the price makes a higher high, but the RSI indicator fails to do the same, creating a lower high. This indicates that the buying pressure is weakening, and a price reversal is likely to occur.
Additionally, the chart shows that if the price breaks below the last key low, it would confirm a shift in the market trend from bullish to bearish. This breakdown could lead to a significant price decline.
Based on this analysis, here are the potential trade levels:
Entry Price: Look for a short entry if the price breaks and closes below the support level of $105,536.
Stop Loss (SL): To manage risk, place the stop loss just above the recent swing high at $114,237. This will protect your position if the price unexpectedly reverses and continues its upward trend.
Take Profit (TP): The first target for profit taking is the next major support level at $85,063. This level represents a key point of previous support where the price could find a floor.
Disclaimer: This is a trading idea based on technical analysis and is not financial advice. Trading cryptocurrencies carries a high risk of loss, and you should always do your own research before making any trading decisions.
