BTCUSDT.P - November 8, 2025BTCUSDT.P is showing potential for a short-term bearish reversal after approaching resistance near the $104,000 zone. A sell short limit is placed at $104,070, targeting a move down toward the $102,088 partial profit zone and the $100,475 profit level.
A sustained move above the $105,875 stop level would invalidate this short setup and indicate renewed upside momentum.
Risk Assessment: Moderate to High — structure leans bearish, but confirmation requires rejection from the $104,000 resistance zone and continuation below $102,000.
Trade ideas

Bitcoin is in a consolidation zone right above the $102k supportThe price has reached a crucial support zone at $102,000 and has stalled after a sharp decline. 🛑
The pattern in the yellow box is a Consolidation Zone, signifying a fierce battle between buyers and sellers and diminishing selling pressure. 🥊 #PriceAction
If the price breaks above the ceiling of this Consolidation Zone, we can expect a rally towards the next resistance at $108,000. 🚀 #BullishScenario
However, if this support fails and the price closes below the floor of the Consolidation Zone, more downside can be expected. 😨 #Risk
The market is currently indecisive 🤔; it’s best to wait for a confirmation signal (a breakout) before entering a trade.
Patience is the best strategy at this point, until the market’s next direction becomes 💰


BTC market snapshot100K is fighting hard — as it should, there’s a cliff below to the next level.
Let’s see where the daily candle closes, but judging by the higher timeframes, I have some doubts about a new ATH and a “super alt season.”
We’re still overheated, and so are global indices.
It’s a very short-biased week for the stock market — and for top crypto this month as well.
Don’t loosen your buns just yet 😄

btcusdtToday, I had 5 stop-losses, but the 6th signal reached its target.
Result: $15 loss and $48 profit.
Net Profit: $33.

Bitcoin 455 days Rising Wedge Top FormationHello there! Here we can clearly see that bitcoin is putting in a 455 days rising wedge.
It means that every rally is getting smaller, every consolidation is taking less time, meaning bulls have less and less ammo to push the price higher - a sign of exhaustion. Price is becoming compressed and an asset is looking for a resolution (a pattern is breaking up or down).
Also we can clearly see a declining volume of this rising wedge, meaning that that there is less and less interest as the price goes higher. The trend was very aggressive, but bulls could not maintain the velocity of the trend.
And now we have a trendline which is breaking down and the volume is increasing confirming the pattern breakdown. It is like the price was trapped in that rising tide, but because of the lack of momentum, volume the trend could not be sustained anymore leading to this breakdown. At first we lost 50 day Moving average, then 200 day MA, all with very little volume, now we are about to lose 50 week MA, which supported this whole bull market.
Protect your capital.
Stay safe everyone and have a great day!

Weekly Bitcoin Analysis — BTC/USDT
📊 **Weekly Bitcoin Analysis — BTC/USDT**
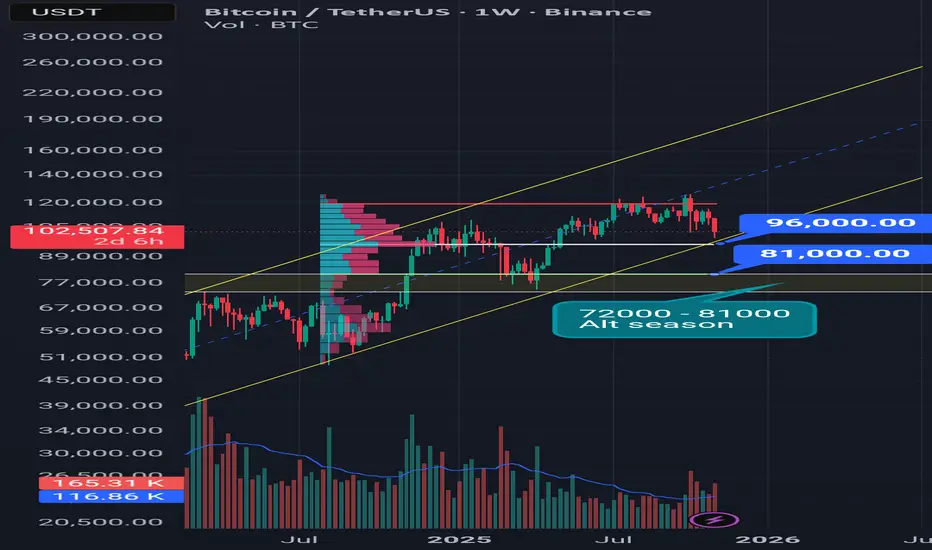
Bitcoin is entering a key corrective zone between **$96K and $81K**.
This range could trigger a **major altcoin correction**, where fear peaks and the market quietly creates **golden buying opportunities**. ✨
During this phase, many altcoins may drop to very low levels — but that’s exactly where the **best entry points for multi-fold growth** begin to form.
🔹 **Key support zones:**
* **$96,000**
* **$81,000**
* **$72,000** (possible shadow or wick test)
If Bitcoin finds strong support in these areas, we could see the market shift into a **massive Alt Season**, followed by a renewed rotation of capital back into Bitcoin.
⚡️ Patience, awareness, and emotional control are essential here.
The biggest opportunities are often born in the deepest corrections. 🌌
#Btc #Alt_Season

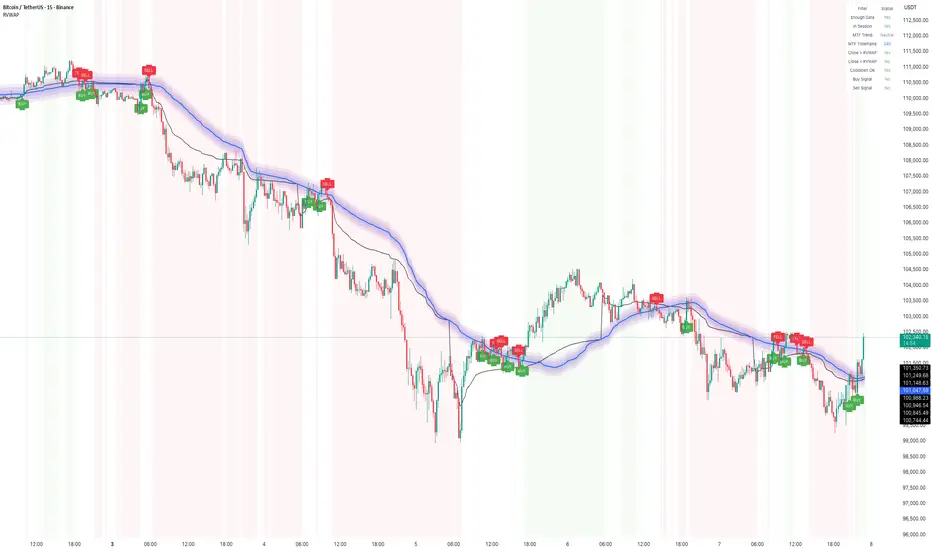
How to Use Rolling VWAP – Early US Session Trend TrackerIn today’s BTC/USDT 15-min chart, the Rolling VWAP perfectly captured the directional bias throughout the session.
The smooth transition between compression and expansion phases clearly aligned with VWAP slope shifts — giving multiple early signals during the US market open, when volatility tends to expand sharply.
Performance Highlights
• The indicator tracked clean trend waves with minimal lag, showing how price respected the VWAP envelope dynamically.
• BUY and SELL zones were well-defined, with fading reversals quickly replaced by trend-aligned setups.
• Session filter (US Market) ensured signals appeared primarily during active volatility windows, avoiding false setups during low-volume hours.
• The rolling nature of VWAP (instead of session-based VWAP) allowed continuous trend capture across intraday transitions.
Additional Notes
1. Cooldown Setting:
Currently set to 1 candle — which makes the chart more responsive but slightly denser with signals.
Increasing it (e.g., to 3–5 bars) can make the chart cleaner, though some reversal entries may not display visually even though they’re logically detected.
2. US Session Filter:
The logic focuses on the early US market phase, effectively capturing directional bursts when liquidity and volatility spike — ideal for short-term scalping or trend continuation setups.
⸻
🧠 Tip:
Combine the Rolling VWAP bias with higher-timeframe structure (e.g., 1H trend) for even more reliable directional trades.
$BITCOIN$Those who wait patiently will win big!
This is just a technical analysis, make sure you do your analysis before investing.

BTC Is Warming Up for Its Next Big Move — Don’t Miss This Setup Few thoughts about BTC:
when you trade crypto you have to look at 4h+ time frame, daily or weekly is the best to see clean picture.
Right now BTC just touched discount( 100359)
now i can see 3 possible scenarios
1 - small pull back next week and then pump 130-140k first target
2 - price will go a bit deeper to fill weekly FVG at ~90k
3 - CRYPTO SCAM AND WE ARE ALL DOOMED😱😱😱
until we didnt see BTC break below 70k , i am still bullish on crypto and buying some coins on spot for my portfolio, i am not heavy in crypto but 200-300$ a week is nice investment with potential x10-20 return is nice option

BITCOIN SIGNAL: PUMP INCOMING???? (trap alert) Yello Paradisers! Enjoy the video!
And Paradisers! Keep in mind to trade only with a proper professional trading strategy. Wait for confirmations. Play with tactics. This is the only way you can be long-term profitable.
Remember, don’t trade without confirmations. Wait for them before creating a trade. Be disciplined, patient, and emotionally controlled. Only trade the highest probability setups with the greatest risk to reward ratio. This will ensure that you become a long-term profitable professional trader.
Don't be a gambler. Don't try to get rich quick. Make sure that your trading is professionally based on proper strategies and trade tactics.

Mastering Trend Reversals: Morning & Evening Star PatternsSo, you're trying to nail those trend reversals? The Morning and Evening Star patterns are perfect for that. They show up right when the market’s about to shift, giving you a chance to get in before the move really takes off. Let’s break down how these setups work and why they’re such solid tools for traders like you.
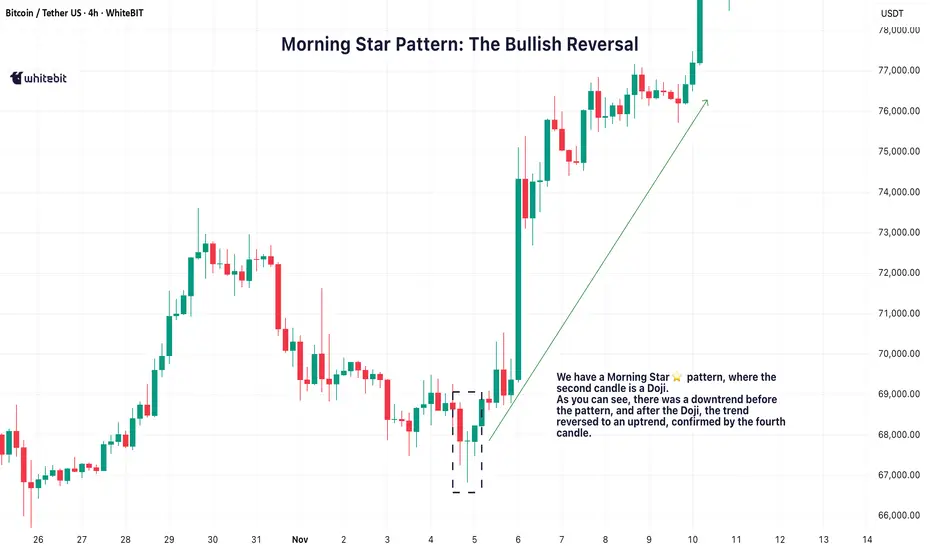
🌅 Morning Star Pattern: The Bullish Reversal
The Morning Star pattern is one of the best ways to catch a trend reversal from bearish to bullish. It usually pops up after a downtrend, signaling that the market is about to make a move to the upside. It’s made up of three candles:
A long red candle that shows the market’s been selling off.
A small candle, often a Doji, that indicates indecision or a pause in the downtrend.
A big green candle that confirms the shift, showing buyers are taking control.
When you spot a Morning Star candlestick pattern, it’s a strong indication that the downtrend might be over and the bulls could be taking over. The third candle plays a crucial role here, confirming that the trend is likely reversing.
🌇 Evening Star Pattern: The Bearish Reversal
On the flip side, the Evening Star pattern is the bearish cousin of the Morning Star. It shows up after an uptrend and signals that the market is ready to start heading down. It also consists of three candles:
A long green candle that continues the uptrend.
A small candle, again often a Doji, that suggests the market’s losing momentum.
A big red candle that confirms the reversal, showing sellers are stepping in.
When you see the Evening Star candlestick pattern, it tells you that the market could be shifting from bullish to bearish. The third candle confirms that the reversal might be taking place.
💡 Trading the Star Patterns
Both the Morning Star trading pattern and Evening Star patterns are great for spotting potential trend reversals, but they shouldn't be relied on as the only signal. To increase the reliability of these patterns, consider confirming them with other indicators like RSI (Relative Strength Index) , MACD (Moving Average Convergence Divergence) , or volume analysis.
For example, if a Morning Star pattern candlestick appears and is followed by increasing volume, it adds strength to the reversal signal. Similarly, if the Evening Star shows up with an overbought RSI, it could provide further confirmation that the market is due for a pullback.
By using these additional tools, you can have more confidence in your analysis and make better-informed decisions.
📈 Why These Patterns Matter
The Morning Star and Evening Star patterns are powerful tools for identifying potential trend reversals. They give traders a visual cue that a market shift could be on the horizon, helping to spot potential turning points.
However, it’s crucial to make your trading decisions based on a combination of factors and not rely solely on these patterns. Always make sure to consider the broader market context and other technical indicators before acting on any pattern.
Bitcoin 455 Days Rising Wedge Short Hello there! Here we can clearly see that bitcoin is putting in a 455 days rising wedge. It means that each and every pump is Getting smaller, after the pump we have a large consolidation, after each and every pump the next consolidation is even smaller. Also we can clearly see a declining volume of this rising wedge, and now we have a trendline which is breaking down. Stay safe everyone and have a great day!

Quantitative TradingThere are two main approaches to seeking consistent profits through the study of price history: the discretionary approach, based on experience and logical reasoning, and the quantitative approach, focused on identifying and exploiting behavioral patterns under specific market conditions.
Contrary to what’s usually thought, neither approach is exclusively intuitive or mechanical. Discretionary traders don’t operate solely on intuition, and quantitative ones don’t lack reasoning when building their systems. Both share fundamental elements: they rely on analyzing price history, spotting repetitive patterns, and applying statistical knowledge and risk management.
The main difference lies in flexibility. Discretionary traders enjoy greater freedom to make decisions, which can be harmful for inexperienced investors but a huge advantage for seasoned ones. Quantitative traders, on the other hand, follow strict rules, which reduces emotional influence and often allows automating processes to generate profits consistently.
This article is dedicated to exploring some vital concepts and ideas for developing solid and effective quantitative trading.
Key concepts about systems
• Quantitative systems require strict entry and exit rules
A quantitative system must be based on clear and objective rules for trade entries and exits. Though it seems obvious, many educational resources highlight metrics like win rates without considering the subjectivity in the systems they present, making reliable calculations impossible. Before evaluating a system’s stats, the investor must ensure all parameters are quantifiable and precisely defined.
• Trading systems are not universal
Each market has its own nature, which can be studied based on its historical record. For example:
• Trending markets , like SPY or Tesla, are driven by factors such as economic growth or market sentiment, making them ideal for systems that aim to capture directional moves.
• Range-bound markets , like Forex, are influenced by central banks promoting stability, limiting extreme moves and favoring ranges under normal conditions.
Applying a trending system to a pair like EUR/USD, which tends to consolidate, can lead to disappointing results. Similarly, using a mean-reversion system in a strongly directional market like the SPY ETF is illogical and usually ineffective. Plus, traditional markets have a structural bias favoring bulls over bears, which can significantly impact the performance of certain strategies.
On the other hand, timeframe is a critical factor when developing and evaluating quantitative systems. In lower timeframes, volatility from news, emotions, or high-frequency trading makes it hard to apply trending systems. Instead, higher timeframes (H4, D, W) offer more stability, improving the performance of many systems by reducing market noise.
• An effective quantitative trading system must be backed by a broad and detailed historical record
The larger the volume of data analyzed, the greater the confidence in the system’s ability to produce predictable results in the future.
A key aspect in developing quantitative trading systems is ensuring consistency in results. Consistency in a system’s performance across different timeframes (D, H4, H1) is an indicator of its robustness and adaptability. For example, a system that generates solid and stable returns across multiple timeframes shows greater reliability than one that only works well in a specific timeframe.
• We should avoid trading systems with unstable equity curves or large drawdowns
A quantitative trading system must be designed to generate consistent profits with controlled risk. That’s why it’s essential to avoid systems with unstable equity curves (erratic fluctuations in gains) or large drawdowns (maximum accumulated losses). These issues indicate a lack of robustness and can jeopardize the system’s long-term viability.
• A high win rate doesn’t guarantee consistent profitability
A common mistake among investors is assuming a high win rate ensures high and sustainable profitability. However, a quantitative trading system’s profitability depends on multiple factors beyond the win rate, such as the risk-reward ratio, market exposure, and operational costs.
For example, trending systems can generate larger profits but often have lower win rates due to greater market exposure, while systems with high win rates may offer limited returns because of shorter exposure and accumulated costs from high trade volume.
• Commissions and the number of trades must be factored into system testing
Failing to include these costs in the analysis can create a misleading perception of the system’s profitability, artificially inflating results.
Even a system with a stable and consistent equity curve doesn’t guarantee success if commissions aren’t considered, especially in strategies with low win rates or high trade volume.
• The risk-reward ratio must be adapted to the system
There’s no universal formula that guarantees profitability in all scenarios based solely on this parameter. However, using an inappropriate risk-reward ratio for the chosen system can lead to costly mistakes.
For example, applying a tight (low) risk-reward ratio in trending systems, or a high risk-reward ratio in mean-reversion systems or those exploiting small patterns, is an inconsistency that often results in significant losses for traders.
• About backtesting in TradingView
When a system is quantified on the TradingView platform, by default, profits and losses are calculated relative to the percentage of volatility. This means our margin per trade will generate losses or gains based on price movement.
For example, if our entry occurs on a bullish engulfing candle that closes above the EMA 20, and our SL is placed at the candle’s low, the losses from the entry point to the SL will be highly variable and depend on the volatility percentage, not on solid position management (like setting a 20% SL per entry, which would mean adjusting leverage). We could get three trades right in a row, and it’d only take the entry candle of the fourth trade to be huge for the losses to be disproportionate if the SL triggers.
This is especially important to keep in mind when backtesting systems on low timeframes, where volatility is extremely low. Without accounting for leverage and fixed loss percentages per trade, we might discard highly profitable systems, since the platform—calculating gains and losses based on volatility percentage—will always show poor profitability.
An inexperienced investor might face a system with a 60% win rate and a 1:1 risk-reward ratio, but if the backtesting is done on a 5-minute chart (where volatility is low), they’ll likely discard it due to the apparent poor profitability.
Conclusions
Developing effective quantitative systems requires an approach that integrates clear rules, rigorous testing, and a deep understanding of market dynamics. In upcoming articles, I’ll dive deeper into the topic, plus share my views and experience on other investment approaches.

Bitcoin with 2B Sell Pattern and 1,2,3 Reversal ConfirmationStep 1: 2B Sell Pattern Confirmation
On the BTC daily chart, the 2B Sell setup (failure at $126K) signals a potential medium-term trend reversal — from bullish to corrective.
That means price is likely to seek liquidity below prior supports, which often aligns with CME gap fills.
🔹 Step 2: CME Gap Context
There’s indeed a CME gap (Chicago Mercantile Exchange Bitcoin Futures) left around the $91K–$93K zone.
CME gaps occur because the futures market closes on weekends, while the crypto spot market trades 24/7.
Historically, over 85–90% of CME gaps eventually get filled, especially when they align with major technical targets.
🔹 Step 3: Pattern + Gap Alignment
2B Sell breakdown neckline ≈ $108K
Measured move target ≈ $90K–$92K
CME gap zone ≈ $91K–$93K
📈 So yes — the 2B sell’s projected target aligns almost perfectly with the CME gap area.
That means if the bearish momentum continues, BTC could retrace into that $91K–$93K region to fill the gap before finding a major bottom or reversal setup.
Summary Bias:
The 2B Sell pattern + CME gap confluence makes the $91K–$93K region a high-probability magnet for BTC price action in the coming weeks — unless price reclaims above $118K with strong volume.

Long BitcoinBitcoin! I took a small long. Minimal Stop-Loss: entry at 101850, SL at 99000. Lets see if this PIG tries to fill the Book again at 118k level ...

BITCOIN MACRO STRUCTURE — 5-POINT TRENDLINE CONFIRMATION🔹 1. Structure Overview
The trendline from early 2023 has now been touched 5 times (1–5), each marking a major cycle low before a strong impulsive rally.
Every touch (1 → 2 → 3 → 4 → 5) acted as higher low formation, confirming institutional demand at the trendline.
The 5th touch — the one forming right now around $100K — is historically the most important one, as it often decides continuation or breakdown.
🔹 2. Technical Confluence with MA Chart
The red 50-week moving average currently aligns with this 5th touch zone ($95K–$100K).
This creates dual support confluence:
🔸 Static: The long-term ascending trendline.
🔸 Dynamic: The 50-week MA.
This overlap is a strong bullish defense zone — where long-term buyers typically reload positions.
🔹 3. Bullish Scenario (Primary Bias)
Price holds the 5th touch ($95K–$100K zone).
Weekly candle closes above the trendline and 50W MA.
Momentum re-enters → breakout wave targets:
Target 1: $127K–$130K
Target 2: $150K–$160K
Probability: ~70% based on pattern repetition and MA confluence.
🔹 4. Bearish Scenario (Invalidation Case)
Weekly close below $90K = trendline breakdown (first time since 2022).
Would trigger macro correction toward:
$80K (previous structure support)
$75K (38.2% retracement level)
Probability: ~30%, but must be watched carefully.
🔹 5. Psychological Outlook
This “5th-touch” setup resembles prior mid-cycle re-accumulation zones seen in 2017 and 2020 bull markets. If BTC respects it again, it signals that the bull market is not over — just cooling before the final wave.

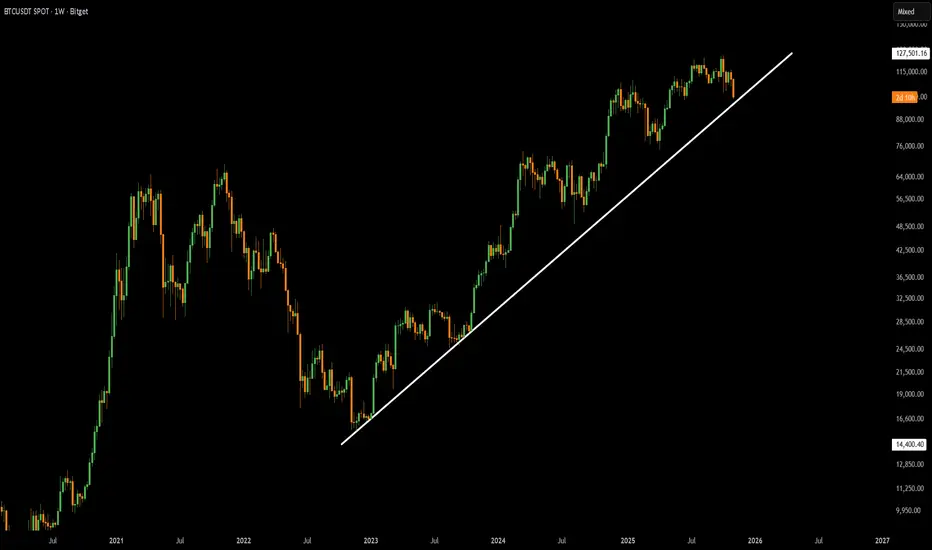
Bitcoin with Ascending Trendline (2022-2025)🔍 Bitcoin on Weekly Timeframe Overview.
The trendline connects key swing lows from late 2022 – early 2023 – mid 2024, forming a clean ascending structure.
Price recently corrected from ~$110K to ~$100K but is still well above the trendline, which currently sits around $88K–$90K zone.
🧭 Market Structure
The chart confirms a consistent higher-low and higher-high pattern — a textbook definition of a bullish macro trend.
The recent 9% correction is typical within an uptrend, especially after such extended runs.
The trendline acts as a dynamic support — each touch historically triggered strong bullish reversals.
⚖️ Bias
Macro Bias: Strongly Bullish
The market remains well-structured above the trendline.
Until Bitcoin closes a weekly candle below $90K, the macro uptrend remains fully valid.
The current move looks like a mid-cycle pullback — potentially building energy for the next expansion leg (likely toward $130K–$150K range).
Short-Term Bias: Neutral to Slightly Bearish
There’s visible short-term selling pressure (-9% weekly candle).
If momentum continues, a retest of the $90K–$93K zone (trendline area) is very possible before a rebound.
A clean bounce from that trendline would be a strong buy confirmation signal for long-term investors.
🧩 Key Levels
Support Zones:
$90K → major trendline & confluence support
$95K → psychological and horizontal support
Resistance Zones:
$110K → short-term resistance (recent high)
$127K–$130K → next expansion target zone
✅ Conclusion
The Bitcoin remains in a healthy macro uptrend with strong structural support around $90K.
Unless that trendline breaks decisively, the overall bias stays bullish — this is likely a high-timeframe continuation phase, not a reversal.
BTC/USDT Analysis. The Buyer’s Last Chance to Take ControlHello everyone! This is your CryptoRobotics trading analyst, bringing you the daily market review.
Yesterday, Bitcoin tested the key $102,300–$100,500 (volume anomaly) zone, where trading activity increased noticeably. However, the initial reaction from buyers was weak — momentum failed to build up.
A second wave of selling followed, pushing the price to a new local low. Yet both at the support test and the new low we can see significant volume anomalies, suggesting possible absorption of selling pressure and an attempt by buyers to defend the level.
At this point, buyers have their last opportunity to regain control.
To confirm a local trend reversal, we need to see clear signs of strength on lower timeframes — a structural break, strong delta, or a high-volume bullish bar.
If this does not occur, another wave of selling is likely, which could quickly drive the price down toward the $97,000–$93,000 (major support) zone.
Buy Zones:
$102,300–$100,500 (volume anomalies)
$97,000–$93,000 (high-volume zone)
Sell Zones:
$105,800–$107,400 (pushing volumes)
$109,500–$110,700 (accumulated volumes)
$112,400–$113,300 (accumulated volumes)
$114,700–$115,700 (accumulated volumes)
$120,900–$124,000 (high-volume zone)
This publication does not constitute financial advice.

BTCUSDT LONGBitcoin on weekly TF price action with a red moving average (50-week EMA).
Each major bullish leg is labeled with percentage gains:
+199%
+126%
+71%
+51% (current projection)
So, Bitcoin has been showing progressively smaller bullish impulses after each correction — a sign of a maturing bull cycle and possible momentum slowdown.
🧭 Current Market Context
Price: Around $100,800, with a sharp -9.43% weekly correction.
Trend: Price is currently testing the moving average as support — historically, this has been the buy zone during bull cycles (2023, mid-2024 pullbacks).
Structure: Higher highs and higher lows remain intact → macro bullish structure still valid.
⚖️ Bias
Primary Bias: Bullish (macro)
BTC is still above the long-term moving average, confirming that the broader uptrend is intact.
The 51% leg projection suggests a potential target around $150K–$160K if BTC holds above the $95K–$100K zone.
Historically, every retest of the 50-week MA has led to continuation moves upward.
Short-Term Bias: Cautiously Bullish
Current -9% correction may continue slightly deeper to $95K support zone (possible wick below EMA). A weekly close below $92K would shift bias to neutral-to-bearish short term (trend break risk).
If price holds above $100K and shows a bullish reversal candle, expect the next impulsive move toward $130K+.
🧩 Key Levels
Support: $95K → $92K → $85K
Resistance: $110K → $125K → $150K (measured target)
✅ Conclusion
The chart shows a healthy macro uptrend with a temporary correction phase. If BTC maintains support above the weekly EMA (~$95K–$100K), the next expansion phase could aim for $150K+. Losing that level, however, could confirm a mid-cycle correction before the final leg up.

BTCUsdtThis is a general analysis of the two processes that may occur.
My opinion is that the trend is green, but you should consider the analysis and other things and analyze the market yourself. This analysis can be completely wrong.
BTC good work to now with this Fibbo Channel.
i hop save that.
EntryPoint:
99430
96892
93175
Resistances
102811
104064
Targets:
105296
107315
109408
112429
116423
MidTime:
121699
124534
128735
137000
LongTime:
143203
151468
161192
GL

Bitcoin ETFs $2 Billion Outflow Could Push BTC Into CapitulationAt the time of writing, Bitcoin trades at $101,274, hovering just above the $100,000 psychological support. A breach below this level could trigger panic among retail traders.
If ETF outflows and bearish sentiment persist, Bitcoin could fall below $100,000 and test the $98,000 support. This decline could extend further, sending the crypto king towards $95,000 or lower.
However, should low prices attract fresh capital inflows, BTC may rebound toward $105,000 and aim for $110,000. Reclaiming this resistance would signal renewed market strength and invalidate the prevailing bearish outlook.
