BTC and Liquidity CycleBitcoin(BTCUSDT)
Net Liquidity(ECONOMICS:USCBBS-FRED:RRPONTSYD-FRED:WDTGAL)
Reverse Repo(RRPONTSYD)
Treasury General Account(WTREGEN)
Effective Fed Fund Rate(EFFR)
Trade ideas

BTCUSDT – Correction Pressure ReturnsHello traders,
After a weak rebound earlier this week, Bitcoin is showing signs of losing momentum as it continues to face rejection around the 110,000 USD zone. On the 4-hour chart, price action remains clearly within a descending channel, indicating that the short-term trend still favors the bearish side.
From a technical perspective, BTC is currently being capped by the EMA 34 and EMA 89, both acting as dynamic resistance levels. The recent bounce appears to be merely a technical pullback following the previous strong sell-off, but lacks the strength to establish new upward momentum. The price structure is forming a tight consolidation zone near the upper boundary of the channel — typically a signal of “a pause before continuation of the prior trend.”
On the news side – Policy and sentiment headwinds
This week, the FSB (G20) warned of “major gaps” in global crypto regulation — a negative sign for market confidence, especially after a massive mid-month liquidation shook investor sentiment.
At the same time, China’s tighter stance on stablecoins is raising concerns about slower Asian inflows, while institutional demand remains weak.
Together, these factors create a market environment of low buying pressure and rising risk , giving bears the upper hand in the short term.
Possible Scenario
At the moment, BTCUSDT is trading within the 106,000 – 110,000 USD range.
If the price fails to make a decisive breakout above 110,000 USD, a continuation of the correction toward the 100,000 USD area remains highly possible — aligning with the lower boundary of the descending channel and a key psychological support zone.

$BTC (DAILY): KEY support/resistance ZONE + 200 MA, in-playCRYPTOCAP:BTC has just closed two key candles, the WEEKLY and DAILY ones. My conclusions:
The WEEKLY close $108.6k, slightly below the JULY breakout ($109k). Equal lows, roughly. Market structure has become a bit weaker again.
The nearest support on the weekly is the 50 MA (blue arrows on 1W chart), losing that would likely lead to sub-100k prices. And also confirm the definite end of an extended WAVE 5 rally.
It just looks like we are heading for WAVE A (start of a proper correction of a few legs) targets ($100.3k and $94.3k).
RISING WEDGE with a breakdown point at $94k. This is the ultimate exodus line for me. Breakdown below would most likely mean that #BTC has entered its WINTER season.
ZOOMING in on the DAILY chart, a huge fight going on to stay above the 200 MA. The king of all MOVING AVERAGES (always the thickest green on my charts), at $107.8k, this MA is the most common way to say whetver an asset is in a BEAR or BULL market.
We had a DAILY close above for now, but also a LOWER LOW, and that, in confluence with a DOUBLE TOP breakdown ongoing...
In any case, a close below the 200 MA, that KEY SUPPORT zone being tested now ($107-$109k), and we should see the $100k test.
Orders ready, details in the quoted post (on my X profile, also the WEEKLY chart and LIQUIDATIONS heatmap)👇
💙👽

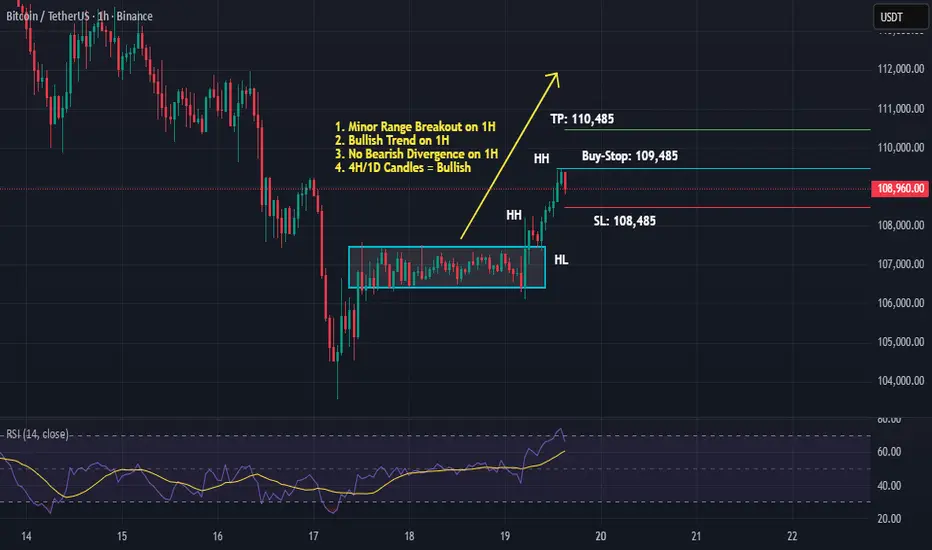
Bitcoin Breaks Range, Forms Bullish Trend on 1H TimeframeBitcoin is making Green Candles on 4H, 1D timeframes. On 1H, it has formed a Bullish Trend after breaking out from a minor range. Looks like Bitcoin is again going up after a Flash Crash.
Let's take a 1:1 Buy-Stop trade here.
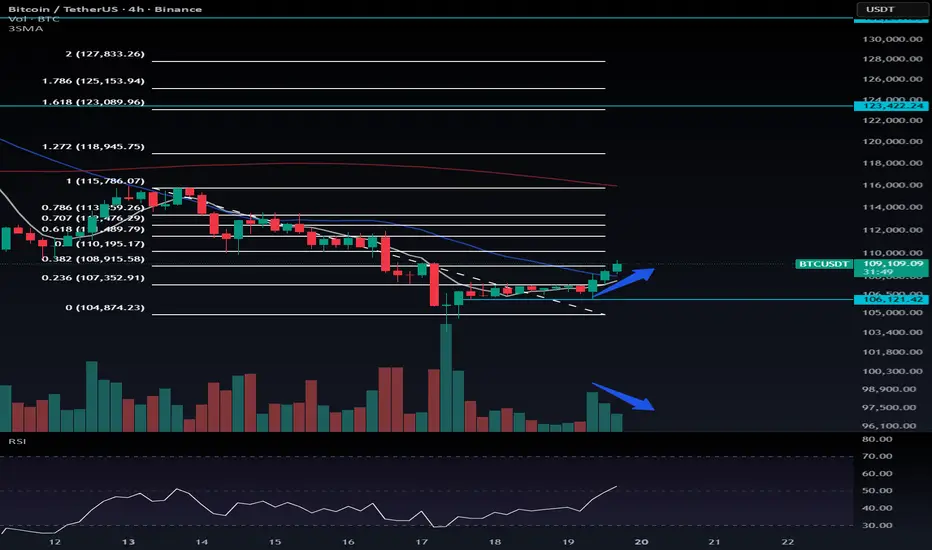
BTC Pullback Reaches Fibonacci 0.382Correction or Trend ReversalBitcoin has retraced up to the Fibonacci 0.382 level, suggesting that the recent move to the upside is likely a corrective bounce, not a new bullish trend.
Despite the price recovery, trading volume hasn’t increased, which supports the idea that this is just a temporary relief move within the broader downtrend.
If the price starts declining again but red candle volume remains weak, it could indicate that the bearish momentum is fading and the downtrend may be ending.
However, if red candles become larger than green ones and volume increases, that would confirm that selling pressure remains strong.
The current retracement could extend to the Fibonacci 0.5 level, around $110,195.
If the price breaks above this level and sustains it, I’ll consider the downtrend invalidated — meaning we may enter a new phase, either sideways or bullish.
For now, the short trigger remains at $106,121, though it’s still a bit far.
I’ll update the analysis if a new trigger appears.
As for long positions, I prefer to stay patient and wait for a clearer structure to form.
First touching $135,000 then falling to $95,000Bitcoin will not fall below $100,000 until it completes its 5th wave. Bitcoin’s return from the $102,000 price range, right at the time Bitcoin was experiencing a Sharpe decline from $126 to $102,000, is a confirmation of my statement. Bitcoin’s growth trend is not over and in my opinion, don’t pay too much attention to the idea of Bitcoin falling below $100,000.

my setupthe all chart indicator
with 1d 200 sma support
with fibo extension
with stochastics
all the way up

BTCUSDwent down to the area of interest of 103 it seems like they would like to test the 119 area
his next move I think we'll test the 99 zone
and if this support area does not hold we will test the 97 area I believe my opinion

BTCUSDT: Trend in 4-H time frameBitcoin has dropped to around $102,300. The key support level and the 50 MV in weekly time frame are both located near $99,700. It’s important to note that there’s a $3,000 price gap, which makes a retest of that zone quite possible.
Looking at Bitcoin’s current setup, there’s also a chance it could retest the 200 MV in daily time frame, situated near $106,800.
A major resistance level can be found around $115,800, and price action around that zone should be watched closely.
Overall, market conditions remain uncertain and unsettled, making it difficult to define a clear trend for Bitcoin or the broader market. That said, the overall trend remains bearish, with potential downside targets across different timeframes around $91700, $81200, $75100, and $70300. Reactions at these levels are to be expected — but if this downward trajectory continues, altcoins are likely to suffer more severely, possibly testing even lower price levels.
The color levels are very accurate levels of support and resistance in different time frames.
A strong move requires a correction to major support and we have to wait for their reaction in these areas.
So, Please pay special attention to the two accurate trends, colored levels, and you must know that SETUP is very sensitive.
BEST,
MT

BTC not looking goodPurely looking at the technicals, macros, and trends BTC is well positioned to continue to take a dive. All the mini pumps are still below 9SMA/50SMA and about to cross 200SMA. So it's moving in channel in a downward motion. Also, leave your emotions at the door when looking at charts and reading about BTC or anything else frankly. The macros all say the same thing, there's stress in the economy and retailers, if not prepared, will be the EXIT liquidity.
No crypto bros will save you! Always take positions with the broader direction and understand how to trade with the swings using ETFs (inverse). Personally, I'm a big fan of MSTR and using proxy ETFs on the swings (MSTU / MSTZ) since these are highly correlated to BTC.

4H Time Frame Indicate Change in Market Structure BITSTAMP:BTCUSD COINBASE:BTCUSD INDEX:BTCUSD CRYPTO:BTCUSD BINANCE:BTCUSD BITFINEX:BTCUSD BITFINEX:BTCUSD OKX:BTCUSD KRAKEN:BTCUSD PEPPERSTONE:BTCUSD OANDA:BTCUSD VANTAGE:BTCUSD ICMARKETS:BTCUSD CRYPTOCAP:BTC CAPITALCOM:BTCUSD GEMINI:BTCUSD BLACKBULL:BTCUSD EIGHTCAP:BTCUSD IG:BITCOIN FOREXCOM:BTCUSD BINANCE:BTCUSDZ2025 FUSIONMARKETS:BTCUSD CRYPTOCOM:BTCUSD FX:BTCUSD THINKMARKETS:BTCUSD TICKMILL:BTCUSD BYBIT:BTCUSDZ2025 EASYMARKETS:BTCUSD BLUEBERRY:BTCUSD SAXO:BTCUSD BITMEX:BTCUSDV2025 KRAKEN:BTCUSDV2025 PYTH:BTCUSD PYTH:BTCUSD FPMARKETS:BTCUSD WEBULLPAY:BTCUSD CFI:BTCUSD OKX:BTCUSD24V2025 HTX:BTCUSD26Z2025 DERIBIT:BTCUSD24V2025 BINANCE:BTCUSDT.P DELTAIN:BTCUSD.P BINANCE:BTCUSDT.P BITMEX:BTCUSD.P BINGX:BTCUSDT.P MEXC:BTCUSDT.P COINBASE:BTCUSDC.P
Currently, BTC is showing early signs of a short-term recovery after the recent sharp decline. The market has managed to hold above the Current Support zone around $107,357 – $107,353, which has been a crucial stabilizing level over the past few sessions. Price has now begun to climb gradually, indicating that buyers are attempting to absorb previous selling pressure and establish a temporary base.
The immediate focus now shifts toward the Initial Resistance zone near $109,948, which stands as the first key hurdle on the path to recovery. This level is likely to act as a decisive region — if BTC can break and sustain above it, it could trigger a push toward the Major Resistance zone between $113,100 – $112,914. That region, however, is where heavy supply pressure has previously entered, causing sharp declines in prior attempts. Hence, any approach toward that zone should be observed carefully for potential rejection or confirmation of strength.
On the downside, if the price fails to hold above $107,353, we could see a retest of the Next Support at $106,398 – $106,393, followed by the Lowest Support at $105,430, which represents the last structural line of defense before the market risks another drop toward deeper levels near $103,457 (the most recent low).
Overall, the structure currently represents a short-term bottoming attempt within a broader corrective trend. BTC is still trading below the larger resistance zones, so while short-term momentum appears constructive, the broader tone remains cautiously neutral until the market breaks decisively above $109,948 – $110,000. Sustained strength above that region would validate the possibility of a more meaningful upside recovery.
🧭 Summary:
Major Resistance: $113,100 – $112,914
Initial Resistance: $109,948
Current Support: $107,357 – $107,353
Next Support: $106,398 – $106,393
Lowest Support: $105,430
Major Low: $103,457
Market Tone: Neutral-to-bullish in short term; broader structure still corrective.
Bias: Short-term bullish above $107,350; caution below $106,400 as breakdown risk increases.
Key Focus: How BTC reacts between $109,900 – $110,000 will determine whether this current bounce extends or fades into another leg lower.

Bitcoin: key buyer levels may lie lowerHi traders and investors!
This analysis is based on the Initiative Analysis concept (IA).
Let me remind you that on the weekly timeframe, Bitcoin still hasn’t managed to launch an upward trend after breaking out of the sideways range. The market is currently in a transitional phase, with buyer initiative above and seller initiative below.
Price has already attempted to break upward from the buyer initiative twice — during the weeks of August 11 and September 29. Now, the price has returned back into the range.
We also see declining volumes on the monthly chart, showing that the buyer clearly lacks strength.
At the moment, sellers are facing support around 105,100 — the base of the July 2025 monthly candle. It’s not a bad context for looking for buys, if only the candle had strong volume.
We’ll see how things develop on the daily timeframe. If the price consolidates below 107,255 (the breakout test level on the weekly TF) and then buyers absorb the seller’s candle from October 17, that could create a reason to look for longs.
On the weekly timeframe, there are also interesting levels to watch for potential buys:
— 50% of the trading range — 100,353 (which also aligns with the 50% monthly level);
— the base of the breakout move from the range — 98,200.
Of course, this all depends on whether the buyer actually shows up — with volume and spread.
This 100,500–98,000 zone remains an important buyer defense area if they intend to keep the price from dropping below 90,000.
Wishing you profitable trades!

Long Idea Bitcoin 🧭 Bitcoin Long Setup – Expansion Phase Incoming
After an aggressive selloff and redistribution phase, Bitcoin has built a clean accumulation base around 106k–107k, showing clear signs of seller exhaustion and liquidity hunts. The breakout above the descending trendline confirms a potential trend reversal and entry into the expansion phase.
I’m entering long around 107k, with a stop near 105k and targets at 120k–130k, stretching up to 140k if momentum sustains. The structure aligns with Wyckoff accumulation and liquidity-trap patterns, backed by favorable October seasonality and improving macro sentiment.
As long as BTC holds above the accumulation range, I expect continuation toward the green zone and possibly a new local high. A breakdown below 105k would invalidate this setup.

#BTC Weekly Bullish Trend Intact📊#BTC Weekly Bullish Trend Intact📈
🧠From a structural perspective, the weekly bullish structure is still intact, and the bullish target zone (132k-175k) is still expected to be achieved, so the probability of continuing the bullish trend is still relatively high.
➡️We bought 30% of BTC spot from the green buy zone, and it has now started to rebound from here. If the closing price this week can be higher than the S/R W, then the bullish sentiment will be greatly improved.
➡️If there is an opportunity to directly reach the red target zone in the future, then we can look for medium-term shorting opportunities here (2).
⚠️Note that if a pullback starts from (1) in the future and a weekly short structure is constructed, then we need to be vigilant about the occurrence of a deep pullback, and the new bullish support level needs to be found around 74500.
🤜If you like my analysis, please like💖 and share💬
BINANCE:BTCUSDT

BITCOIN - Short before the bullish reversalThe volume profile currently aligns with our identified point of interest (POI), which corresponds to an unfilled Fair Value Gap (FVG) on the Daily timeframe.
Price action has recently swept the previous daily high (PDH), indicating a potential liquidity grab.
Hourly candle closures have shown weakness, failing to demonstrate meaningful displacement to the upside.
Given these conditions, we anticipate a possible sweep of the PDH once again, potentially forming equal lows (EQ lows) just beneath our Daily POI (FVG).
From there, price may initiate a liquidity hunt toward the sell-side, targeting the previous daily low (PDL) and previous weekly low (PWL).
A potential rebound could occur from one of our H4 Bullish Imbalance-Support-Interaction (BISI) zones, which may act as a strong area of demand.

Bitcoin Can reach 93000 Bitcoin could reach the price level of $93,000 in the coming weeks.
There is a possibility that after breaking the midline of its long-term weekly channel, it may move up to the indicated FVG level to fill the remaining unfilled orders.
After that, it could start a new bullish rally aiming for the upper boundary of the channel.
This is purely an analysis and should not be considered as financial advice.
Buying or selling is at the trader’s own risk.

BTC WEEKLY OUTLOOK - TARGETS & TIME RESISTANCEAs long as Bitcoin holds above 98,200, upside remains open with targets at 129,130 and 135,000.
Watch Oct 27, 2025, marked as a key time resistance (W-1, W-W, W+1). This date can also flip into an inversion, so price action around it will be decisive.

Bitcoin Short Opportunity – Wave A Correction in Progress Bitcoin is currently around $107 K and is likely to see a small bounce early in the week, moving up toward $110 K–$112 K as it retests broken support and the moving averages — this is not a new uptrend, just the market catching its breath before deciding the next move. Once price reaches that $110 K–$112 K zone, sellers are expected to return, leading to another drop toward $102 K–$100 K by mid to late week, and if selling pressure remains strong, a quick dip to $98 K–$95 K is also possible before the weekend. This final leg down would likely complete the correction and create a better long-entry zone for the next bullish phase. However, this bearish outlook would be invalidated if Bitcoin closes a full daily candle above $114 K with strong volume and bullish momentum — in that case, the market would flip back to bullish early, and BTC could climb toward $120 K–$126 K instead of continuing the drop. What’s your outlook for the next BTC move?
Do you also expect a rejection near $112 K, or do you think the correction is already over?
Drop your thoughts or charts in the comments — let’s compare our views
#Bitcoin #ShortSetup #BTCUSDT

BTC going down? 95 000 USD targetThe chart shows BTC/USDT (Bitcoin) on the 4-hour timeframe. After a strong rally above $125,000, the price has entered a clear downtrend, currently trading around $107,500. The market structure suggests that bearish pressure remains dominant.
The moving averages (short-term and mid-term) are aligned bearishly — the shorter one (green) is positioned below the longer one (red), confirming the continuation of a downward trend. Each rebound attempt has been followed by a lower high, indicating weakening buying momentum.
The RSI indicator has bounced from oversold levels but remains below the neutral 50 level, suggesting that sellers still control the market. If Bitcoin fails to break above $110,000, a continuation of the decline toward key support at $95,000 appears likely — representing an approximate 11–12% downside potential from current levels.
Potential TP: 95 000 USD
Disclaimer: This analysis is for informational and educational purposes only. It does not constitute investment advice or financial recommendation. All trading decisions should be made independently based on your own analysis and risk assessment.

Your Token, My Analysis — Let’s Do This!Hey Traders!
Hope you're all enjoying an amazing weekend !
Want me to analyze your favorite token next?
Just drop your request below using this format
Request Format:
Project Name: Bitcoin
Token Symbol: BTC ( BINANCE:BTCUSDT )
Important Rules:
I’ll analyze only the first 10 requests.
One request per person — so choose wisely!
I’ll reply directly under your comment .
If this sounds good, smash that Like button , Share with your friends , and let’s find the next big move together !
Here’s to your success — health, wealth, and great trades!

BTC - retest then 144KWhat would a bullish setup on Bitcoin currently look like:
A re-test of the 102-103K price range.
Breakout of downtrend(s)
Bullish divergence
An entry between 101k and 105k would make sense.
A huge amount of liquidity was grabbed in last Fridays "crash" - around $10B in liquidations. Everyone is scared now. All the youtubers are saying that price is just going to keep going down. Fear and Greed index currently in the "fear" zone.
Immediate price target @ 144k
But I believe we will see a "blow off top" at the backend of Q4 of around 240k.

BTC market snapshotBTC — currently moving sideways with 12h MACD convergence. The long setup doesn’t look convincing. The chance of testing 100K from the current levels is increasing. I’m watching closely and considering a short entry. Open interest in shorts has dropped from $20B to $15B.

BTC 4H – Range Support Holding, Waiting for BreakoutBitcoin continues to respect the major range support zone around $104,000 – $100,300, after a strong drop from the recent highs. Price is now consolidating inside the demand zone, showing early signs of accumulation.
If buyers hold this level, we could see a potential relief move back toward the $111,400 – $113,100 resistance area. However, a clean 4H breakout and close is required for bullish continuation.
Until then, BTC remains in a range-bound structure, and patience is key.
Key Levels:
🔹 Support: $104,000 – $100,300
🔹 Resistance: $111,400 – $113,100
Bias: Neutral → Bullish (as long as support holds)
BTC is open 24/7 — managing risk is more important than chasing moves. 📌
