BTC HTF ScenarioI was looking at BTC on the 3W timeframe. If BTC is able to establish another accumulation into demand like shown on the chart, you maybe see this turn into a even bigger distribution or something else. I'm waiting patiently here until i see another range develop.
Trade ideas

Simplicity of h-pattern I really like the h-pattern. I share without prediction - just observation how the targets of h-pattern was fully respected.
There were two significant ones last month. Their targets have been fully met, and now the range is between the two targets.
Observation, not prediction.
However, it could be concluded that if it breaks through the upper level, there will be a bullish continuation, and if it breaks through the lower level, it will seek support at lower levels.
Wider Range or Early Trend Reversal in Multi-Timeframe?👋🏻 Hey everyone! Hope you’re doing great! Welcome to SatoshiFrame channel.
✨ Today we’re diving into the 15-Mimutes Bitcoin analysis. Stay tuned and follow along!
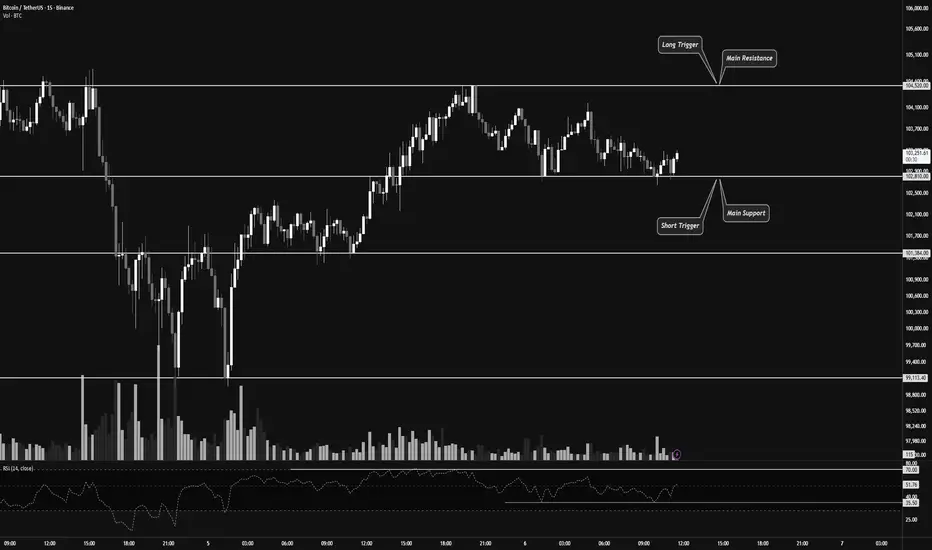
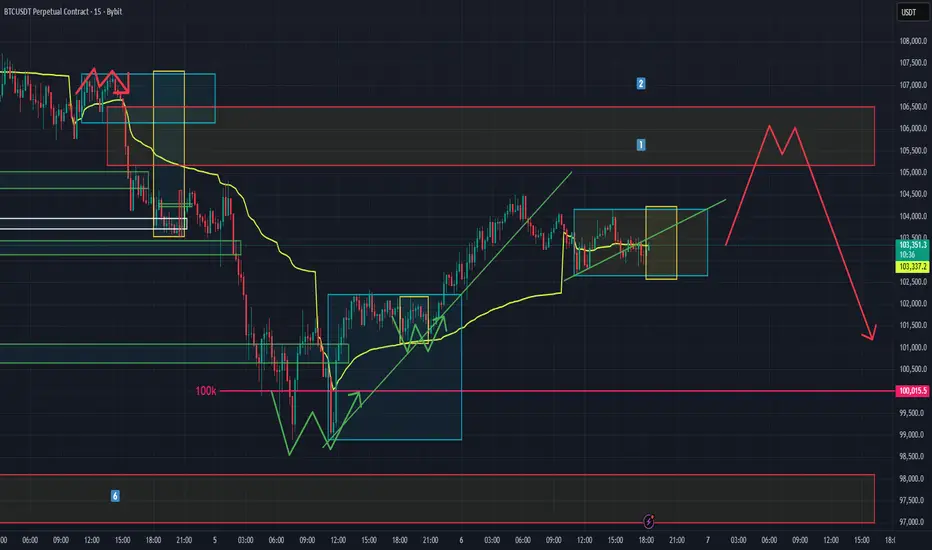
👀 On the 15-minute timeframe of Bitcoin, we can see that after recent declines, BTC has entered a 15-minute trading range. The top and bottom of this range act as our long and short triggers. Keep in mind that Bitcoin’s next move could potentially develop into a long-term directional move.
🧮 Looking at the RSI oscillator, the 70 level serves as confirmation for a long trigger, while the 35.5 level confirms a short trigger. Note that RSI confirmation based on its momentum swings can provide higher-quality trade setups.
🕯 Selling volume has increased slightly as Bitcoin approaches its resistance zone at $104,520, and we’ve seen a similar reaction when price hits resistance from below. This indicates buyer hesitation and stronger seller activity.
Meanwhile, buying volume has risen as price nears the support zone around $102,810. If this buying pressure continues, it could confirm an extended range formation in this area.
✍️ As in previous setups, Bitcoin’s potential scenarios remain straightforward. With proper RSI confirmation, we can look for entry opportunities.
🟢 Long Scenario : A breakout above the $104,520 resistance zone, accompanied by increasing buying volume and RSI exceeding the 70 level on the 15-minute multi-timeframe, could signal a long trade.
🟥 Short Scenario : A breakdown below the $102,810 support zone, with rising selling volume and RSI dropping below the 35.5 level, could trigger a short trade.
❤️ Disclaimer : This analysis is purely based on my personal opinion and I only trade if the stated triggers are activated .
BTCUSDT Daily Chart Analysis. BTCUSDT Daily Chart Analysis.
Support Zone: BTC is testing the major green demand region ($100,000–$104,000), which has triggered strong rallies in previous months.
Pattern & Projection: Price is holding near support with a bullish reversal scenario outlined—if buyers step in here, the chart suggests a possible uptrend toward $123,000–$124,700, and a technical rally of 46% (mirroring past moves).
Caution: If BTC loses this region, downside risk opens up, but as long as the zone holds, upside potential is favorable.
DYOR | NFA

BTCUSDTThe bottom of the triangle pattern has been broken and the price is pulling back to this area. The idea of selling with a target of 98,000 works.

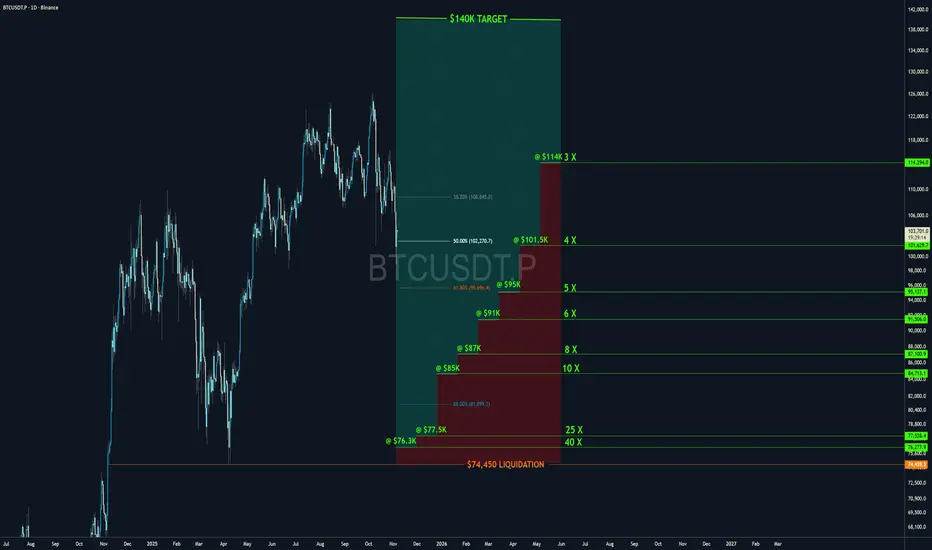
Final for BTCUSDT 6th November 2025 (Updated)Bottom $93k-95k, Final major long for the cycle topping out at $140k-$145k

btcusdtKey Guidelines to Remember:
Our starting capital is $1,000.
For the first signal, the maximum permitted loss is $1.
For the second signal, the maximum permitted loss is $2, and so on, following this incremental pattern.
The initial risk-to-reward ratio is 1:3.
If a stop-loss is triggered, the risk-to-reward ratio for the next signal increases by 1 unit (e.g., from 1:3 → 1:4).
Example Implementation:
Signal 1: Risk $1 → Reward $3 (1:3)
If stopped: Signal 2: Risk $2 → Reward $8 (1:4)
If stopped again: Signal 3: Risk $3 → Reward $15 (1:5)
Stay disciplined and adhere to the capital allocation rules.Key Guidelines to Remember:
Our starting capital is $1,000.
For the first signal, the maximum permitted loss is $1.
For the second signal, the maximum permitted loss is $2, and so on, following this incremental pattern.
The initial risk-to-reward ratio is 1:3.
If a stop-loss is triggered, the risk-to-reward ratio for the next signal increases by 1 unit (e.g., from 1:3 → 1:4).
Example Implementation:
Signal 1: Risk $1 → Reward $3 (1:3)
If stopped: Signal 2: Risk $2 → Reward $8 (1:4)
If stopped again: Signal 3: Risk $3 → Reward $15 (1:5)
Stay disciplined and adhere to the capital allocation rules.

Price Eyes Key Demand Zone — Potential Bullish Reversal in SightIt is likely that the price will decline toward the demand zones, which are forming from the initial impulse. According to the Fibonacci analysis, measured from the April 2025 wave low up to the October 2025 peak, the strongest Fibonacci demand zone for a potential rebound lies around the 61.80% retracement level. A weekly close above this level would be required to confirm the end of the corrective phase, after which a new bullish reversal wave is expected to begin.

A Tutorial on LIQUIDITY and EFFICIENCYLike I've mentioned in the past, these are the 2 core concepts of how the market moves. When you begin to understand them, you start to understand where price HAS to go. That may sound arrogant, but I am last the person to say anything about the market with certainty unless I am actually certain. It is akin to understanding why and how the sun comes up in the morning and goes down at night. Because you understand the science behind it, you are able to say with certainty where and when it will happen. (Unless you believe some flat earther stuff like the sun is a hot air balloon ride away...
So, I hope you find this video educational. Remember, successful trading is about consistency, discipline, and hard work. It is about making profit and minimizing risk. It isn't about winning or losing, or being right or wrong.
Take care,
- R2F Trading

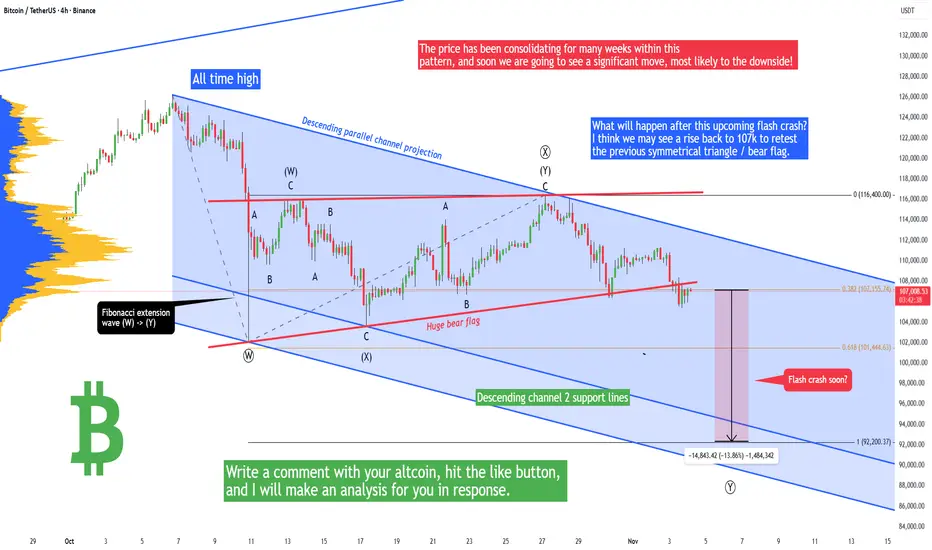
Bitcoin - Warning! Flash crash soon (BEAR FLAG)Bitcoin recently formed a symmetrical triangle, but the bulls made a false breakout above it, which is a huge problem because this symmetrical triangle pretty much transformed into a bearish flag, and that's a very bearish pattern! The price has been consolidating for many weeks within this pattern, and soon we are going to see a significant move, most likely to the downside!
This can be your last warning - otherwise, you can get liquidated in the upcoming days. You can still open a short position on futures if you want to make money on this move. What is the target of this bearish flag? To answer this question, we have to use a Fibonacci extension tool and look for the 1:1 FIB extension (92,200 USD). But what we cannot miss is this descending parallel channel projection and its support trendlines. There are pretty much 2 trendlines that act as a dynamic support (support changes with time). Support levels of these trendlines are currently around 95k and 90k. So this gives us an idea that Bitcoin should react to this zone (should be a great buying opportunity). There is also a minor support of 101,444 (0.618 FIB extension), this is indeed a weak support in this particular case, and I expect only a small bounce from this level.
What will happen after this upcoming flash crash? I think we may see a rise back to 107k to retest the previous symmetrical triangle / bear flag. Altcoins are bleeding again. If you want to know more information about your altcoin, then write a comment with your altcoin + hit the like button, and I will make an analysis for you in response. Trading is not hard if you have a good coach! This is not a trade setup, as there is no stop-loss or profit target. I share my trades privately. Thank you, and I wish you successful trades!
TradeCityPro | Bitcoin Daily Analysis #212👋 Welcome to TradeCity Pro!
Let’s dive into the Bitcoin analysis. The market has entered a corrective phase and is preparing for the next wave of movement.
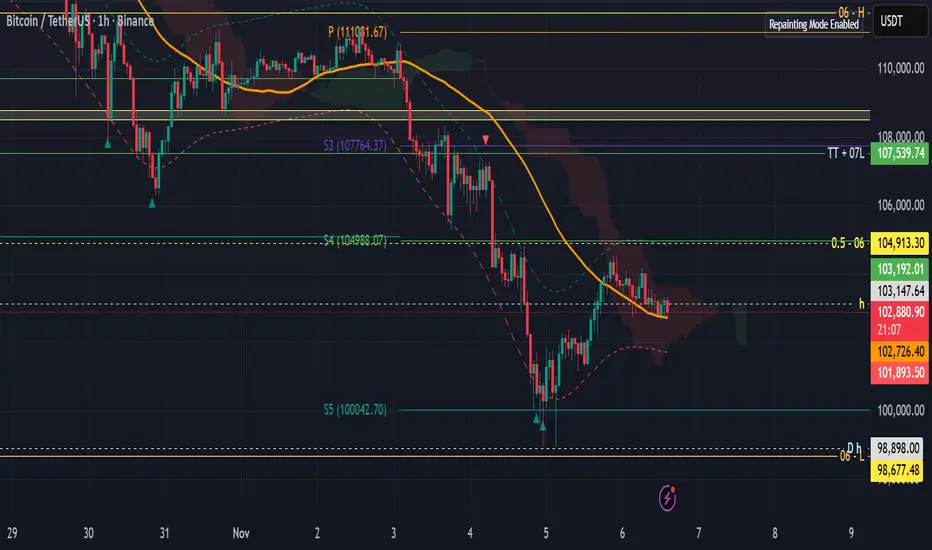
⏳ 1-Hour Timeframe
On the 1-hour timeframe, Bitcoin started correcting after reaching the support at 100,308 and has now retraced to the 0.382 Fibonacci level.
📊 Market volume significantly increased around the 100,308 support, indicating that this zone is very sensitive and important, with price reacting to it.
✨ Currently, volume has decreased slightly, and the price is in a corrective phase. If this correction continues, the next resistance zones will be at the 0.5 and 0.618 Fibonacci levels.
⭐ However, if the price continues its downward movement, we can open a position with a candlestick setup when the volume increases towards 100,308, or wait for the break of the 100,308 support to open a position.
✅ For a long position, if buying volume increases, the break of the 0.382 Fibonacci level would be a good trigger for a long entry.
❌ Disclaimer ❌
Trading futures is highly risky and dangerous. If you're not an expert, these triggers may not be suitable for you. You should first learn risk and capital management. You can also use the educational content from this channel.
Finally, these triggers reflect my personal opinions on price action, and the market may move completely against this analysis. So, do your own research before opening any position.

Bitcoin on the monthly time frameI don't feel good about this negative divergence at all
Especially since the momentum of the candles has also become very weak and it seems like they have no power to grow
The green area and the upward trend line are support areas.
Also, the dominances of Tether and Dai are also strongly signaling an increase, which puts the market at risk of falling.


BITCOIN → The hunt for liquidity before the decline BINANCE:BTCUSDT is testing the 100K area and updating its local minimum to 98,900 as part of another liquidation. The market is weak, and bulls are trying to wait out the panic...
Bitcoin looks weak. After a sharp decline, a pullback is forming, during which the price may test the break-even and interest zones — previously broken support areas. Buyers are not yet showing themselves in the market...
There is an intermediate bottom at 98,900, as well as the upper limit of the local range at 105,200. The range of 105,200 - 107,200 - 108,200 is important because it hides a pool of liquidity for a downward movement. MM may reach these zones and bring the price back into the trading range.
Resistance levels: 105,182, 107,271
Support levels: 101130, 98900
A retest of resistance at 105182 and the lack of potential for continued growth may confirm the fact of a false breakout, which in turn may provoke a fall to local targets. I do not rule out the possibility that the price may go even higher, for example, to 107270 - 108200. I do not see any point in waiting for a trend reversal yet...
Best regards, R. Linda!

BTC primed for L3 move up? (Short Term Analysis)After bouncing off of the 100k level yesterday we appear to have made it up through level one and level two rises which means we should be looking for one more rise before we see continuation down to collect that vector candle just below. There are many areas of interest further down but we shall see what happens in the short term first.
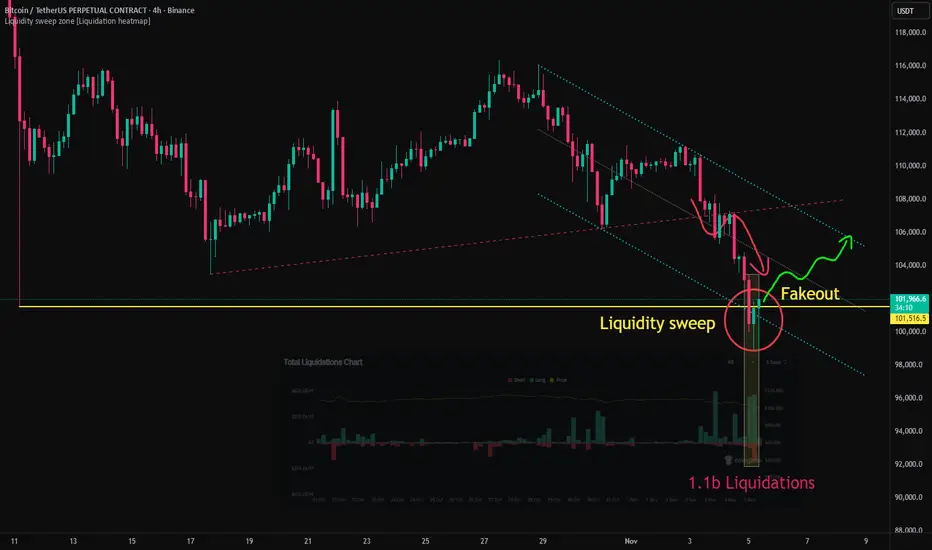
Bitcoin Drops Below 100K, Reversal Signal EmergingAfter breaking below the 107K support level, Bitcoin retested the area and then extended its decline.
As the downtrend intensified, the price broke through 102K, which was the low recorded during the large-scale liquidation event on October 11, and subsequently lost the psychological support level at 100K.
During the eight-hour period of this decline, approximately 1.1 billion USD worth of long positions were liquidated, accompanied by both a liquidity sweep and a fakeout pattern.
The simultaneous occurrence of large-scale liquidations, increased trading volume, a fakeout pattern, and the process of filling the CME gap indicates that multiple short-term reversal signals emerged in this zone.
From a technical standpoint, there is an increasing likelihood of two consecutive bullish candles with long lower wicks forming on the 4-hour chart, while the 12-hour chart also shows a high probability of developing a bullish candle with a long lower shadow.
This suggests a growing possibility of a short-term rebound, with the potential upside target near the upper boundary of the descending parallel channel.
BTC-----Sell around 104500, target 103000 areaBTC Contract Technical Analysis, November 6th:
On the daily chart, yesterday's close was a small positive candle, with a pattern of consecutive negative candles followed by a single positive candle. The price is below the moving average, and the accompanying indicators are in a death cross, indicating a clear downward trend. As previously mentioned, the weekly chart also shows a clear downtrend. Therefore, the strategy is to sell at higher prices and focus on the impact of news and data, avoiding counter-trend trades. On the hourly chart, yesterday's Asian session saw a price rebound from support, which continued into the day, but the momentum was weak and the price failed to break the high. Currently, the Asian session has seen a slight pullback without further continuation, and while the momentum is weak, it doesn't affect the overall trend. The European session is expected to see a further decline and breakout.
Today's BTC Short-Term Contract Trading Strategy:
Sell at the 104500 area, stop loss at the 105000 area, target at the 103000 area.

How to use BTC Coinbase premium index indicator on tradingview1. What is the Coinbase Premium Index?
The Coinbase Premium Index is a metric that measures the price difference between a specific cryptocurrency listed on Coinbase and the price of Bitcoin on other major exchanges (especially Binance).
⌨︎ Calculation method:
(Coinbase BTC price - Other exchange BTC price) / Other exchange BTC price * 100
Positive premium: Occurs when the Coinbase price is higher than on other exchanges.
Negative premium: Occurs when the Coinbase price is lower than on other exchanges.
📌 If this content was helpful, please show your support with a boost and comments. Your encouragement is a great motivator for creating better analysis and content.
We will continue to upload various content such as chart analysis, trading strategies, and Bitcoin short-term signals, so please follow us.
2. Causes of Coinbase Premium
✔️ The main causes of Coinbase Premium are as follows:
Institutional investor demand: Coinbase is one of the largest regulated cryptocurrency exchanges in the U.S., and many institutional investors (hedge funds, asset management firms, etc.) purchase cryptocurrencies through Coinbase.
Large-scale buy orders from institutional investors can temporarily drive up prices on Coinbase, creating a premium.
Fiat currency inflow: Coinbase primarily facilitates USD-based transactions and is the most accessible platform for U.S. investors.
When new fiat currency flows into the cryptocurrency market, a strong inflow through Coinbase can lead to a premium.
Market sentiment and liquidity: If U.S. market investor sentiment is stronger than in other regions at certain times, or if liquidity on Coinbase is temporarily low, a price difference may occur.
Restrictions on fund movement: Due to anti-money laundering (AML) regulations, there may be time and cost restrictions on fund transfers between exchanges.
This limits arbitrage opportunities and helps maintain the premium.
Network congestion and fees: During cryptocurrency network congestion, transaction speeds may slow down or fees may increase, making rapid arbitrage between exchanges difficult.
3. How to Use the Coinbase Premium Index in Trading
The Coinbase Premium Index can primarily be used to predict market trends for major cryptocurrencies like Bitcoin (BTC).
📈 Bull market signal (positive premium):
Institutional buying inflow: A consistently high positive premium may indicate sustained buying pressure from institutional investors.
This can be interpreted as a signal of an overall market uptrend.
Trend reversal: If a negative premium persists in a bear market and then suddenly turns positive or its magnitude increases, it can be seen as a signal that a trend reversal is imminent, along with the inflow of institutional investors and improved market sentiment.
Bottom buying opportunity: If the Bitcoin price is falling and the Coinbase premium starts to rise above 0%, and at the same time, the daily net inflow into ETFs like BlackRock iShares Bitcoin Trust (IBIT) or Fidelity Wise Origin Bitcoin Trust (FBTC) significantly increases, this could signal a strong buying opportunity at the bottom.
📉 Bear market signal (negative premium):
Institutional selling pressure or decreased interest: A consistently low negative premium may indicate high selling pressure from institutional investors or decreasing interest in Bitcoin.
This can be interpreted as a signal of a market downtrend.
Bearish reversal signal: If a positive premium persists in a bull market and then turns negative or its magnitude sharply increases, it could be a top signal, indicating that institutional investors are taking profits or new buying inflows are decreasing.
Overbought/Correction signal: For example, if the Bitcoin price is soaring and the Coinbase premium turns negative, and at the same time, large net outflows are observed from ETFs such as BlackRock IBIT or Fidelity FBTC, it can be judged that the market is overbought or there is a possibility of correction, and a sell position can be considered.
4. Points to Note
🚨 When using the Coinbase Premium Index, pay attention to the following:
Combination with other indicators: The Coinbase Premium Index is just one auxiliary indicator.
A comprehensive judgment should be made by analyzing other technical analysis indicators such as moving averages, RSI, MACD, trading volume, as well as on-chain data and macroeconomic indicators.
Importance of ETF inflow/outflow data: Bitcoin spot ETFs from major asset managers such as BlackRock and Fidelity are one of the most direct indicators of actual institutional investor fund flows.
Analyzing these ETF's daily net inflow/outflow data along with the Coinbase premium can provide a more accurate understanding of institutional buying/selling pressure in the market.
Short-term volatility: The premium can fluctuate rapidly due to subtle changes in the market in the short term.
It is important to observe long-term trends rather than reacting too sensitively to temporary premium changes over a short period.
Changes in market conditions: The cryptocurrency market changes very rapidly.
There is no guarantee that patterns that were valid in the past will necessarily be valid in the future.
Various factors such as regulatory environments, policy changes of major exchanges, and the emergence of new market participants can affect the premium.
Limited scope of application: The Coinbase Premium Index tends to reflect the demand of institutional investors, mainly for Bitcoin. Its influence may be limited for altcoins.
5. Using the Coinbase Premium Index in TradingView
TradingView is a popular platform that provides various technical indicators and chart analysis tools. On TradingView, there are many custom indicators that can monitor the Coinbase Premium Index in real time.
These indicators usually calculate the price difference between Coinbase and Binance spot assets (e.g., BTCUSD/BTCUSDT) and display it in a separate panel at the bottom of the chart.
📊 TradingView indicator usage tips:
Search for indicators: Click the 'Indicators' button on the TradingView chart and type keywords such as 'Coinbase premium' or 'Coinbase vs Binance' in the search bar to find relevant indicators.
Real-time monitoring: These indicators retrieve real-time Bitcoin spot price data from Coinbase and Binance, calculate the premium, and visually display it on the chart. This allows investors to instantly confirm market price differences and incorporate them into their trading strategies.
Combination with other indicators: A powerful advantage of TradingView is that multiple indicators can be overlaid on one chart.
You can add the Coinbase Premium Index indicator along with the Bitcoin price chart, and if necessary, refer to BlackRock and Fidelity ETF inflow/outflow data separately to attempt multi-faceted analysis.
Alert settings: Use TradingView's alert function to set alerts when the Coinbase premium exceeds a certain level or enters/exits a certain range.
This helps to grasp market changes in real time and respond accordingly.
In conclusion, the Coinbase Premium Index is an indicator that can offer insight into the movements of institutional investors in the U.S. market, one of the major players in the cryptocurrency space.
When combined with Bitcoin spot ETF inflow/outflow data from major asset management firms such as BlackRock and Fidelity, it can significantly help to more clearly understand the actual flow of institutional funds and to judge market strength and the possibility of trend reversals.
However, rather than blindly trusting it, it is wise to use it as a supplementary tool to enhance a comprehensive understanding of the market by utilizing it with other analysis tools.

BTCUSDT Review November 6 2025Short-term price movement ideas.
The price has made a monthly liquidity grab of the high, which with high probability should lead us toward the monthly long FVG. At the moment, we’ve seen a weekly liquidity sweep on the long side and left equal lows just before the monthly FVG.
The nearest area from which we can expect a continuation of the downward movement is the daily FVG and BtS zone. In case of a test of one of these zones and confirmation on a lower timeframe, short positions can be considered with the target of taking out the previous low.
Be flexible, adapt to the market, and the results will come quickly. Good luck to everyone.

Bitcoin Weekly Technical Analysis Report $BTCBitcoin Weekly Technical Analysis Report BINANCE:BTCUSDT
Background Overview
Bitcoin (BTC) has become the most influential digital asset globally due to its decentralization, fixed supply, and transparent transactions. At the intersection of traditional finance and the crypto market, Technical Analysis (TA) is a crucial tool for investors to assess price trends and develop trading strategies. Based on the three key assumptions—“history repeats itself,” “price moves in trends,” and “market action discounts all information”—technical analysis uses chart patterns, trend lines, support and resistance levels, volume, and various indicators to make probabilistic forecasts about future price movements.
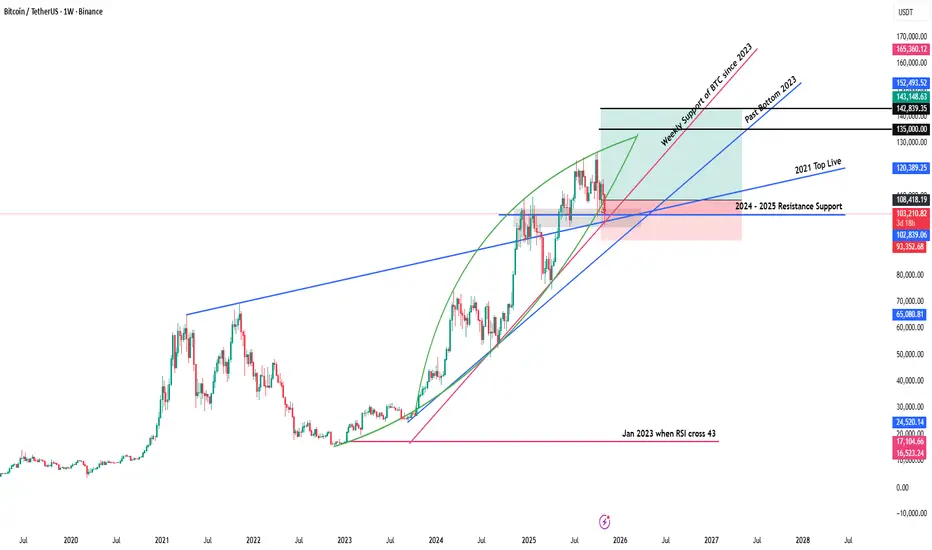
The weekly chart, as a core time frame for medium- to long-term trend analysis, filters out noise from daily and lower time frames, providing a clearer view of the main trend direction, key turning points, and the balance between bulls and bears. The BTC/USDT weekly chart analyzed here (from TradingView) covers price movements from 2023 to the present. It includes annotations such as “Weekly Support of BTC since 2023,” “Past Bottom 2023,” and “2024–2025 Resistance Support,” along with green and pink shaded areas that visually represent different stages of market psychological levels.
Currently, Bitcoin is priced at 103,384.25 USDT, with a weekly decline of -6.47% and a weekly volume of 118,000 USDT. From the chart structure, the price is near the 2024–2025 resistance-turned-support zone while being supported by the ascending trend line that has formed since 2023. The battle between bulls and bears is intense in this range, and price movements over the coming weeks will have a decisive impact on the medium- to long-term trend.
This report will combine key support and resistance levels, trend lines, volume, and technical indicators from the chart, compare historical patterns with the current market environment, conduct an in-depth analysis from multiple perspectives, and propose corresponding strategic recommendations and risk warnings.
Research Support and Evidence Analysis
This analysis is strictly based on the technical elements and relevant market data presented in the chart, with the following key supporting points:
• Current price and change: 103,384.25 USDT, weekly decline of -6.47%, indicating short-term bearish dominance, but the price has not yet broken key support.
• Weekly volume: 118,000 USDT, which has expanded compared to the recent average, suggesting increased market participation and greater divergence between bulls and bears.
• Key support levels:
– “Weekly Support of BTC since 2023” trend line: An ascending trend line connecting the weekly lows since 2023, currently around 100,000 USDT, providing important support.
– “Past Bottom 2023” zone: The 2023 Bitcoin low accumulation area, around 95,000–98,000 USDT, serving as the last line of defense for bulls.
• Key resistance levels:
– “2024–2025 Resistance Support” level: Previous high points where price repeatedly failed to break through, around 110,000–115,000 USDT, now acting as resistance.
– Pink resistance zone: Corresponds to historical accumulation areas and Fibonacci extension levels, around 118,000–122,000 USDT, serving as both a target for bulls and a point for bears to counterattack.
• Trend line analysis:
– Main ascending trend line: Extending upward from the 2023 low with a moderate slope, reflecting the medium- to long-term bullish trend.
– Secondary descending trend line: Connecting the late 2024 and early 2025 highs, forming a short-term descending channel; the price is currently approaching the upper boundary of this channel.
• Volume confirmation:
– When the 2023 support zone formed, volume gradually decreased, indicating easing selling pressure.
– When breaking through resistance in 2024, volume expanded significantly, confirming the validity of the breakout.
– During the current pullback, volume has expanded again, requiring vigilance against panic selling.
Data Comparison and Detailed Summary
To more intuitively present the relationship between key price levels and historical movements, the main support and resistance levels, trend lines, and volume characteristics are summarized as follows:
drive.google.com
From the table, it is clear that the support system formed in 2023 remains effective, while the resistance zone from late 2024 to early 2025 is pressuring the current price. Volume shows distinct patterns at different stages: decreasing at support zones, expanding on breakouts, and expanding again during pullbacks, reflecting cyclical changes in market sentiment.
Source Origin and Citation Interpretation
• Data authority: TradingView integrates real-time quotes from major global exchanges, ensuring the accuracy of price and volume data.
• Annotation professionalism: The trend lines, support and resistance zones on the chart are drawn by experienced analysts based on classic technical analysis methods such as historical highs and lows, accumulation areas, and Fibonacci retracements.
• Time frame representativeness: The weekly chart filters short-term fluctuations and is more suitable for medium- to long-term trend analysis, matching the decision cycles of institutional investors and long-term holders.
For labels such as “Weekly Support of BTC since 2023,” “Past Bottom 2023,” and “2024–2025 Resistance Support,” their origin is the chart drawer’s summary of historical key price levels. Although somewhat subjective, they align with the general definitions in technical analysis for “significant highs and lows” and “accumulation areas.” Therefore, interpretation should combine multiple verifications (such as volume and indicator confirmation) to reduce the risk of bias from single labels.
In-depth Insights and Independent Thinking
Combining the above data and chart features, deeper market insights can be gained from the following perspectives:
The medium- to long-term trend remains healthy
– The main ascending trend line has been extending upward from the 2023 low, and each pullback has not broken below it, indicating that the bullish structure is intact.
– The current price is approaching this trend line. If it can stabilize and rebound here, it will validate the effectiveness of the trend support and lay the foundation for the next upward wave.
The importance of the resistance-turned-support zone
– The 110,000–115,000 USDT zone repeatedly acted as resistance from late 2024 to early 2025. After being recently broken, it has turned into support.
– If the price can stabilize above this zone, it will further consolidate the bulls’ advantage and challenge the pink resistance zone (118,000–122,000 USDT).
Volume signals reveal market sentiment
– Volume decreased at the 2023 bottom, indicating exhausted selling pressure and paving the way for the subsequent rebound.
– Volume expanded during the resistance breakout, confirming increased market participation, while the current pullback’s expanded volume requires vigilance against panic selling.
– Future signs of stabilization with decreasing volume will present a better opportunity for bulls to enter.
Risks and opportunities coexist
– Short-term bears dominate, and the price is approaching the main ascending trend line. A breakdown below could trigger larger-scale stop-losses, targeting the 95,000–98,000 USDT zone.
– If the trend line support holds, combined with oversold signals from technical indicators, a wave of buying opportunities will emerge, with an initial target of 110,000–115,000 USDT.
Macro environment and market structure
– Global liquidity, regulatory policies, and institutional capital flows are exogenous variables affecting Bitcoin’s medium- to long-term trends.
– Although technical analysis can provide probabilistic judgments on price paths, it still needs to be combined with fundamental analysis and market sentiment to improve decision-making success rates.
Extended Discussion / Related Topics
In the current technical context, the following topics can be further explored:
• Multi-dimensional verification of technical indicators
– Relative Strength Index (RSI): Whether the weekly RSI is in overbought or oversold territory, and any divergence with price.
– Moving Averages (MA): The arrangement and divergence of the 50-week, 100-week, and 200-week MAs, and their confirmation of trend direction.
– MACD histogram and signal line: Weekly golden crosses and death crosses, as well as momentum changes in the histogram, indicating trend continuation or reversal.
• Fibonacci retracement and extension
– The role of Fibonacci retracement levels (38.2%, 50%, 61.8%) from the 2023–2024 main upward wave in the current pullback.
– If the price breaks above the pink resistance zone, the next targets can be referenced by Fibonacci extension levels (161.8%, 261.8%).
• Market sentiment and capital flows
– Can data such as futures open interest, funding rates, and exchange net inflows/outflows resonate with chart patterns?
– The impact of continuous buying by institutions like Grayscale and MicroStrategy, compared with the long-short ratio of retail leveraged funds, on medium- to long-term support and resistance.
• Risk management strategies
– Near key support and resistance levels, how to set stop-loss and take-profit to optimize risk-reward ratios.
– When volatility surges, should position size be adjusted, or derivatives like options be used for hedging?
• Future trend outlook
– If the price stabilizes above 110,000–115,000 USDT, the bullish target could extend to 130,000–150,000 USDT.
– If it breaks below the main ascending trend line and loses the 95,000 USDT support, a larger-scale correction may begin, with a downside target around 80,000 USDT.
Through in-depth exploration of the above topics, a more comprehensive investment decision framework can be constructed. On the basis of technical analysis, combining market structure and macro factors will improve the ability to predict price movements.
BTC Price Prediction – Key Support at 98900 Before Next Big MoveBitcoin is currently trading around $105,700, showing a short-term correction after a strong sell-off.
Trendline: A clear descending resistance line continues to hold, capping all recovery attempts.
Break of Structure: The BOS from 109,800 → 103,000 confirms bearish control.
Order Blocks:
🔴 Supply zones: $107,800 → $109,800 and $111,400 → $115,900 — strong resistance where sellers are likely to react.
🔵 Demand zones: $103,000 → $100,000 and a deeper block near $98,900, aligning with a trendline support — potential rebound area.
Volume: Buyer interest weakened after the recent bounce — showing limited demand at current levels.
Bias: Still bearish until BTC breaks above EMA trendline / $107,800 zone.
Next supports are $103,000 and $98,900; resistance levels remain at $107,800 and $111,400.

More sideways/down for $BTC as dictated by Global LiquidityRecent price action in relation to the BGL (Bitcoin Global Liquidity indicator) has got me thinking that the delay has shifted to around 90 days instead of the 72 day default lag. While this may or may not be the case, the BGL (72 and 90 day delay) has correctly called the current downside/sideways price action for CRYPTOCAP:BTC (Note: the BGL has been correctly predicting price action for the entire cycle). If this continues to be correlated, then we will continue to get sideways/down until at least February 2026 (the farthest in the future the BGL can currently "see"). While I root for CRYPTOCAP:BTC to "go up," the BGL says there is currently no end in site to sideways/down.
--Da_Prof

Using Leverage trading BitcoinUsing leverage is the fastest way to blow up your account, especially if you aren’t experienced in this game. We’ve seen hundreds of accounts being liquidated lately
@HyperliquidX
, but if you have discipline and good risk management, you can still profit.
*Not finance advice. DYOR