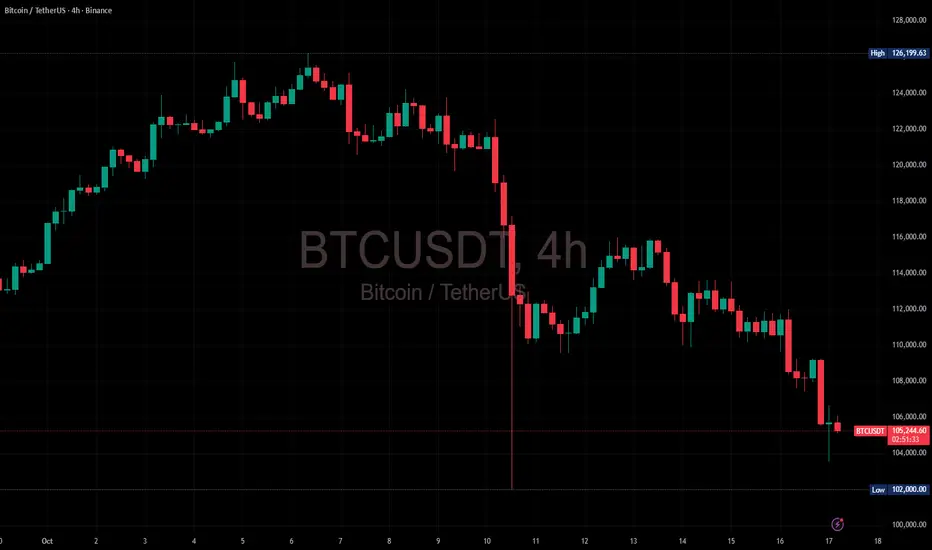
Bitcoin: From Green to Red — A Full Sentiment Shift in MotionAs illustrated in the chart, BINANCE:BTCUSDT has now transitioned cleanly from an uptrend (green candles) to a warning phase (yellow) — a signal that flashed just before Friday’s crash (excellent timing) then red candles.
The latest 4H chart confirms a clear downtrend, with price collapsing from the midline to the lower boundary of a machine-learning–derived trading channel. Selling pressure is mounting, and bears are firmly in control.
This transition is clearly visible in price, but the story doesn’t stop there.
Another ML-based tool, my composite sentiment indicator, turned negative back on Tuesday, October 7th (also great timming) and has since dropped deep into bearish territory. It reflects the emotional cycle turning from optimism to despair, perfectly aligned with the technical deterioration shown in the chart.
Statistically, my propietary trend strength index now reads 0.39 — well below the neutral 0.50 threshold. This means short-term selling pressure is dominating both medium and long-term momentum. The index combines multiple quantitative measures (Hurst Exponent, Sharpe Ratio, variance, and CAGR) to assess how “healthy” a trend really is. At present, it’s anything but healthy.
🧭 Conclusion
BTC’s current structure has progressed in perfect order: bullish → warning → bearish. All three pillars — technical, sentiment, and statistical — are aligned to the downside.
In short, this is not a buy-the-dip environment. Short-term rallies are better viewed as opportunities to enter short positions, not long ones.
A shift to a bullish bias would require all three signals to reverse:
1. Yellow then Green candles reappearing on the price chart (after a yellow phase).
2. A visible improvement in sentiment. (composite indicator returning to positive readings).
3. Statistical momentum index recovering to at least 0.50.
Until then, caution remains the strategy.
If you’d like to discuss building highly effective trading indicators, feel free to drop a comment below.
And if you’re curious about how my main crypto bot is approaching the market right now, check the first comment.
Trade ideas
BTC Long Term Trend: From Warning to Stress Test. Two weeks ago, I highlighted that BTC had transitioned from bullish to warning phase, with yellow candles replacing green, sentiment rolling over, and my proprietary COMPOSITE index collapsing below 0.50. That signal came just before the 10/10 crash, and the structure shifted exactly as expected.
Now, with social media screaming “bear market,” it is time to ask the real question: is this the start of a new downtrend, or a volatility adjusted correction within a still intact macro uptrend?
Let’s break it down across three lenses: Weekly, Daily, and 4H, to separate noise from structure using a rigorous statistical and mathematical framework. Let the science speak.
1️⃣ Weekly Setup: The Long Term Structure
Despite the headlines, the data does not confirm a full reversal yet. The long term channel remains technically upward biased, even though it is clearly under pressure.
Unlike previous corrections that stayed comfortably within the ML channel or barely dipped below its baseline temporarily, this move has pushed price to its lower boundary in a stronger form, even moving the 2 sigma derived white point that I use not only as a stop level but also as a trend indicator. However, despite the unquestionable pressure mounting, price has not broken the structure yet.
The cyan histogram (my Composite Index) on the lower panel tells an even deeper story. Past pullbacks were very well telegraphed by the collapse of the red line, which signaled temporary structural resets. This time it is messy, less coherent, more disorderly, with the red line unable to telegraph a temporary move. This suggests a much more serious test for the long term trend is happening, although the final damage has not been inflicted yet.
🧭 Statistically, this remains an upward system under heavy stress, not a reversed one.
2️⃣ Daily Setup: Tactical Deterioration
On the daily chart, the short term structure has clearly rolled over. Price action closed well below the ML channel baseline, confirming dominance of selling momentum.
My composite sentiment aggregator is more coherent here, clearly tilted to the downside, printing negative readings that are consistent with distribution rather than accumulation. This frame says that bears control the short term flow, but we have not yet triggered the full structural breakdown seen in prior cycle reversals.
3️⃣ 4H Setup: Micro Structure (Swing View)
Zooming into the 4 hour view, we see a textbook micro replica of the daily structure. Price fell hard below the baseline, then briefly rebounded inside the ML channel. That rebound is a technical reaction, not a trend change.
Strictly speaking from a statistical point of view, this current rebound is noise against a broader deterioration visible in higher timeframes. Until the daily and weekly setups recover, every 4H bounce remains a countertrend move, not a reversal.
Conclusion: The Crossroad Moment
We are standing at an inflection point.
Weekly: Upward trend under stress.
Daily: Active short term downtrend.
4H: Temporary rebounds within that weakness.
A sustained break of the weekly ML midline would confirm a deeper phase shift, possibly the start of a true bear regime. Until that happens, this remains a stress test of the long term structure, not its collapse.
If you would like to see how these ML based indicators are built and why they adapt faster than most traditional systems, just ask for it in the comment section below or connect.

Pullback or Freefall? Bitcoin’s Battle Around $100K?Bitcoin dropped below $100K yesterday, setting a new lower low and confirming the ongoing bearish momentum.
Currently, the price is pulling back toward the $105K–$106K zone, which aligns with a key Fibonacci retracement level.
What’s next?
I expect a rejection from this area, followed by a retest of $100K, and possibly a move below that — meaning we might soon see a four-digit Bitcoin again.
As always, this is not financial advice, just a personal market observation.
#BTCUSD #BitcoinAnalysis #Crypto #TradingView #PriceAction

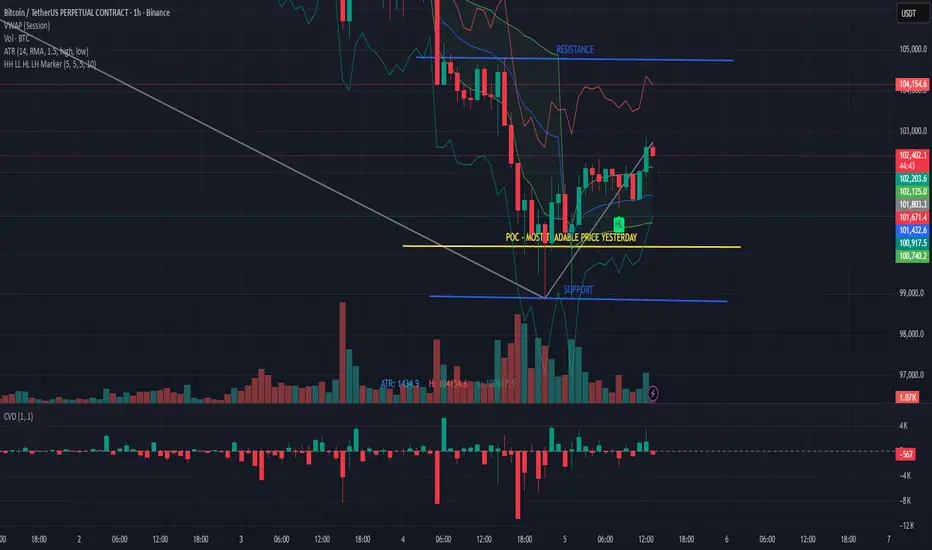
$BTC — Bounce or Bluff?Bitcoin tapped the 98k zone, but 104k continues to act as firm resistance. If this level keeps rejecting into New York close, a deviation toward 97k–96k looks likely before any meaningful retest of the 105k–107k range.
After sweeping liquidity, Bitcoin is showing a modest bullish pullback. Following a sharp move, sideways consolidation tends to be the next phase — forming a new range where both buy-side and sell-side liquidity start to build.
Any rejection around 104k could offer a solid short setup, targeting the 97–96k zone for a potential triple-drive setup.
Conversely, if price stabilizes at 100k and buyers defend it with strength, that’s when long opportunities begin to look more compelling.

When the hell will this end?In recent weeks everyone on the market is in panic. I’ve already seen crazy ideas that Bitcoin will fall all the way to $50,000! Not impossible, of course, but I’m more likely to believe in Bitcoin at $200,000 than at 50.
Let’s figure out what’s actually happening and when this will end.
➡️ The price continues to move in a descending channel, and quite safely at that, not testing the lower boundary of the channel. It is consolidating near the upper boundary, which is a bullish sign.
A divergence is forming in selling volumes, indicating weakening selling pressure.
➡️ Money Flow shows that over the last two days, despite the decline, liquidity has been flowing into Bitcoin. Which means the dip was being bought.
➡️ But the price still hasn’t reached its yearly ascending support, which means the potential for a drop remains.
➡️ Also, focusing on a range-trading strategy, the price is currently in the so-called “premium” zone. And I’m clearly not the only one who’s noticed this.
📌 In the end:
There’s nothing scary about the current decline. It simply removed the excessive overheating from a market that had been rising non-stop for the last 3–4 months. Which basically shouldn’t have happened anyway, since summer is behind us — historically a quiet period.
That’s why I wrote right away in all the reviews that we shouldn’t expect that UPTOBER. I’m actually surprised the correction didn’t start back in September.
If the price doesn’t hold now at the $100,000 level, the next major target is $93,000–92,000.
✍️ Write in the comments: are you buying the dip or selling?

When the hell will this end? In recent weeks everyone on the market is in panic. I’ve already seen crazy ideas that Bitcoin will fall all the way to $50,000! Not impossible, of course, but I’m more likely to believe in Bitcoin at $200,000 than at 50.
Let’s figure out what’s actually happening and when this will end.
➡️ The price continues to move in a descending channel, and quite safely at that, not testing the lower boundary of the channel. It is consolidating near the upper boundary, which is a bullish sign.
A divergence is forming in selling volumes, indicating weakening selling pressure.
➡️ Money Flow shows that over the last two days, despite the decline, liquidity has been flowing into Bitcoin. Which means the dip was being bought.
➡️ But the price still hasn’t reached its yearly ascending support, which means the potential for a drop remains.
➡️ Also, focusing on a range-trading strategy, the price is currently in the so-called “premium” zone. And I’m clearly not the only one who’s noticed this.
📌 In the end:
There’s nothing scary about the current decline. It simply removed the excessive overheating from a market that had been rising non-stop for the last 3–4 months. Which basically shouldn’t have happened anyway, since summer is behind us — historically a quiet period.
That’s why I wrote right away in all the reviews that we shouldn’t expect that UPTOBER. I’m actually surprised the correction didn’t start back in September.
If the price doesn’t hold now at the $100,000 level, the next major target is $93,000–92,000.
✍️ Write in the comments: are you buying the dip or selling?

TradeCityPro | Bitcoin Daily Analysis #211👋 Welcome to TradeCity Pro!
Let’s dive into the Bitcoin analysis. The market is still in a downtrend and has reached its next support!
⏳ 4-Hour Timeframe
Bitcoin finally broke the important support at 106,396 yesterday, and with a very high selling volume, it managed to start its new downward wave.
💥 The RSI oscillator also entered the oversold zone at the same time as the 106,396 break, which was another reason for the market's drop.
⚡️ This downward move has reached the 100,308 support, and the price has calmed down a bit now.
✅ The psychological level of 100,000 is extremely important. Despite the massive selling volume and bearish momentum in the market, buyers haven’t allowed the price to stabilize below this level, and now the market is in a corrective phase.
🧩 After the price reacted to this zone, the volume has significantly decreased, which favors the sellers. If the buying volume remains low, the price will likely start falling again with the entrance of new selling volume.
🔔 However, since the RSI has faked the 30 level and the market momentum could turn bullish, we could see a reversal. If the volume starts to increase and considering the bullish trend on higher timeframes like the weekly chart, we could open a position.
🔍 For now, the first long trigger we have in this timeframe is 111,789. If the price can sharply recover to this level, a very strong bullish trend could begin.
💡 The main resistance zone we have is 115,771, and breaking this level will confirm the start of Bitcoin's new upward wave. We can look to enter the trend after breaking 111,789. If the price builds further structure, we can enter earlier with smaller triggers.
❌ Disclaimer ❌
Trading futures is highly risky and dangerous. If you're not an expert, these triggers may not be suitable for you. You should first learn risk and capital management. You can also use the educational content from this channel.
Finally, these triggers reflect my personal opinions on price action, and the market may move completely against this analysis. So, do your own research before opening any position.

BTC 1D Bitcoin is showing signs of a reversal on the 1-day timeframe, as confirmed by the subtrend support and subsequent momentum.

BTC/USDT Analysis. Testing the Lower Boundary of the Range
Hello everyone! This is the trader-analyst from CryptoRobotics, and here’s your daily analysis.
Since Monday, Bitcoin has moved exactly as expected — heading lower and testing the $105,600–$104,500 support zone (volume anomalies).
Volumes spiked sharply, and some selling pressure was absorbed, but on the second test, the price slid through the level almost effortlessly.
At the moment, Bitcoin is testing the lower boundary of the global range $102,000–$116,000, where we’re observing strong volume anomalies that have triggered a short-term correction.
However, this reaction alone is not enough for a full reversal.
We expect a retest of the push-volume zone $103,700–$106,700, from where seller pressure may resume, leading to a move toward ~$101,000.
Only if that zone shows strong buying defense can we consider long entries.
For now, the bias remains bearish — the market seller is weak, but the price continues to move downward by inertia.
If the $101,000 level fails to hold, the next downside target lies at $97,000–$93,000.
Buy Zones:
• ~$101,000 (volume anomalies)
• $97,000–$93,000 (volume zone)
Sell Zones:
• $103,700–$106,700 (push volumes)
• $109,500–$110,700 (accumulated volumes)
• $112,400–$113,300 (accumulated volumes)
• $114,700–$115,700 (accumulated volumes)
• $120,900–$124,000 (volume zone)
This publication is not financial advice.
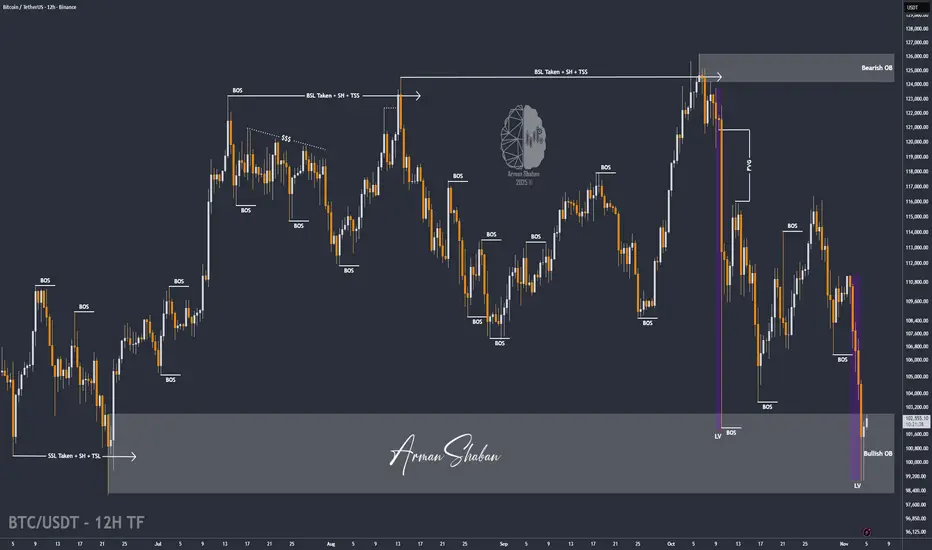
BTC/USDT | Bitcoin Drops 15% in 8 Days – Is Recovery Next?By analyzing the Bitcoin chart on the 12-hour timeframe, we can see that Bitcoin has faced a strong correction over the past few days — dropping nearly 15% from $116,400 to $98,940 in less than eight days.
After sweeping liquidity below $102,000, buying pressure returned, and BTC is now trading around $102,400.
If price manages to break and hold above $104,700, we could see a rebound toward $110K+. Otherwise, Bitcoin may continue its decline toward $95,000.
Please support me with your likes and comments to motivate me to share more analysis with you and share your opinion about the possible trend of this chart with me !
Best Regards , Arman Shaban
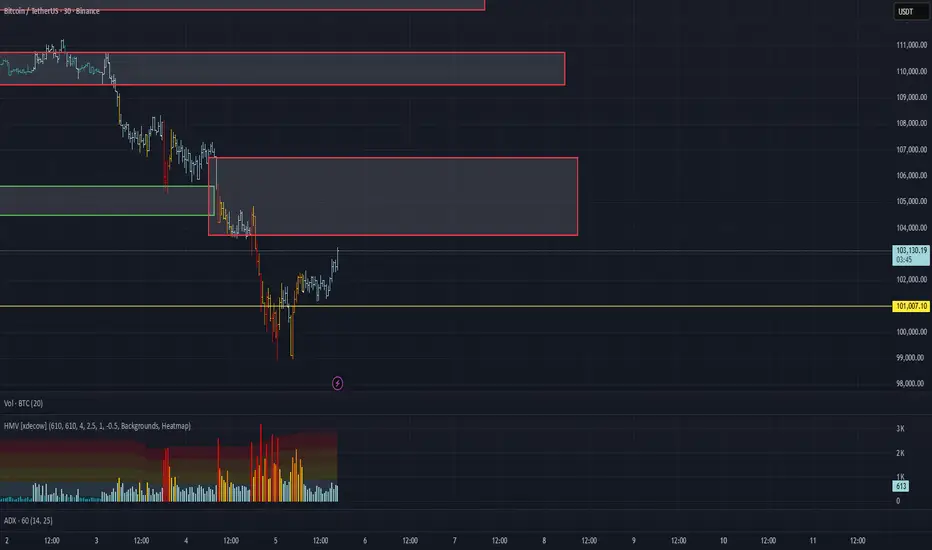
Bitcoin Structure & Order Flow Analysis✅ What the chart is telling us
1) Strong Impulsive Down Move
Large bearish impulse candles
High selling volume
CVD deeply negative → aggressive sellers in control
Main trend is still down.
2) Reversal Reaction at Support Zone
At the local bottom we see:
Increased volume at lows ✔️
CVD flattening ✔️
Multiple failed breakdown attempts ✔️
This area shows buyers absorbing, shorts covering, and early longs stepping in.
3) First Higher Low (HL)
A Higher Low formed following a sharp drop.
✅ First sign of potential trend shift
❗Not a confirmed uptrend yet
To confirm a true reversal we need:
HL → done
HH → minor HH formed
Retest & hold → pending
So far this is only early recovery structure, not yet trend reversal confidence.
4) Key Level: POC + Value Area Low
Price is holding above yesterday’s POC — short-term bullish signal.
However, overhead we have:
Mid-range resistance
102.3–102.6 supply zone
Micro-value high cap
Price is pushing into resistance.
📊 1H Structure Summary
Element Status
Higher timeframe Downtrend
Current structure HL → minor HH
Volume Stabilizing
CVD Recovering (-9k → -380)
Location Retest of POC into supply
Bias Range → early accumulation signs
This is not a FOMO long spot.
This is a range recovery zone, not breakout continuation.
🎯 Trade Scenarios
🔥 Bullish scenario
Looking for:
Minor pullback
Hold 101.90–102.10
Break into 103,000 zone
Best long entry = HL retest after breakout, not here.
❄️ Bearish scenario
Short continuation if:
Price loses 101.90
Drops below Value Low
CVD flips down again
✅ Trader Game Plan
We do not chase here. Patience wins.
Looking for either:
Pullback to 1H demand + bounce → long scalp
Reject from 102.6 + LH on 5m → short continuation
Trade the reaction, not prediction.
Let the market show direction before committing.
📌 Conclusion
Buyers showed life — but still need to prove momentum.
Key levels
Bull defense: 102.0 – 101.9
Breakout confirmation: 102.6+
Bear continuation trigger: < 101.9
Now is the time to wait, not guess.
Patience ≠ weakness — it’s discipline.
BTCCRYPTOCAP:BTC 1W Analysis
Bitcoin has printed a clear Double Top near $120K and broke below the neckline $105K.
Weekly structure turning bearish unless we reclaim that level.
Targets:
T1 - $92K
T2 - $89K
T3 - $84K
Bias: Bearish until weekly close $105K.
#BTC #Bitcoin #Crypto #YodaXCalls

Bitcoin: Sellers Pushed the Price Below the RangeThe price tested the 50% level of the monthly range (100,353)
Hello, traders and investors!
This analysis is based on the Initiative Analysis (IA) method.
On the daily timeframe, the market remains in a sideways range, and the seller initiative managed to push the price below its lower boundary.
The price also interacted with the 50% level of the monthly trading range — 100,353.
These two factors may trigger buying activity and a potential return of the price back into the range.
Within the seller initiative, we can see four seller candles with increasing volume, with the highest volume at the bottom — the IC candle.
To look for buying opportunities, the price needs to return into the range.
Absorption of the seller’s IC candle would be a good sign to start looking for long setups.
Nearest key levels on the daily timeframe:
— Lower boundary of the range — 102,000
— High of the seller candle that broke the lower boundary — 107,299
If we look at the 1-hour timeframe, there’s also a nearby level at 107,672, which corresponds to the 50% level of the hourly trading range.
If buyers start to move, it will be important to watch how they handle the 107,299–107,672 zone.
Wishing you profitable trades!


Crypto is going crazyBitcoin just lost its major daily support — but is it the end or just a reset? Let’s break down the real situation in crypto this November using data, psychology, and Dow theory.

Plan for Bitcoin 130kVery simple analysis following structure, low, high, internal range liquidity (coincidentally aligns with huge weekly fair value gap) then back to new highs
This might take sometime but I'm sat

Bitcoin Losses Hit 9-Month High Of $24 Billion Amid 8% Price DroBitcoin is trading at $101,729 at the time of writing, sitting just above the critical $100,000 support. Earlier, BTC slipped below this level, forming an intra-day low of $98,966 before rebounding slightly.
The recent 8% drop has validated a head-and-shoulders pattern, which projects a potential 13.6% decline targeting $89,948. However, if investors begin buying at lower levels, Bitcoin could bounce from $100,000 and retest $105,000 or higher.
Conversely, continued selling pressure and weak market conditions could send BTC below $100,000 again. A breach under $98,000 may lead to further losses toward $95,000 or lower, undermining any short-term recovery hopes.

Chart Analysis: BTC / USDT (Weekly Timeframe)Pattern: EMA Retest (Potential Breakdown Risk)
The chart shows Bitcoin (BTC) facing notable bearish pressure after recent highs. Price is currently testing the 50-week EMA, a historically important support zone that has previously triggered strong bullish rebounds. However, current momentum shows weakness as sellers dominate.
Key Observations
🔹 Support Zone: Around $100,900 (50 EMA) — acting as critical dynamic support.
🔹 June Low Support: Near $98,200, the next major level to monitor.
🔹 Bearish Candle: BTC down nearly 8% for the week, showing strong selling pressure.
🔹 Bull Bear Power (BBP) Indicator: signaling that bearish strength outweighs bullish demand, and selling momentum remains strong.
🔹 Previous Bounces: The last two retests of the 50-week EMA (circled) led to solid recoveries, but this time, price action looks weaker and sentiment more cautious.
Potential Move
If BTC fails to hold above the 50-week EMA, further downside targets could be:
🎯 Target 1: $95,000
🎯 Target 2: $90,000
Conversely, a strong bullish reaction from the 50 EMA may spark a rebound phase and signal renewed accumulation.
Summary:
Bitcoin is currently at a critical support retest on the 50-week EMA. The Bear Power indicator suggests growing downside pressure, and a weekly close below $100K could confirm a deeper correction. Holding this zone, however, might preserve the broader uptrend.
#Bitcoin #BTC #BTCUSDT #CryptoAnalysis #TechnicalAnalysis #TradingView #CryptoTraders #CryptoMarket #BullBearPower

Bitcoin ShortBitcoin is looking to retest the 98200 support and if broken, would be headed to 76550-75000 area on this current weekly structure. Be careful guys.

BTC continues to correct below 100k🟠 BTCUSD Technical Plan
Current Price: 101,960
Overview: BTC continues to follow a downtrend structure, with each lower high being rejected from the descending trendline (marked with red arrows). The market recently broke below key Fibonacci support and is now trading around the 1.0 extension level near 100,950.
📉 Short-term Expectation:
Price may retest the broken support zone around 104,700 – 105,800 (Fib 0.5–0.618 + EMA zone).
This area is expected to act as strong resistance where sellers may re-enter the market.
If the rejection is confirmed, BTC could continue dropping toward the 95,200 – 94,700 support zone (1.618 extension).
📈 Alternative Scenario (Bullish Correction): If price breaks above 105,800, a short-term correction could extend toward the trendline resistance near 111,400 before another potential reversal.

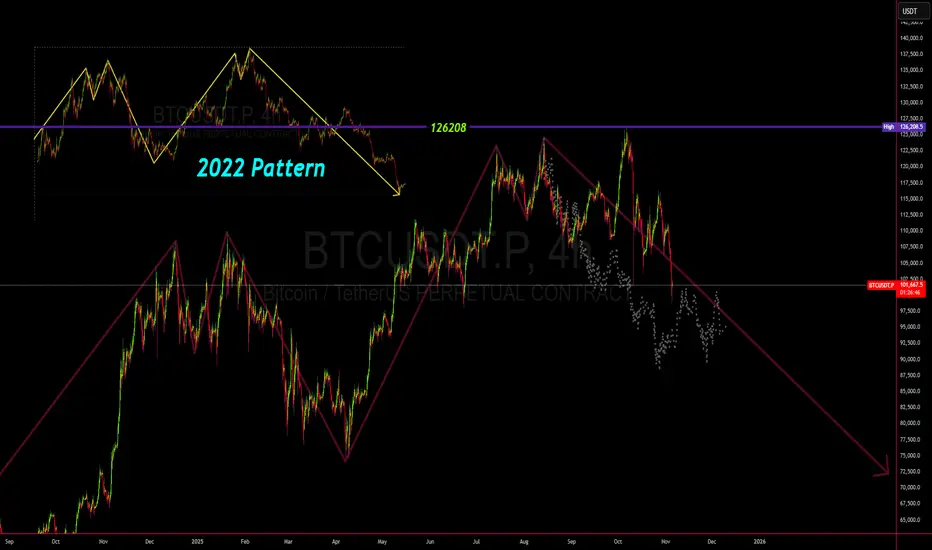
Bitcoin 2022 Pattern Has Returned – History Never LiesYou can call it coincidence.
You can call it manipulation.
But this pattern — this rhythm — never breaks its cycle.
Back in 2023, I showed you how the same structure played out before the major rally.
Now, look closely… it’s here again. The same shape, the same psychology, only larger.
The spike to 126,000$ was the trap — the “fake high” to make the smart ones doubt themselves.
And now? The structure is completing… with one direction left open.
📉 Target Zone: 65,000 – 70,000$
🧠 Pattern Type: Macro Fractal / 2022 Replica
💡 Message: Markets don’t repeat by chance — they repeat by design.
Every move, every wick, every trap — drawn by the same invisible hand that drew it three years ago.
The bots are working, the script is running, and the crowd still doesn’t see it.
History doesn’t just rhyme.
It copies and pastes.
Bitcoin update + new setupsETH was leading the move to sweep the lows, and it did.
Now that both BTC and ETH have cleared liquidity below the previous lows, we have new setups, depending on the confirmations at key S/R levels.
⚠️ These setups are based on a bounce scenario toward the SSL. Setups become invalid if the market drops further toward the lower Pivot areas. When that happens, a new update will follow.
BTC: (When support confirmed above SSL)
- Entry around SSL ~103540
- tp1 ~104900
- tp2 ~106200
- close ~108200
- stop depends on previous low when support confirmed above SSL
BTC: (When SSL is rejected and confirmed)
- DCA around SSL ~103500-102500
- tp1 ~100600
- tp2 ~98900
- close ~104800
Note: Don't forget to take partial profits on the way to secure your trade.

Need to see if it can rise above 104463.99
Hello, fellow traders!
Please "Follow" to always get the latest information quickly.
Have a great day.
-------------------------------------
(BTCUSDT 1D chart)
The price declined from the DOM(-60) indicator level of 106431.68, but the DOM(-60) indicator is still forming at 106431.68.
Therefore, the 106431.68 level can be considered a low point.
Therefore, we need to observe how the price moves during this volatile period, around November 4th-9th (maximum November 3rd-10th).
Since it fell below the critical 104463.99-108353.0 level, if it fails to rise above this level, we should check for support near the next critical level of 89294.25.
At this point, the M-Siganl indicator on the 1M chart is passing through a critical zone, so it's expected to re-establish the trend once it meets the M-Siganl indicator on the 1M chart.
If the OBV indicator falls below the Low Line and fails to rise again, it's likely to touch EMA 3.
For the price to break above a critical point or zone and continue the uptrend,
1. The StochRSI indicator must be rising. Ideally, it should not be in an overbought zone.
2. The TC (Trend Check) indicator must be rising. Ideally, it should remain above the zero level.
3. The OBV indicator must be rising. Ideally, it should remain above the High Line.
If the above conditions are met, the upward trend is likely to continue after breaking above a critical point or zone.
Currently, the price is moving against the above conditions, so there's a possibility of further decline. However, given the volatility, it's better to wait and see rather than assume a decline.
-------------------------------------
I'm curious about what will happen next, but there's no way to know for sure.
However, as I've repeatedly mentioned, if you're trading according to a basic trading strategy that suits your investment style, I believe you'll be able to trade according to your strategy, whether the current decline continues or rebounds and rises.
As I mentioned in a previous idea,
- If a daily decline exceeds -10%, a rebound is highly likely,
- If a daily increase exceeds +10%, a reversal is highly likely.
Therefore, if you're familiar with scalping or day trading, you can profit from trading.
However, you must sell at that profit to lock in your profits.
The basic trading strategy I mentioned is to buy in the DOM(-60) ~ HA-Low range and sell in the HA-High ~ DOM(60) range.
Furthermore, we can respond based on the support and resistance levels identified on the 1M, 1W, and 1D charts, which are important areas.
Therefore, the current available support levels are the 104463.99-108.353.0 and 87814.27-93570.28 levels.
The remaining support and resistance levels can be used as trading opportunities.
In other words, these are points for securing profits.
-
Due to this decline, the HA-High indicator on the 1M chart is showing signs of forming at the 110105.69 level.
Therefore, if there is a rebound, the 110105.69 level could potentially serve as resistance.
However, as the price rises, the HA-High indicator on the 1M chart could return to its previous HA-High level.
Therefore, we need to determine if support is found in the 104463.99-108353.0 range and consider a response plan accordingly.
-
If the price falls below the M-Signal indicator on the 1M chart and remains there, there's a possibility of a downtrend, so we should also consider a response plan.
The coin market operates in decimals, allowing for more flexible trading than the stock market.
This means that by trading at a buy price, you can profit even if you're losing money and increase your coin (token) holdings.
For example, if you bought $100 at $101,000, you could sell $100 (including transaction fees) when the price rises, increasing your profit.
By increasing your profit, you can quickly turn a loss into a profit.
If you bought $100 at 101,000 and only had 0.1 coins (tokens), you could sell those 0.1 coins and generate a cash profit if the price rises and you're making a profit.
However, this method is only applicable if you won't be trading that coin (token) again.
In other words, if you sell 100% of your holdings, you'll need to wait until the next price fluctuation, or you could end up making a worse trade.
Therefore, if possible, it's best to trade with the same amount you bought, increasing the number of coins (tokens) that represent your profit.
Don't think you should just leave the coin (token) you're losing and trade another coin (token) to make a profit.
This could actually lead to further losses.
-
Thank you for reading to the end.
I wish you successful trading.
--------------------------------------------------
- This explains the big picture.
(3-year bull market, 1-year bear market pattern)
I will explain in more detail when the bear market begins.
------------------------------------------------------
