BTC critical !!!! Daily chartSo previous setup played out unfortunately to the downside ,we are in a critical stage for BTC, Currently pricing at
$89 000.00 at time of analysis so we hope for a bounce upwards and at least a close on the weekly above the $92 000-$94 000.00 if we can not do that I suspect more downside. Please leave comments and share ideas.
Good luck to everyone.
Trade ideas

Whats your thoughts on this bitcoin idea back to highs? In my opinion BTC is pulling back very nicely and i do think it could have a bounce from this area, if it does not bounce from this area i would risk an absolute mortgage at 60 to 65 thousand. What's your analysts?
BTCUSD relief rally Bitcoin reaching oversold on 3D timescale RSI. Overbought / oversold indicator triggered. Bounced off the MA. Temporary relief rally over the weekend probable. 96k is the next overhead resistance, approaching that resistance provides further selling opportunities for bears going into the new week.
If Bitcoin breaks below $82000 on Monday when the markets open, $76500 is the next support from the most recent mid-term low. $71000 would be the next support should that break.
I am doubtful that bulls regain control, however, a short term relief rally could be in play.

Respect to All Iranian Traders Holding Strong Against Market noiRespect to All Iranian Traders Holding Strong Against Market Noise”
BTC Daily Breakdown
This analysis is dedicated to all my Iranian traders who keep pushing forward, even though TradingView doesn't always give enough visibility to symbols from our region.
We continue learning, improving, and trading with discipline — and that’s what truly matters.
In this chart, price tapped into a key bearish rejection block, failed to reclaim the zone, and continued breaking structure to the downside. The liquidity beneath the previous lows acted as a magnet, and the bearish orderflow remains in control as long as price stays below the rejection zone.
I’ve learned a lot from many international traders whose work has helped strengthen my technical approach.
Much respect to these analysts for their educational content and smart analysis:
@TraderMo @CryptoJelleNL @NaiimTrades @MayfairVentures
@NateFX @LSTraders @CryptoMellany @PAULSTUDY
@MarkCullenFX @KledTrading @TheSignalyst @TraderJupiter
@BrettCrypto @ChartPrime @RJR_Trading @CryptoBrrr
@ZenTradingTech @ElliottWaveStreet @EdgeTrading @Bitcoinsensus
Their insights helped me refine my structure-based approach, especially on BTC’s daily chart.
If you’re from Iran or anywhere else in the world, feel free to drop your view below —
we grow together, we build together.

BITCOIN Short term view What do you think guys about this trade...we are going to capture 3000 pips....A one hour strong bullish candle is confirmation....

$BTC Approaching Red Box ~ This Is the Make or Break Moment!CRYPTOCAP:BTC is moving exactly as expected it’s now approaching marked red box.
We got the pump, prev high broke, retest came in, and another push followed.
This red box is a key supply zone.
If CRYPTOCAP:BTC gives a strong candle close above it, then we can expect more upside move ahead. 📈🔥

Could Bitcoin do another .79 retracement? The last major cycle saw bitcoin top & retrace to about the .79 level before strong buying interest re-entered it's market & propelled it to its most recent new highs. Could the start of a deeper correction be currently underway? 🤔

BTC higher (?)As you can see we are at a major pivot point that can bring BTC at 10500 ish and then will be interesting to see if could break above this immaginary rainbow

btc Based on the current Bitcoin chart, I believe that Bitcoin has attempted to reach the upper boundary of its channel but may not succeed. It is likely to reverse its upward trend and shift to a downward trajectory near the $120,000 mark.
"It’s possible that altseason might be starting soon."

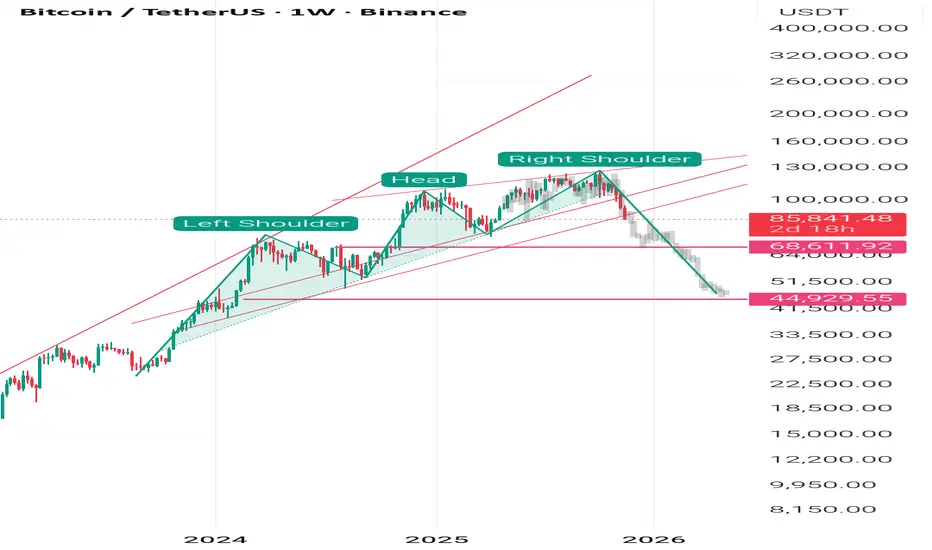
Bitcoin’s Head and Shoulders Pattern Signals a Possible Drop to Bitcoin’s current price action is far from healthy, and it could easily complete a Head and Shoulders pattern, leading to a correction down to the $40,000 range. While many may find this hard to accept, it’s time to face the reality: Bitcoin and other cryptocurrencies are no longer what they used to be, and altcoins are unlikely to experience another true altseason.
In 2025, the crypto bubble finally burst, revealing that digital currencies have far fewer real-world applications than promised, and public interest has faded. I’m saying goodbye to cryptocurrencies and shifting my focus to the Forex market. I will never “HODL” again, as this market has proven itself to be one of the dirtiest in the world.
Just about four weeks ago, the crypto market crashed in a way no other market does a clear sign of the disastrous manipulation by entities like Binance, which create extreme price traps to liquidate traders.
[LONG] BTCUSDT - BUY OPPORTUNITY1. Buy Phase 1 around $90 - 91k
2. If BTC go down under $90k, we will plan for another buy Phase for Long


BTC breakdown will touch 69,000$ till March 2026As u see in my video i predicted the BTC price moves until 2027. So it will touch 69,000$ till March 2026 and will go down till 58,000$ July 2027 before starting a bold bullish. Also, guys I'm looking forward to know ur opinions on this.

BTC 71,689.50 — The Capital Sector. Price Slice. 23.11.2025 Capital Sector. Price Slice. Dated 23.11.2025
74,715.11 USD — not yet reached as of publication.
71,689.50 USD — not yet reached as of publication.
Esteemed international community,
I demand your unequivocal attention: as the sole Architect of the Capital Sector and originator of the Price Slice methodology, I hereby attach to this publication documentary evidence confirming the integrity of my analytical architecture.
On 16.10.2025 , I formally designated the sector with a Price Slice at 71,689.50 USD .
Original screenshot:
TradingView publication:
Across global timeframes, we observe the instrument’s deliberate inclination toward retesting the specified level —not a coincidence, but a structural imperative.
All prices I publish represent capital’s intent , not speculative hypotheses.
Until the instrument physically touches these levels on their respective timeframes, these precisely carved and calculated values remain absolute . Each price carries its own temporal projection—disregard of this principle leads to analytical collapse.
Study the logic of my work:
Institutional capital does not follow charts—it draws them.
It fabricates deceptive candles tailored to your indicators, feeding you illusions.
I, in turn, reveal to you the pre factum method —analysis of the future before it manifests.
The question is not where price is heading .
The question is which Price Slice to select within the context of the global trend .
The Map of Unexecuted Prices is your strategic instrument. Deploy it with precision.
English is not my native language. I formally apologize for any stylistic imperfections—yet I emphasize: the essence of my analytics remains unaltered across any translation. It is as immutable as market structure itself.

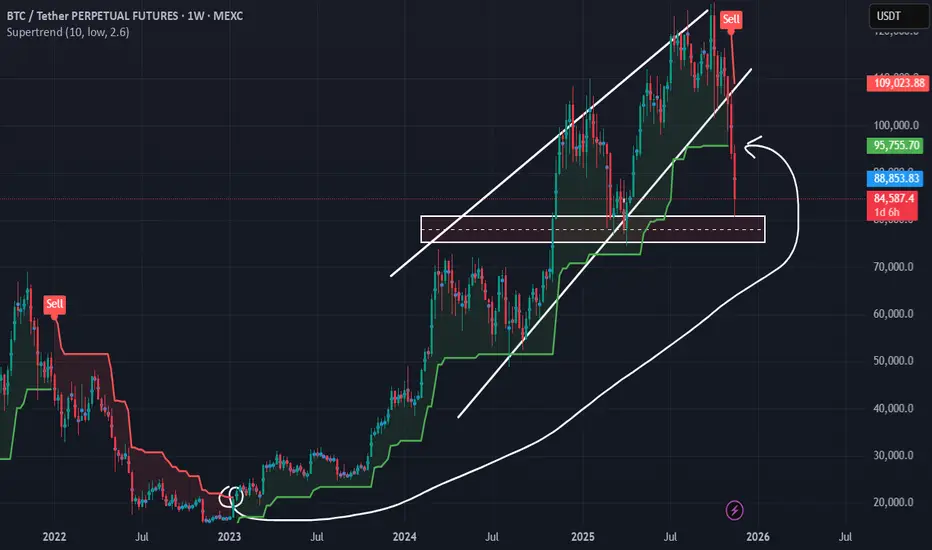
Is the Bullrun Over? Time to Dive Down?Is the Bullrun Over? Time to Dive Down?
Weekly Supertrend Turns Bearish After ~1043 Days — What This Means for BTC
The crypto market is flashing serious warning signals, and one of the most important comes from the weekly Supertrend indicator. Using the parameters ATR Length = 10 and ATR Multiplier = 2.6 , the Supertrend has now flipped bearish again — and notably, this is happening after roughly 1043 days of staying on the bullish side.
On higher timeframes like the 'weekly chart', a Supertrend flip is not a short-term signal. It typically represents a **macro shift in market structure**, and such shifts don’t resolve quickly. When a weekly Supertrend turns bearish after such an extended bullish period, the market often enters a prolonged phase of consolidation or decline.
In other words:
This is not a dip — it’s a structural warning.
Price is likely to stay in weakness for a long time unless a major reversal invalidates the signal.
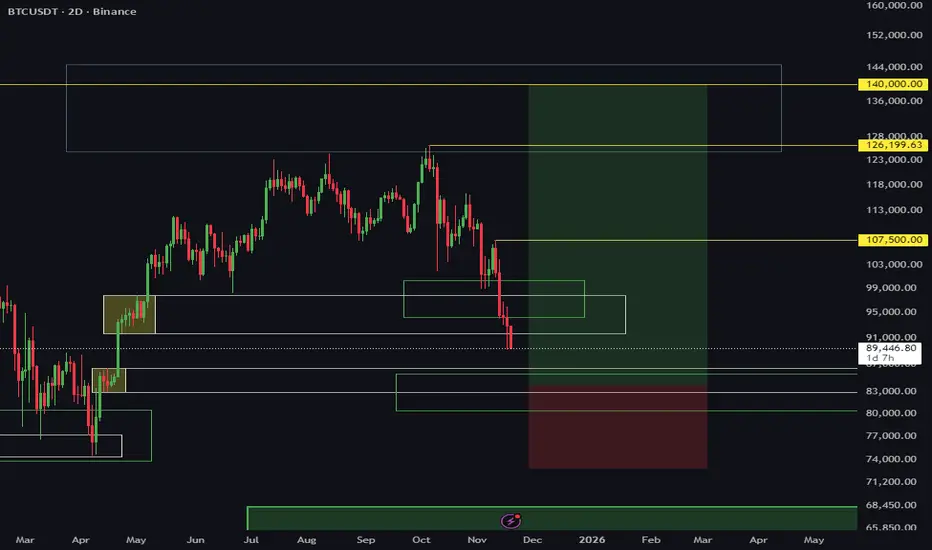
#The Critical Range: 75,100 – 80,750
I’ve drawn a key horizontal range between:
Lower bound: 75,100
Upper bound: 80,750
This is the zone BTC is likely to **test and re-test** while the weekly Supertrend stays bearish.
#Why this range matters:
* It served as a **liquidity pocket** and structural support.
* It aligns with price memory where strong bids previously entered.
* With weekly momentum now flipping negative, price will likely **grind into this zone** as buyers attempt to defend it.
Expect choppy, frustrating, sideways price action — ranging, wicking, and retesting — as the market decides whether the bull cycle can resume or not.
# If This Range Breaks… Things Could Turn Ugly
The real concern comes if BTC **breaks below 75,100** with conviction.
A breakdown from this range would mean:
* The weekly Supertrend remains firmly bearish.
* Market structure shifts from **distribution to full decline**.
* Long-term holders start derisking.
* Liquidity gaps below begin opening up.
### If 75,100 fails, BTC is not just correcting — it is entering a very, very extended downtrend
You could see:
* Multi-month decline
* Slow bleed into macro supports
* Possible cycle-top confirmation
This wouldn’t be a quick drop; it would be the start of a **long, grinding bearish phase** — similar to previous cycle tops where the market slowly unwound months of overextension.
# Conclusion
The weekly Supertrend (ATR 10, Multiplier 2.6) flipping bearish after ~1043 days is a **major macro signal**, not a noise event. BTC is likely to:
1. Stay weak for an extended period,
2. Range between 75,100 and 80,750,
3. Retest that zone multiple times, and
4. Potentially start a very long bearish phase if the range breaks to the downside.
This is the first genuine macro warning we’ve had in a long time — and the market is finally reacting to it.
Note: This analysis on BTC Market with Price Action and SuperTrend of mine is polished and made ready to publish by ChatGPT, but the key idea and analysis data was given manually
Asif Hassan Risan
23 November,2025


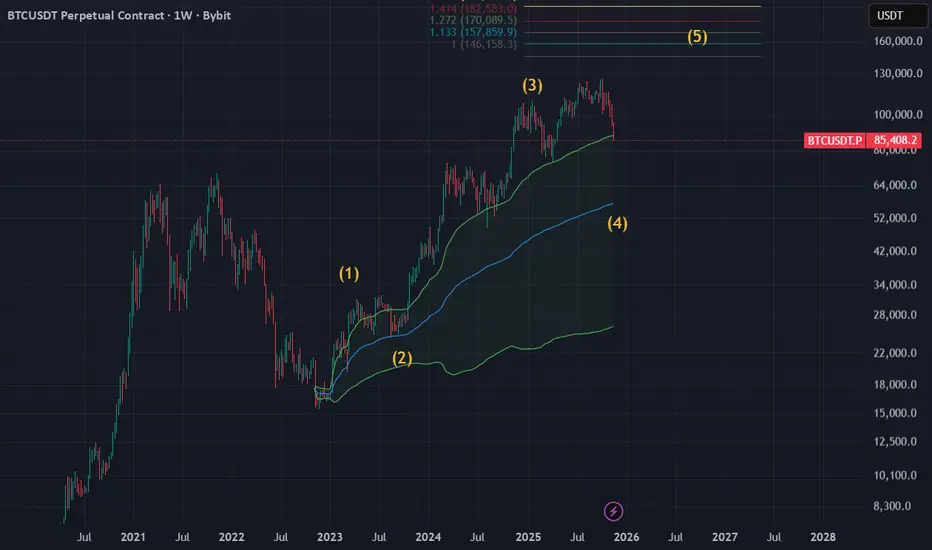
Don't be fearful.We are at Wave 3 correction.150k-200k at Wave 5As we can see on the MACRO LOG scale of this asset, subwaves for each big waves are clearly seen. We look at this dump as a blessing; not something to be feared of. We stay patient for where this dump goes and simply trade it.
Simply looking at the chart, vwap says 50k-ish is a very good zone to look into. Much much happy to come in if we visit below 50k with a failed auction to jump in.
Ofcourse, this is a very much big swing idea that does not mean too much for trading levels.
This approach is for investors who simply see bitcoin as an asset.
For a trader like us on this website, we must look on intermediate levels.
Goodluck traders!
SELL BITCOIN It's ready for the drip just needs to fill some ob- and fvg within the four hour ob-
Keep watching and good luck good trading

BTC Short until ETF Intro prices.See Idea. No further comments. NFA DYOR.
We are exiting the Bullrun for the 1 year bear market as usual each cycle. No need to overcomplicate it.

TradeCityPro | Bitcoin Daily Analysis #224👋 Welcome to TradeCityPro!
Let’s dive into the Bitcoin analysis. The market has continued its downward movement and has reached its next support level.
⏳ 1-Hour Timeframe
Yesterday, after breaking the 93,965 zone, Bitcoin started a downward move, which extended to 89,603.
⚡️ The main support zone for the price, in my opinion, is 88,262, which the price hasn't yet reached, and it was supported at 89,603.
✨ Currently, the price is making a bullish correction and has retraced to around the 0.382 Fibonacci level.
✔️ The 91,608 zone is very important, and if the price can stabilize above it, the likelihood of forming a V-pattern increases significantly.
🔔 If the price moves sharply upwards and stabilizes above 95,766, we will get confirmation of the activation of this pattern, but currently, the price is still far from it.
📊 For today’s long position, we can consider entering if the 89,603 level breaks, but with very low risk, as the price has already made its move, and I believe we are in a correction phase now.
🎲 If the upward move continues, I think we could open a long position tomorrow. Otherwise, the next trigger is 95,766.
❌ Disclaimer ❌
Trading futures is highly risky and dangerous. If you're not an expert, these triggers may not be suitable for you. You should first learn risk and capital management. You can also use the educational content from this channel.
Finally, these triggers reflect my personal opinions on price action, and the market may move completely against this analysis. So, do your own research before opening any position.


BTC & USDT.D - Who Follows Who?The eternal question in crypto, does Bitcoin lead USDT.D, or does USDT.D dictate Bitcoin’s moves?
At the moment, both charts are approaching critical inflection points.
CRYPTOCAP:BTC is retesting the $90,000 support, while CRYPTOCAP:USDT.D is nearing the 6.4% resistance.
As long as BTC holds above $90K and/or USDT.D remains capped below 6.4%, the bulls can still take over, paving the way for another impulsive rally across the crypto market.
But if these levels break… we may be in for a deeper correction before the next leg up.
So, who will make the first move? 🧩
⚠️ Disclaimer: This is not financial advice. Always do your own research and manage risk properly.
📊All Strategies Are Good; If Managed Properly!
~Richard Nasr
