SELL BTCPrice tapped into the previous distribution zone and reacted from the 0.786–0.88 premium levels, showing clear signs of exhaustion.
A clean CHoCH formed on the lower timeframe, followed by a pullback into the mitigation zone where short positions become valid.
The entry is placed at the retest of the supply zone, with a stop above the recent sweep and targets reaching the lower liquidity levels around the 0.0 Fibonacci extension.
This setup follows:
Premium pricing for short positions
Liquidity sweep of the previous high
Break of structure (CHoCH)
Retracement to the imbalance + supply zone
If price maintains below the mitigation zone, continuation to the downside is expected.
Trade ideas

🇺🇦BTC/USDT — Weekly Outlook BTC/USDT — Weekly Outlook
✔️ The week closed with a bearish candle with a lower wick. Buyers are active but lack strength.
🟢 Historical RSI and fear levels — typically reversal or strong bounce zones.
🟢 Open Interest (OI) is at cycle lows, similar to 2022.
🟢 QT officially ends in one week. Market conditions may ease once liquidity stops being drained. Next step — QE.
🟠 Significant ETF outflows, but total inflows in 2025 remain $44.4B.
🟠 Many are waiting for 70–60–50–30k entries. Will the market offer them?
🔴 No sharp bounce so far. Probability of a bullish divergence or reversal pattern increases if we get one more leg down.
🔴 The shortest bear phase in history lasted ~1.5 months — that’s the most optimistic reference.
🔴 Negative cumulative delta: –$1.75B.
🧠 A real trend reversal needs a strong catalyst.
QE is the most anticipated, but not the only option.
Until then — accumulation and further unwinding.
✔️ Тиждень закрився ведмежою свічкою з тінню сзнизу. Покупець бореться, але сил недостатньо
🟢 Історичні рівні RSI та страху. Зазвичай це зони розвороту або сильного відскоку.
🟢 Відкритий інтерес (OI) на мінімумі - на рівнях 2022 року.
🟢 Через тиждень офіційно завершується QT. Ринку стане легше дихати, коли припинять вилучати ліквідність. Наступний крок - QE.
🟠 Великі відтоки з ETF. Але сумарні притоки за 2025 рік — $44.4 млрд.
🟠 Ті, хто не купує зараз, чекають біткоїн по 70–60–50–30k. Чи дадуть?
🔴 Різкого відскоку не було. Зростає ймовірність формування конвергенції або розворотного патерна через ще одне зниження.
🔴 Найкоротша ведмежа фаза в історії тривала 1.5 місяці - це найоптимістичніший орієнтир.
🔴 Від’ємна кумулятивна дельта (-$1.75 млрд)
🧠 Для реального розвороту потрібен потужний інфопривід.
QE - найбільш очікуваний, але не єдиний варіант.
До його появи - аккумуляція та додаткова розмотка.

TradeCityPro | Bitcoin Daily Analysis #225👋 Welcome to TradeCity Pro!
Let’s jump into today’s Bitcoin analysis. After the pullback to 93,555, Bitcoin has moved into a ranging phase.
⌛️ 1-Hour Timeframe
Yesterday, after reaching its support zone, Bitcoin made a corrective upward move and pulled back to 93,555.
💡 Right now, after completing that pullback, the price has dropped back down to 90,489 and has shown a reaction to this level.
✔️ As you can see, selling volume has been increasing during this move, and we haven’t seen any significant buying volume enter the market yet.
✨ Today’s trigger for opening a position is the break of 90,489.This is a suitable trigger for a short position, and breaking it could be the start of the next bearish leg.
⭐ If the move toward 90,489 comes with increasing volume, we can even enter earlier using a candle setup, before the full break happens.
📊 For a long position, it’s still too early.We first need to see the price stabilize above 93,555, and only then we can look for long triggers.
❌ Disclaimer ❌
Trading futures is highly risky and dangerous. If you're not an expert, these triggers may not be suitable for you. You should first learn risk and capital management. You can also use the educational content from this channel.
Finally, these triggers reflect my personal opinions on price action, and the market may move completely against this analysis. So, do your own research before opening any position.

Lingrid | BTCUSDT Potential Brief Recovery Key Support ZoneThe price perfectly fulfilled my previous idea . BINANCE:BTCUSDT is pressing into the key support zone near 92,000, where price previously created a major reaction and where a fresh bullish divergence is forming. The market structure shows a clean downward channel, but price is stabilizing inside a localized compression at the bottom of the range. A rebound from 92,000 keeps the door open for a short-term rally toward the 100,500 resistance as long as buyers defend the zone. Momentum remains bearish overall, but the divergence suggests a corrective bullish swing is likely before trend direction resumes.
⚠️ Risks:
Breakdown below 92,000 invalidates the bullish rebound and exposes deeper downside.
Strong continuation of the macro downtrend may override divergence signals.
Failed reaction at mid-range resistance could stall the bullish leg earlier than expected.
If this idea resonates with you or you have your own opinion, traders, hit the comments. I’m excited to read your thoughts!

Bitcoin Faces the Death Cross — More Pain Ahead?Considering Bitcoin ( BINANCE:BTCUSDT )’s recent movements over the past few days and the Death Cross will happen to BTC, I’ve decided to focus on a daily time frame for today’s analysis. Given the recent events in the U.S. market, especially the sharp decline in the S&P 500 ( SP:SPX ), it’s likely that this downward trend will continue .
What is a Death Cross?
A Death Cross occurs when the 50-day moving average crosses below the 200-day moving average, often signaling a potential bearish trend.
At present, Bitcoin broke the important weekly Support lines and is now breaking a critical Support zone($101,500-$98,200) .
Moreover, considering the correlation with the S&P 500 index, and the fact that the U.S. indices are beginning to recover, it’s unlikely that Bitcoin will decouple from this trend. Therefore, we can anticipate further decline in Bitcoin as well .
Additionally, the rising USDT.D% ( CRYPTOCAP:USDT.D ) is breaking through resistance levels, which can lead to further selling pressure in the crypto market .
In summary, I expect Bitcoin to lose its current Support zone($101,500-$98,200) soon and move towards the Cumulative Long Liquidation Leverage($93,300-$91,300) .
Note: In these times, it’s crucial to maintain strict risk management, as Bitcoin’s volatility has increased. It might also be wise to consider higher time frames for trading to better navigate this complexity.
First Target: $95,720
Second Target: $93,040
Stop Loss(SL): $106,000
Cumulative Short Liquidation Leverage: $112,590-$111,459
Please respect each other's ideas and express them politely if you agree or disagree.
Bitcoin Analysis (BTCUSDT), Daily time frame.
Be sure to follow the updated ideas.
Do not forget to put a Stop loss for your positions (For every position you want to open).
Please follow your strategy and updates; this is just my Idea, and I will gladly see your ideas in this post.
Please do not forget the ✅' like'✅ button 🙏😊 & Share it with your friends; thanks, and Trade safe.

Bitcoin - The Calm Before the Next Wave?📉Bitcoin has entered yet another correction phase within its long-term rising channel, following the same rhythm we’ve seen in previous cycles.
Each major correction (highlighted in red) has historically been followed by a strong bullish impulsive move from the lower blue trendline, and this time, price is once again testing that key structural support.
🔁If history repeats itself, this could be the final retest before a major rally toward the upper boundary of the channel, potentially aligning with the next cycle’s exponential phase.
Will Bitcoin bounce from this level one more time, or is a deeper correction still on the table? 👀
⚠️ Disclaimer: This is not financial advice. Always do your own research and manage risk properly.
📊All Strategies Are Good; If Managed Properly!
~Richard Nasr

TradeCityPro | Bitcoin Daily Analysis #228👋 Welcome to TradeCity Pro!
Let’s move on to the Bitcoin analysis. After the sharp drop we had throughout the week, the market has finally calmed down today and is moving sideways.
⏳ 1-Hour Timeframe
After the strong downward move earlier this week, the market has made a small correction today.
✔️ This correction came after reaching the 82,214 support level, and as you can see, the buying volume during this correction is extremely low.
✨ This shows that buyers are very weak.
On the other hand, as you can see, the red candles are starting to show increasing volume again, and if this continues, we can open short positions using short triggers from the lower timeframes.
💥 The RSI oscillator bounced from its support yesterday and is now below the 50 level.
A rejection from this zone can introduce new bearish momentum.
🔔 The main short trigger right now is 82,214.
However, this trigger is very risky because it is close to a very strong support zone, and there is a high probability that buyers may attempt to enter the market there.
📈 For long positions, there is currently nothing to discuss, the market needs to form a proper bullish structure first.
Our confirmation for a bullish trend comes only after price stabilizes above 89,000, which is still very far from the current level.
💡 Right now, the price hasn’t even corrected up to the 0.382 retracement of the previous wave.
This alone shows that buyers have not entered the market yet.
So for long setups, we must wait until buyers return, show strength, and take control, and then we follow them.
❌ Disclaimer ❌
Trading futures is highly risky and dangerous. If you're not an expert, these triggers may not be suitable for you. You should first learn risk and capital management. You can also use the educational content from this channel.
Finally, these triggers reflect my personal opinions on price action, and the market may move completely against this analysis. So, do your own research before opening any position.

Liquidity Hunt: How Whales Move the MarketEver wonder why prices always seem to drop just below your stop loss before bouncing back? It’s not bad luck; it’s liquidity in action. The big players are prowling, hunting for stops, and if you don't understand where they’re lurking, you might just be their next target. Liquidity definition refers to how easily an asset can be bought or sold without significantly affecting its price, and in the world of crypto, this dynamic can make or break your trade. Let’s dig into how these whales work the market and how you can avoid becoming their prey.
What is Liquidity?
Liquidity meaning refers to how easily an asset can be bought or sold without affecting its price. In the context of crypto, it's crucial to know that high liquidity means less slippage, while low liquidity can lead to sharp price moves. Market liquidity is essential for smooth trading, but it also creates opportunities for big players to manipulate price action by targeting stop losses.
Liquidity Risk and Big Players
Liquidity risk arises when there's not enough liquidity to execute trades efficiently, especially during volatile periods. Big players exploit these conditions by pushing prices through key support and resistance levels, triggering stop orders and capturing liquidity. This is why it’s vital to be aware of where liquidity is concentrated — big players often target areas with many stop losses, trapping retail traders in the process.
Tools to Analyze Liquidity
Volume Indicators: Use tools like Accumulation/Distribution or On-Balance Volume (OBV) to spot surges in volume that may indicate manipulation or big players entering the market.
Bitcoin Liquidity Heatmap: A Bitcoin liquidity heatmap shows where large buy and sell orders are placed, helping you avoid areas where liquidity is likely to be targeted by whales.
Liquidity Ratio Formula: Another great tool which helps measure market depth and liquidity. You can calculate it as:
A higher ratio indicates that there is more buying pressure, suggesting the market is more liquid and less prone to manipulation. On the other hand, a lower ratio signals more sell orders, which could expose you to increased liquidity risk and higher chances of price manipulation by big players.
Price Action: Watch for candlestick patterns like pin bars or engulfing candles near key support or resistance levels to anticipate price reversals after stop hunts.
Conclusion
While tools like volume indicators and Bitcoin liquidity heatmaps can help, always stay vigilant. Use wider stop losses to avoid getting trapped at key levels, and stay cautious during periods of low liquidity when whales are most active. This article isn’t trading advice — always DYOR and trade responsibly.

BTCUSDT: Trend in 2-H time frameMarket conditions remain uncertain and unsettled, making it difficult to define a clear trend for Bitcoin or the broader market. That said, the overall trend remains bearish, with potential downside targets across different timeframes around $91700, $81200, $75100, and $70300. Reactions at these levels are to be expected.
The color levels are very accurate levels of support and resistance in different time frames.
A strong move requires a correction to major support and we have to wait for their reaction in these areas.
So, Please pay special attention to the three accurate trends, colored levels, and you must know that SETUP is very sensitive.
BEST,
MT

$BTC bounce. What is happening?On the Macro Side:
Metaplanet was on the verge of bankruptcy — their stock dropped from $1,900 to $415 in just five months.
Their average Bitcoin buy price sits around $104K, and they had to take on more loans to buy even more BTC, in an attempt to lift the price and save their position.
Michael Saylor and NASDAQ:MSTR are in a similar situation. MicroStrategy’s stock has fallen from $460 to $236, with an average Bitcoin purchase price around $66K.
This puts huge pressure on these institutional treasuries — they cannot afford a bear market.
They’re forced to keep buying Bitcoin to prevent a BTC dominance collapse ( CRYPTOCAP:BTC.D ) and hold market confidence.
In the last two days, altcoins ( CRYPTOCAP:OTHERS ) have been outperforming Bitcoin, signaling a possible rotation from BTC to alts.
That alone was enough for these mega whales to ignite a quick pump before the weekend, trapping retail traders and preventing massive ETF sell pressure from retail-driven redemptions.
On the Chart:
Bitcoin is oversold on both RSI and MACD across multiple timeframes.
This aligns perfectly with the whales’ attempts to spark a rebound — and may support a short-term bounce lasting 5–7 days.
However, don’t be fooled — this looks more like a desperate defense pump than a true trend reversal.
The weekly trend remains bearish until at least Q2 2026, and we’ll likely see more bounces and dips along the way.
A new all-time high seems unlikely in this macro environment, with a maximum target around 108K before another correction.
Stay cautious. Don’t FOMO into this move — it’s engineered to protect treasury positions, not to start a new bull run.
Things will truly turn bullish only when Powell is replaced, QE restarts, or a major macro catalyst (like a government resolution) happens.
DYOR. Stay smart. Don’t chase hype.
#Bitcoin #CryptoMarket #BTC #Altcoins #CryptoNews #CryptoAnalysis #Macro #Whales #MarketUpdate #BTCUSD #AltcoinSeason #Investing #Trading #CryptoTrends #MSTR #Metaplanet #CryptoCrash #CryptoStrategy #DYOR

Bitcoin dropped as planned. Wait for a new range to take SHORTBitcoin dropped as planned. Wait for a new range to take SHORT
global trnedi si still down
at this moment big liqudation had happend that's why price could create a range before new down move

BITCOIN SIGNAL: NOBODY COUNTS ON THIS!!! (scary)Yello Paradisers! Enjoy the video!
And Paradisers! Keep in mind to trade only with a proper professional trading strategy. Wait for confirmations. Play with tactics. This is the only way you can be long-term profitable.
Remember, don’t trade without confirmations. Wait for them before creating a trade. Be disciplined, patient, and emotionally controlled. Only trade the highest probability setups with the greatest risk to reward ratio. This will ensure that you become a long-term profitable professional trader.
Don't be a gambler. Don't try to get rich quick. Make sure that your trading is professionally based on proper strategies and trade tactics.

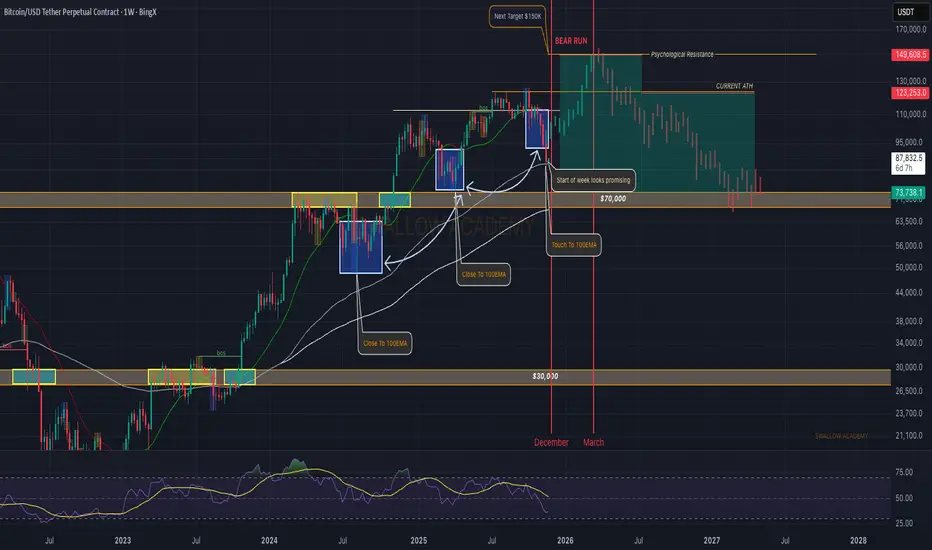
Bitcoin (BTC): Bullish Start of The Week | Expecting Good PumpThe start of the week looks very promising on BTC, where last week we had a touch to 100 EMA, and now we are seeing a decent reversal to form. If all goes as planned, then this had to be the last dip around the 100 EMA, and now we should see a decent reversal to form, which then would give us a movement toward upper zones.
Currently aiming for the $100K area, but do not rush; this is just the start of the week.
Swallow Academy
BITCOIN URGENT UPDATE! Bounce Expected This level is important!IG:BITCOIN Update:
I’ve been saying this for a while: avoid trading altcoins with high leverage in these conditions. If you got caught again, maybe it’s time to pause and rethink the strategy.
Coming back to BTC, we’re close to a 50 EMA crossing below the 200 EMA, but interestingly, these crossovers have often played out opposite to what classical TA suggests.
Right now, BTC is still getting support from the lower trendline of the falling wedge, so while the price action is choppy, it’s not completely bearish yet.
BTC needs to bounce here; otherwise, the setup becomes invalid if we close below 95,785.
DYOR | NFA
#BTC #BTCUSDT
Please hit the like button if you like it, and share your views in the comments section.
Thank you

BTCUSDT – Blue Box Reversal IncomingHi fellow traders,
On the 1D BTCUSDT chart, I am applying Elliott Wave principles to outline a potential long setup. Price has tapped into the blue box after completing a ZIGZAG correction, and this region may provide the foundation for the next impulsive leg within the higher-degree structure.
I am entering at the current price, with a Stop Loss at 73,900.00. My Take Profit is set at 132,366.25, based on the projected continuation of the larger impulsive count.
If price breaks below the structural low around the stop level, this trade is no longer valid.
Good luck and trade safe!

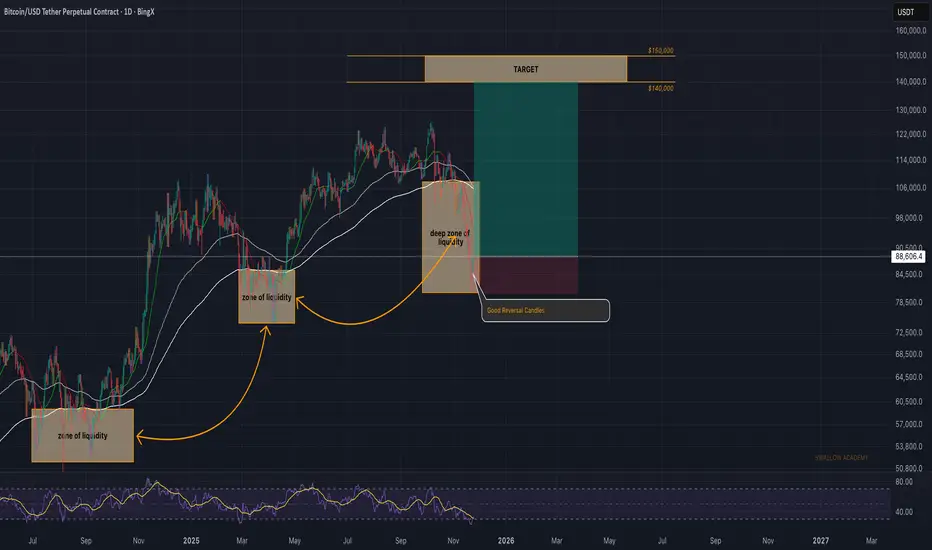
Bitcoin (BTC): Bullish Reversal Forming | Good R:R SetupThe zone liquidity came out much deeper than we thought, which resulted in the EMAs shifting far away from the current market price.
With the current reversal forming up and EMAs being far away (which usually act as good magnets in such a case), we are expecting a good upside movement from here.
Swallow Academy
BTCUSDT-Short-Term Sell Into Wave 4BTCUSD on the weekly timeframe is completing a major Elliott Wave 3 top, with price now correcting downward toward the projected Wave 4 demand zone around $58,000 – $62,000.
This aligns with the long-term ascending channel that has guided Bitcoin’s structure since the 2020 lows.
The chart shows a clean 5-wave structure forming, with Wave 4 expected to be the final deep correction before the next major bullish cycle.
SHORT-TERM TRADE IDEA: Sell Into Wave 4 Correction
Bias: Short
Reason: Breakdown from Wave 3 high + correction toward Wave 4 demand
Entry Zone:
$84,000 – $88,000 (current corrective bounce zone)
Targets:
TP1: $72,000
TP2: $62,000
Final Target (Wave 4 Low): $58,000
Stop Loss:
Above $92,000 (protect against bullish continuation)
Short-Term Notes:
Structure shows lower-timeframe bearish imbalances.
Expecting ABC correction to complete Wave 4 inside the purple demand zone.
LONG-TERM TRADE IDEA: Buy Wave 4 for Wave 5 Mega Rally
Bias: Long (swing/position trade)
Reason: Wave 4 completion + re-entry into the major ascending channel
BUY Zone (High-Probability):
$57,000 – $63,000 (golden pocket demand + channel support)
Long-Term Targets (Wave 5 Projection):
TP1: $100,000
TP2: $120,000
Final Wave 5 Target: $150,000 – $160,000
Stop Loss:
Below $45,400 (invalidates Wave 4 structure)
Long-Term Notes:
Weekly structure remains extremely bullish.
Wave 5 historically produces BTC’s strongest parabolic expansion.

The key is whether support can be found around 89294.25
Hello, fellow traders!
Follow us to get the latest information quickly.
Have a great day.
-------------------------------------
(BTCUSDT 1D chart)
This period of volatility is expected to last until November 22nd.
If the price fails to find support and rise near the M-Siganl indicator on the 1M chart after this period of volatility, it is likely to decline to the 69,000-73,499.86 level.
Therefore, the key question is whether it can find support and rise near the HA-Low indicator level of 89,294.25 on the 1D chart.
-
(1M chart)
It is showing a downward trend, failing to reach the Fibonacci ratio 2.618 (133,889.92), which was considered the target level.
However, if the price maintains above the 69,000.0-73,499.86 level, it is expected to maintain an upward trend in the long term.
-
(1W Chart)
If the price rises above the HA-High indicator, it is likely to form a stepwise uptrend.
Since a stepwise uptrend usually ends in a decline, this decline could be a sign of a bearish trend.
The M-Signal indicator on the 1M chart can be used as a benchmark for bullish and bearish trends.
Therefore, if the price remains below the M-Signal indicator on the 1M chart, it should be considered a bearish trend and a response should be considered.
However, considering the overall trend of BTC, the most important range is the 69,000-73,499.86 range. As long as it does not fall below this range, the price is expected to maintain an upward trend in the long term.
-
Thank you for reading to the end.
I wish you successful trading.
--------------------------------------------------
- This is an explanation of the big picture.
(3-year bull market, 1-year bear market pattern)
I will explain in more detail when the bear market begins.
------------------------------------------------------

I am right. Emotional traps in tradingVery often I catch myself thinking before opening a trade that I want to be right about the chosen direction. The first thought is not even about how much I can earn, but that it feels nice to be right, nice when the market confirms the chosen direction — that warm and pleasant feeling of a life-winner who takes control into their own hands. Sometimes I think that the overwhelming majority of traders came to the market not for money, but for this very feeling of being right, being competent and important. And opening a trade from this point is an emotional trap that eats up our deposits. Let’s figure out why and how to fix it.
Let’s start with what happens before opening a trade, when we come to the market to prove that we are right. You’ve surely seen such posts, and maybe even wrote them yourself, like “I told you so!”. This often happens with beginners in trading, because in the beginning, by the laws of the genre, the price often goes in the direction of the beginner, and it seems more and more to them that they’ve cracked the market, are always right and cannot be wrong. Before opening a trade in such a case there appears the emotion of happiness in anticipation of that cozy feeling of being right.
Usually the trader starts thinking and saying phrases like:
I know where the price will go
The price will be 1000 in a week
Save this post/tweet
I’ve always been right and now too, you’ll see
I’m telling you for sure the price will be 500 in 4 hours
This is the bottom/reversal point/top, from here we will go this way
If you recognize similar patterns and use them as a signal to open a trade, I have bad news for you. The moment will come when “I am right” inside one single trade will take away your whole deposit, and maybe not just one. You will never forget that dull pain somewhere in the chest after this. It usually pushes 95% of beginner traders out of the market, because after “I am right” doesn’t work, they usually say:
It’s all whales manipulating
It’s the exchange’s fault
It’s the president who is wrong
Technical analysis doesn’t work
Trading is a casino and you can’t make money here
It’s all a scam
“I am right” can even lead to very sad consequences. This is a psychological trap not of the market, but of our own perception of ourselves and what a trade is.
What a trade is NOT
A trade is not you
A trade is not a tool for proving anything to the market
A trade is not a toy for when you’re bored
A trade is not an enemy
A trade is not something that will never happen again
A trade is not a bet of your whole deposit on black
A trade is not a wife/husband — no need to cling to it
When we trade based on the signal “I am right”, we trade “I want validation”, “I want to prove that I’m smart”, “I want approval, recognition, and applause”, “I want to feel control”. Control is an important component. You cannot control the market in order to always be right, but you can control yourself, your risks and your trade management — not from the position “I want to be right”, but from the position “I want to see the result, any result”.
Why “being right” is dangerous
You start holding losing trades.
Because admitting a loss = admitting your mistake.
And the ego hates that.
You sit through drawdowns.
Not because it’s part of the strategy, but because you want to prove to the market, to yourself or to the world:
“I was right from the beginning.”
You don’t take profit.
Because you’re waiting for the perfect point to prove:
“Look, I caught the exact top/bottom!”
As a result, the pullback eats most of the profit.
You lose flexibility.
And flexibility is the only thing that gives a trader survival.
Why does the desire to be right appear?
The desire to regain control when a trade goes against us — at such a moment we see nothing but the chart, because a burning desire appears to pull the trade back to our entry. So we wait, increasing the loss, instead of admitting that we are NOT right and taking the loss.
The fear of making a mistake, admitting that no one knows the future and that it is normal to make mistakes — treating mistakes as a curse, not as part of the learning path, a normal and natural part.
When we were shamed for mistakes, and now shame doesn’t allow us to admit that I am NOT right, and that this is normal. This goes deeply back to childhood — you need to dig into your patterns and programs.
Perfectionism, which, like corrosion, always eats through everything. The world is NOT perfect, everyone makes mistakes, and nothing and no one can do something without first learning how to be NOT right.
The desire to be noticed. I’m right, I guessed the market direction, I got approval; I didn’t guess — I didn’t get it. Self-esteem is what you need to start with in trading — learning to praise yourself, finding the source of validation inside.
The illusion of others being right. This is a real scourge of our social-media age — the perfect picture of profit screenshots, but usually we don’t publish blown accounts. Why? Because being NOT right and admitting it — that is the level of a pro and a transition to a higher stage of your own psycho-emotional state.
What actually causes the desire to be right?
Short answer:
✔️ Fear of being wrong
✔️ Fear of shame
✔️ Fear of losing control
✔️ Fear of being “not enough”
✔️ Dependence on external validation
✔️ Childhood traumas of “idealness” and “rightness”
✔️ Broken inner support: “I must not make mistakes”
✔️ Undifferentiated ego: mistake = I am bad
So how do you get rid of the desire to be right?
I think you can’t get rid of it, but you can notice it and transform it.
Practice #1: Mark the “ego moment”
As soon as thoughts appear:
“I know, it will reverse”
“It just can’t keep going like this…”
“I’ll get back to breakeven and close”
“I just couldn’t be wrong”
Practice #2: Micro-stops on the emotional level
Not only technical stop-losses.
Set emotional stops:
accelerated heartbeat
the feeling “I must wait”
fear of closing
the desire to prove
Practice #3: A phrase that cuts off the ego
When the fight for “rightness” begins, tell yourself:
“My task is to protect capital, not my pride.”
Also write down reminders and put them somewhere visible:
“I’m okay even when I’m wrong.”
“I am not the trade.”
“I’m saving the deposit, not the trade.”
“I can change my mind and that’s normal; no one knows the future.”
“I don’t need to be right to make money.”
“I’m okay. A trade is just a trade, there will always be another one.”
Do you fight for your rightness? Or are you okay being wrong?

BTC/USD/ Bullish. Trend Read The captionSMC Trading point update
Technical analysis of summary of this BTC/USDT H1 chart:
---
Overall Bias: Bullish Short-Term
The chart shows a bullish continuation structure after mitigation of the Fair Value Gap (FVG) and support from EMAs.
---
Key Technical Points
Price retested and respected the FVG zone
Located around 85,300 – 86,000 area, acting as demand.
Price above EMA 50 (blue) and approaching EMA 200 (black)
→ Indicates building bullish momentum and potential trend reversal if EMA 200 breaks.
Structure
Higher lows forming
Price breaking minor structure highs
Strong bullish impulse candles
Target Zone Target highlighted near 90,000 – 90,100
---
Trade Idea Concept
Entry Idea:
Look for retracement back into the FVG/EMA zone for continuation long (mitigation + breakout strategy).
TP Target:
90,000 – 90,100 resistance and liquidity level
Invalidation / Stop:
Clean break below 85,300 demand zone would negate the bullish setup.
---
Smart Money Concept Perspective
FVG used as institutional demand
Liquidity grab below previous lows during correction phase
Targeting premium pricing near EMA 200 and liquidity pool
Mr SMC Trading point
---
Summary
BTC is showing strength and continuation potential. As long as price stays above 85,300–86,000 zone, the path of least resistance is upward toward 90,000.
---
Please support boost 🚀 this analysis

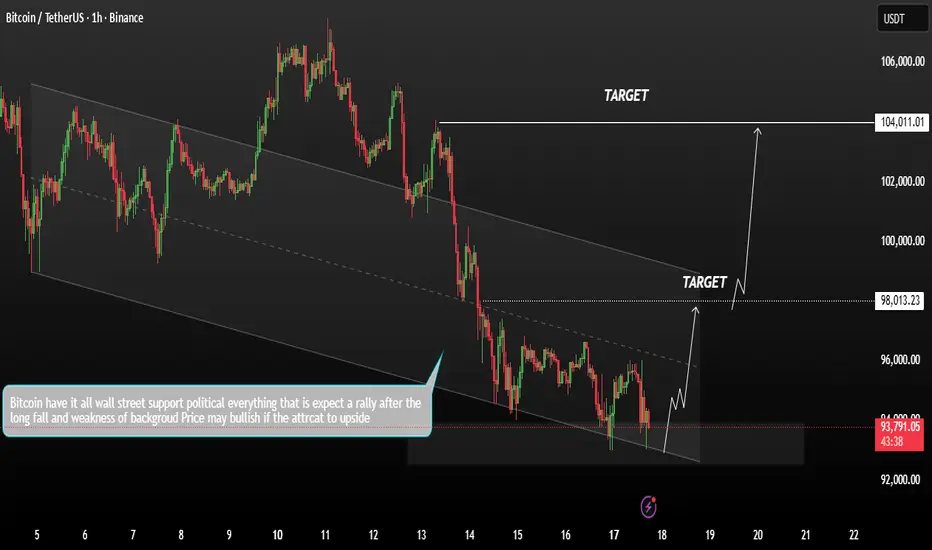
Bitcoin Potential short-term bullish reversalBitcoin is showing early signs of a potential short-term bullish reversal as price continues to respect the descending channel. The latest bounce from the upper boundary suggests increasing buy interest.
If the bulls manage to break above the key resistance level and price holds above the channel, the short-term bullish scenario remains valid. In that case, price could continue its upward movement toward the 98K – 104K upper resistance zone.
You may find more details in the chart,
Trade wisely best of Luck buddies.
Ps; Support with like and comments for better analysis Thanks for Supporting.
$BTC Correction DOES NOT = Bear MarketPeople are rushing to call it a 🐻 market for CRYPTOCAP:BTC while the correction is 27.8%
Fun Facts:
There were 2x 32%+ corrections between 2024-25
On average, there are at least 3x 30%+ every bull cycle
🐻are in control since summer no doubt
But it's not a 🐻market yet...

BTC Fear and greed at 10Ok let's see here...let's relax for 2 seconds and mark on the chart every period where we had the fear index at or around 10... What do we see? IF it falls back a bit longer, it shouldn't be too deep and for too long
