BTCUSDT ForecastBTC is dropping into a major support zone near 82,000–83,000, where a bullish rebound is expected. If price holds this support and reverses, upside targets sit first at 88,000 and then 92,000. Structure shows a falling channel, and a break from support could trigger a strong buy-side move toward these liquidity zones.”
"Thank you for your support! If you found this idea valuable or learned something new, please consider liking and leaving a comment. I’d really appreciate hearing your feedback and thoughts.
Trade ideas

BTC LONGExpecting Long on BTC
If D1 will be closed bullish engulfing today.
ENTRY - 87000 with H1 confirmation (entry +/- 1-5K).
SL - on the chart
TP - on the chart
GOOD LUCK!

Btc analysis After a long time away from the market, I am back to share a new idea with you,
Today, as in the past, there is a lot of fear for new buyers, but that is normal
Bitcoin can go back to 100k or beyond
I will update again in the coming days.

Bitcoin (BTC) Swing Structure UpdateBitcoin is beginning to form early consolidation around the 0.618 Fibonacci retracement, which sits in clean technical confluence with VWAP support pulled from a key swing low. This region is now acting as a major accumulation zone, hinting at a potential pivot in momentum.
As long as BTC continues to hold above this support cluster, the structure favors a possible rotation back toward the previous highs and potentially toward a new all-time high. The $74,000 level remains a critical swing point, and maintaining this zone is essential for Bitcoin’s broader bullish market structure.
Key Points
= BTC consolidating above 0.618 Fibonacci + VWAP confluence
- Accumulation structure forming at a key swing zone
- $74,000 remains a major pivot level for trend continuation
What to Expect
If Bitcoin holds this support region, a swing-long continuation toward prior highs becomes increasingly likely. Losing the level, however, may open the door to deeper corrective structure.

BTC Loses 50 EMA: Can the 10 EMA Hold?#BTC/USDT has slipped below the 50 EMA, which was acting as dynamic support. However, price is now showing a small bounce around the 100 EMA. If Bitcoin manages to hold this level, we could see a healthy rebound from here.
But if it fails to maintain this support, further correction in the coming days becomes likely.
DYOR, NFA
Please hit the like button if you like it, and share your views in the comments section.

BTC LongOur last two trades gave insane calls and you all witness it. This time we are seeing that BTC is going up with a strong 30 min candle reversal. Targets on the charts. DYOR

#BTC/USDT Broke the support. Levels to watch...💬 Bitcoin Update:
Unfortunately, the previous BTC setup has been invalidated — BTC broke the support.
The next major support levels are $90.3K and $86.5K.
If BTC breaks $90.3K, there’s a strong chance of a sharp bounce from the lower support zone.
The best move right now is to observe how the price reacts; no need to take unnecessary risks when things look uncertain.
You can look for short opportunities on relief bounces, but personally, I’d rather wait for a clearer setup.
As always, do your own research and make your own decisions.
If you found this helpful, please hit the like button ❤️
Thank you.
#PEACE ✌️

NOW OR NEVER - The Bulls’ Final Stand?⚔️The crypto market is standing at a make-or-break moment , and the next few weeks could define how this cycle ends.
CRYPTOCAP:BTC is testing the $90,000 support, a level that has acted as a major pivot point throughout this bullish channel.
CRYPTOCAP:USDT.D is hovering just below the 6.4% resistance, a threshold that has historically marked market reversals.
Meanwhile, CRYPTOCAP:XRP is clinging to its $1.9 support, holding the line for altcoin sentiment.
🏹If Bitcoin holds above $90K, USDT.D remains capped under 6.4%, and XRP stays strong above $1.9, the bulls could regain full control and ignite the next major impulse across the entire crypto market.
But if these levels fail… the tide could turn fast.
It’s truly NOW OR NEVER for the bulls. ⏳🔥
⚠️ Disclaimer: This is not financial advice. Always do your own research and manage risk properly.
📊All Strategies Are Good; If Managed Properly!
~Richard Nasr

BTC/USDT Daily Chart – Planned Short Setup with Entry, SL & Targ🔻 BTC/USDT Daily Chart – Planned Short Setup
Market Context:
BTC is in a clear downtrend, trading below the Ichimoku cloud and showing consistent lower highs and lower lows. Current price is around 96,000 USDT.
---
Trade Plan:
- Entry: 91,000 – 92,000 USDT zone (awaiting bearish rejection at resistance/trendline)
- Stop-Loss: Above 96,000 USDT (recent swing high and resistance)
- Target 1: 88,000 USDT
- Target 2: 84,000 USDT (strong historical support zone)
---
Key Levels:
- Resistance: 91,000 – 96,000 USDT (trendline + Ichimoku cloud + previous highs)
- Support: 84,000 – 85,000 USDT
---
Trade Rationale:
This is a trend-following short trade. The plan is to sell into strength after a pullback to the resistance zone, confirmed by bearish price action signals. The risk-reward ratio is favorable (>1:1.5), aiming to capture the next leg down in the ongoing downtrend.
---
Note: No entry until price reaches the planned zone and bearish confirmation is observed. Proper risk management is essential

Capitalize on fear in reversalsRichard W. Schabacker and Bob Volman are two investors separated by time and methodology. Yet they share one essential thing: both understand the market as a profoundly psychological phenomenon. Influenced by them, I try to trade with maximum simplicity and overwhelming logic.
Today I’m going to share with you one of the most ingenious methods I’ve ever discovered for exploiting high-probability reversals.
Psychological factor: Loss aversion
The pain of a loss is far more intense than the pleasure of an equivalent gain. According to Prospect Theory, developed by Daniel Kahneman and Amos Tversky in 1979, losses psychologically weigh roughly twice as much (or more) as equivalent gains. This causes people to become risk-averse when they are in profit but much more willing to take risks to avoid a certain loss.
In Figure 1 you can see a graphic representation of that pain and loss. Using trendlines, we observe sellers suddenly trapped by aggressive buying pressure.
Figure 1
BTCUSDT (30-minute)
Many of these sellers were undoubtedly stopped out quickly, but I assure you the majority — slaves to the cognitive bias known as loss aversion — will hold their positions hoping for a recovery.
The deeper the losses go, the greater their attachment to the position becomes, along with their desperation. Under that pressure, most of those unfortunate bears will only wish for one thing: a chance to get out of the market at breakeven.
In Figure 2, observe what happens when price returns to the zone where those sellers were originally trapped.
Figure 2
BTCUSDT (30-minute)
In the bullish signals of Figure 2 we can see the confluence of several factors:
Trapped sellers closing their short positions the moment price reaches breakeven, turning into buying pressure (and living to fight another day).
Profitable shorts who were riding the previous downtrend taking profits or closing positions after a deep pullback caused by buying strength, now near potential support zones.
New buyers entering because they see support near the low created by the previous bearish leg (especially if the downtrend has reversed into a range or accumulation phase).
In Figure 3 you can see two examples of groups of buyers who got trapped while expecting continuation of the uptrend. After two deep corrections, most of them only wanted to return to their entry price to escape unscathed.
As soon as price returns to that entry zone, those long positions turn into selling pressure.
Figure 3
BTCUSDT (30-minute)
Figure 4 shows more of the same: desperate bulls and a lot of pain.
Figure 4
USOIL (Daily)
Additional ideas
-Remember: the deeper the pullback, the greater the suffering of the trapped traders. We need them to panic so that, the moment price reaches their entry zone, they close without thinking twice — thereby validating and reinforcing our own positions. (Fibonacci retracements of 0.50, 0.618 and 0.786 are extremely useful for measuring the optimal depth of a pullback)
-Reversal patterns are also essential for our reversal entries because they significantly increase our win rate.
-We must be especially careful when trading against moves with very strong momentum. (characterized by near-vertical price action and disproportionately large candles)
Although I will soon go deeper into the management of this method, I recommend reading the article What nobody ever taught you about risk management ( El Especulador magazine, issue 01). You can also read the chapter titled The Probability Principle in Bob Volman’s book Forex Price Action Scalping .
If you enjoyed this article and want me to expand further on this and other topics, stay close.
We won’t be the ones getting trapped.
BTC Outlook: 90K Zone Retest PossibleBTC Outlook: 90K Zone Retest Possible
BTC has entered a strong reaction zone around 82–85K, which historically acts as a demand block. The initial bounce from this area suggests buyers are stepping in again.
Key Reasons a Move Back to 90K Is Possible:
1. Strong Demand Zone (82–85K)
BTC is showing clear absorption of selling pressure. This is typically the first step before a reversal toward higher resistance levels.
2. Market Structure Reversal Pattern
Your chart indicates a potential W-bottom / reclamation setup. Once BTC holds above 85.6K, momentum usually shifts bullish.
3. Liquidity Above (88–90K)
There’s a large cluster of untapped liquidity at 88–90K where previous breakdowns occurred.
Market makers are incentivized to push price back up to that zone.
4. 90.3K = First Major Resistance Target
The yellow line at 90,370 aligns with:
HTF resistance
Former support flip
Liquidity target
Perfect location for a retest.
Scenario Path (Matches Your Green Projection):
Bounce from 82–85K
Break above 85.6K reclaim
First target → 87K
Pullback / consolidation
Final push → 89.5K–90.3K

BTC/USDT 1W chart review📉 1. Market structure – trend and break
• The chart shows a black upward trend line that has led the market since 2023.
• This line has been clearly broken, which means:
✔ weakening of the structure
✔ the first serious threat to the upward trend
✔ possible move towards lower support levels
A breakout of the weekly trendline usually ends a medium-term upward trend.
⸻
📉 2. Current price
BTC is around USDT 87,770 and the weekly candle is heavily bearish.
This means that buyers do not react to the first support.
⸻
🟥 3. Most important support levels
1) 92,086 USDT – local resistance zone (previously support)
• Price has broken this support from above → now acts as resistance.
• To return to growth, BTC would have to close the week above this zone.
2) 84,583 USDT – first major support
• Price is just above the zone.
• If this fails → there will be an increased chance of continued declines.
3) 74,324 USDT – key macro support (MAIN LEVEL)
This is the most important level of the chart.
• This is the level where demand must occur if BTC is to maintain its long-term structure.
• Breaking this barrier will open the way to declines even to around 60-65k.
⸻
🟩 4. Resistance levels
1) USDT 92,086
Closest resistance – key to recovery.
2) USDT 100,794
Big weekly resistance that stopped the market earlier.
Only a breakout → continuation of the bull market.
⸻
📊 5. Stochastic (week) – very important
At the bottom you can see Stochastic sliding down, almost at the value of 0-20 (oversold).
Interpretation:
• There is no buy signal yet because the lines have not turned upwards.
• Weekly momentum is still down, so the pressure on support continues.
📈 7. Scenarios
Bullish (less likely for now)
1. Maintaining 84.5k
2. Stochastic weekly turns upwards
3. Price returns above 92k
➡️ Target: 100.7k
Bearish (more likely)
1. Breakthrough 84.5k
2. Retest from the bottom
3. Drop to 74.3k
➡️ If 74k breaks → 65-68k

$107k in 40 days - 23 November to 1 January ForecastLeveraging the MTOPS method, this forecast is built around the principle of time-price symmetry and natural vibration cycles. Starting from 23 November, we identify a key Gann time window of 40 days, extending to 1 January. In this period, price targets are projected using Gann angles—particularly the 1x1 and 2x1 angles—plotted from the most recent swing low. According to Gann’s Square of Nine calibration, $107,000 aligns with a significant harmonic square, suggesting both psychological and geometric resistance in the current cycle.

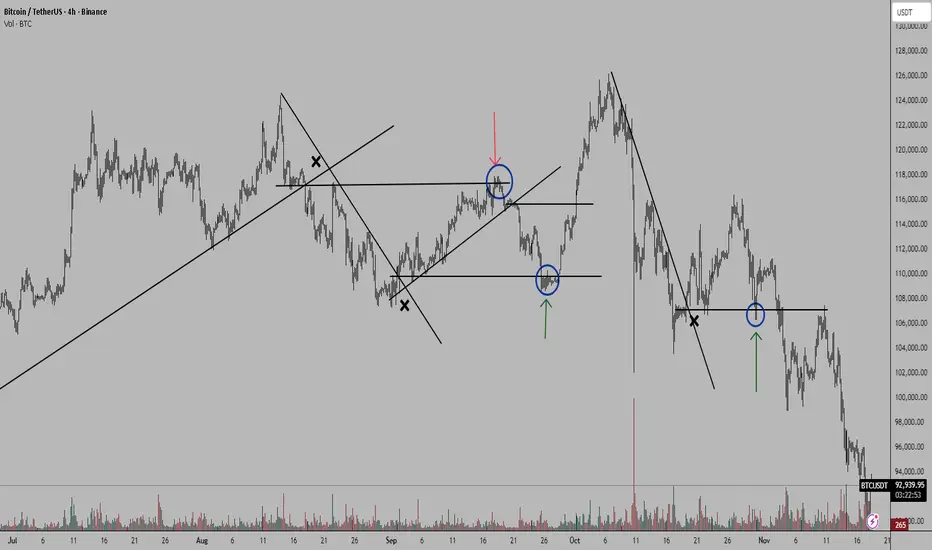
BTC Most Honest Analysis You Will Ever Find - PS: Sorry BullsFeel free to argue against. Fire your best facts. I would love to hear them all.

BTC market on fire, sharp dropBTC Daily Timeframe – Short Summary
BTC is forming a bearish 5-wave Elliott structure:
Wave (3) seems to have bottomed around 94,000.
Price is now expected to make a Wave (4) pullback toward 100,000–101,000 (major resistance).
After that, BTC is likely to drop again in Wave (5) toward the 80,000–82,000 zone (1.618 extension).
Technical signals:
BTC is below all EMAs (34/89/200) → trend still bearish.
200 EMA near 104,800 is strong resistance.
Key supports: 94k, then 80k.
Bias: Bearish while below 104k–105k.

BTC - Short Update - Next Expected MovesBitcoin “Ultimate Swing Short” has been playing out beautifully from our upper entry of 121,500.
Here are updated details of expected path from here:
SHORT - 91,500 Entry - Target of 35,500
LONG - 34,700 to 35,200 Entry - Target of 62,000
SHORT - 63,000 to 63,900 Entry - Target of 10,000
BUY - 7,600 to 9,000
Here is a list of the take profit targets not yet hit for those holding the short:
1) 87,400
2) 67,900
3) 43,800
4) 21,600
5) 10,100
Expect these last moves to be very fast, best to plan ahead and be prepared.
Much love and happy trading.
- DD

TECHNICAL ANALYSIS – BTC (4H)📉
1. Main trend – still down
I see a clear downward trend channel (yellow lines) on the chart. The price is moving in the lower half of the channel, which means that supply pressure is still dominant.
2. Rebound, but under strong resistance
The recent upside breakout looks more like a correction in a downtrend than a reversal.
The closest resistance levels I see on the chart:
94,500 – 95,000 → EMA + local level
96,000 – 96,500 → next EMA
98,000 – 99,000 → key level where the SMAs are located
Until BTC breaks above 96,500–97,000, there's no way a sustained trend reversal will occur.
3. Current Reaction at the SMA/EMA
The price touched the red moving average (SMA?) but was rejected—a classic reaction in a downtrend.
This signals:
a lack of buying power,
a predominance of supply in the 93,300–94,500 area.
4. Support Levels I See
At the bottom, you have specific lines that make sense:
89,900–90,000 → key support
89,500 → marked level
87,600–86,500 → lower part of the channel + previous bounce
If BTC loses 89,500, a move to the 87,000–86,500 area is very likely.
5. MACD – early, but cautious signal
The MACD has started to move up, but:
there is no clear crossover yet,
the histogram is weak.
Interpretation:
The rebound continues, but there is no confirmation of a trend change.
6. RSI – slightly bullish, but neutral
RSI ~49, so:
it is not oversold,
it is not overbought,
there is room for both a further rebound and a decline.
The RSI does not provide a strong directional signal.
📌 Summary – what looks most realistic?
Baseline scenario (60% chance): continued decline
Price will rebound to:
94,000–95,000,
possibly to the upper band of the channel (95–96K),
and be rejected → a decline to 89,500, and then 87,000–86,500.
Bullish scenario (40%): breakout of the channel
We need to see:
a 4-hour candle close above 96,500,
preferably a retest and hold,
only then can we talk about a trend reversal and a move towards 98,500–100,000.
📈 Market assessment (neutral–bearish)
Everything indicates that we are only in a correction within the descending channel. Until BTC breaks ~96.5K, the advantage is on the bears' side.

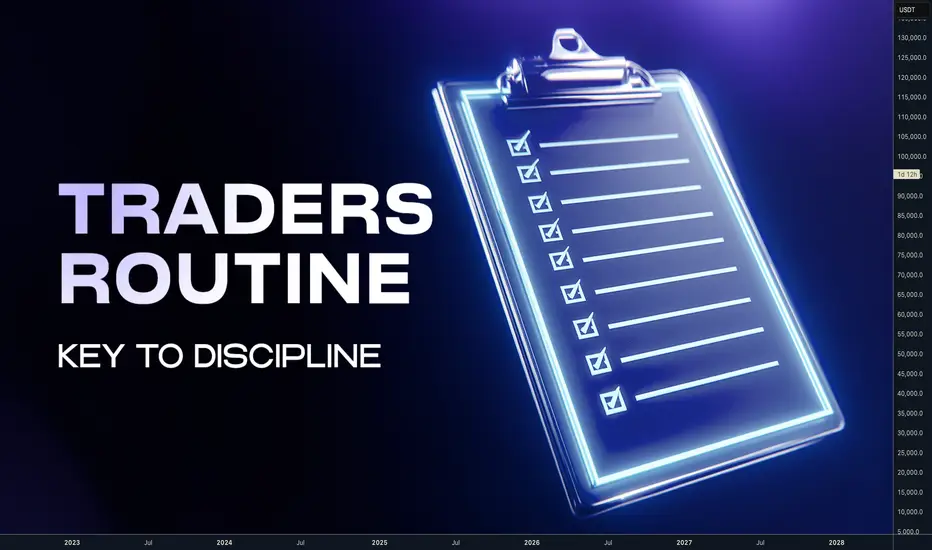
Trading Success Starts With How You Live, Not How Much You TradeHey whats up guys, today I wanna share trading routines which has helped me to bet back my life and saved me from the false trap and from possible disaster.
Trading is reflection of our life. Literally how you live, will reflect in your trading results.
When I was starting I had a 9 - 5 job and learning trading as a hobby. I was in shape, doing the gym 4 times a week, running, swimming in the sea every day, Kitesurfing, Eating healthy, reading self development books. I was in perfect position to simply acquire another skill.
But, after some time as most of us, I wanted to get into full time trading. I thought that having more time for trading and working harder than everyone else will mean more money.
Which could allow me to being my own boss and live the life in my terms and have some unnecessary material things in my live.
So I did exactly that, I went full time (with only $10K ) and started to literally live behind the charts for 14 hours a day. Trying to catch every move up and down and with 28 FX pairs on my watchlist. All of that without any structure or fixed schedule. Plan was just to trade.
This is will kill you 👇 Here is what has happened
- I slowly socially disconnected from friends
- I was visiting the gym less often, because I didn't want to miss anything on markets
- When I woke up, I immediately sit to the charts
- Some days I forgot to drink water and eat
- Instead of eating healthy, fast food delivery became the choice
- I was even eating by the PC and still switching between the pairs
- Sometimes I didn't leave the flat for few days
- My sleep was ruined. I went from regular 8 hours to 5 hours
- I stopped reading books
- I gained almost 10kg and my physique was overall bad
- Developed back pain from sitting and shoulder pain from mouse
Did I made more money ? In the end I made pretty much same as when I was trading part time. Only instead of having a few good winning trades in a week. I had 100 trades a month but was totally exhausted and my health was completely destroyed. overall result was similar in terms of %. But the cost I payed with my health , time and stress didn't worth
What has happened later is unbelievable story and I will share it the one of the next planned posts. Follow me if you don't want to miss them. I speak from own experiences. And yeah I made every possible mistake. 📍 One year later I realized:
- Life out of the charts is most important
- Trading is a tool for our desired freedom and life, not a goal
- Without strong body, health and good sleep you will not trade well
- Discipline in the trading starts in the disciplined life
- More time spent on charts and more traders doesn't equal more profits
- 10K for full time trading is not enough
Trading is lifestyle - Build your life around it
Being disciplined is easier when you run on autopilot. Routine beats discipline. You have to create habits which repeats on the daily basis. So you eliminate hesitations of what to do next and just focus just on executing your daily schedule. And mainly not multitasking and focusing on one thing you planed to do at specific time.
🧪 This is my current weekly schedule
These are activities and times which keeps my balance between work / life and Digital worlds. It keeps me Fit, Mentally strong, Continuously improving myself and not being overtrained or burned out from any of these. 📝 Weekly Preparation - Sundays (2 Hours)
Every successful week and trading week starts with planing in advance. Hence every Sunday I spent 2 with planing. 1 Hour charts, checking news calendar, COT data etc...I do HTF top down analysis and mark out Monthly, Weekly, Daily levels. At this stage Im not looking for a trades, just updating the charts. I trade 4 FX pairs, 4 crypto. I don't spend more than 8 minutes with each chat. Goal is to project highest probability and direction of the next weekly candle. I got this tabs in my journal with the plan for each pair Second hour I plan my business tasks and family stuff for the week. Everything is planed so I do not have to overthink when Im going to sleep.
💤 Sleep time 21:30 (7 Hours)
Every successful day start with good sleep. Make sure you have down window from your business & charts. Put your brain to calm mode and mainly put your phone away at least 1,5 hour before you go sleep to avoid blue light. Always go sleep at the same time. You should aim for 8 hours. I sleep just 7 but it's enough for me.
🧘♂️ Meditation(20 minutes)
Waking up at 4:30 (without alarm). Quickly check my daily plan and immediately start with meditation. I project and visualize my day. It sets my intentions and I start the day strongly. Never touch your phone as first thing on the morning. Short content and news are programed to distract you. Try meditate and visualize your plan. You will see difference in a focus. When you meditate thoughts will be coming, just try to come back to present moment. You will become better and better when you practice this improve your focus and sleep.
🚶♂️➡️ Morning Walk(1 Hour)
Once I finish meditation and hygiene. Before the breakfast. Im going out for the 1 hour walk. Yes before the breakfast. Because if you are walking fasted your body takes energy from fats. So it's kind of fat burning walk. On a work out field I do a bit calisthenic few pull ups, pushups , squats, dips etc and a bit of stretching. I don't take Phone and No music, Nothing. Just me conscious absorbing waves of nature. It's also kind of meditation and again improving my focus.
✍️ Book / Notes(45 minutes)
When I come back home. I make breakfast it's mostly eggs or oats with protein and I read books and manually take some notes of what I found interesting. 📈 4x Backtests (30 minutes)
Backtesting is not optional and it's not only for developing and testing a new strategy. It's training for traders same as training for UFC fighters. There is no point when you should stop your training even when you are profitable. But I don't want to spend 2 hours on the weekend backtesting. So I do 4 backtested hindsight trades in day. It takes less than 30 minutes and Im building my library of trade examples and mainly my Risk reward and Win ration statistical data which keeps me confident on what Im doing. And practicing market context
🇬🇧 London Session (2 Hours)
This is my main trading time. I update the charts every day and look for the setups. Im swing trader so it doesn't mean Im actively entering and exiting many positions. It's a time when Im fully focus on trading and price action. I don't go below M15 TF. But it doesn't mean that I have opened another Tabs or multitask with other things. Full focus just to charts. I simply follow my mechanical strategy . Click the picture bellow to learn more 👇https://www.tradingview.com/chart/BTCUSDT.P/PkQJvVm4-Complete-system-for-Day-Swing-Traders/
My setups occurs often on Tuesdays , Wednesdays, Thursdays. I often skip trading on Mondays and not opening new trades on Fridays. Friday NY session Im not even by PC.
💪 GYM / SAUNA (80 min)
Every weekday after London Session I take a break form the PC and I leave the house to the Gym. Focusing on strength and mobility training a bit cardio also. Im not trading every day as in my 40s recovery is not so fast as it was in my 20s. So every second day I do Sauna which has many health benefits.
🫁 Breath-work (15 min)
before the NY session. Im doing a Breath-work. You can find these guided breath works on the YouTube. Perfect training for your parasympathetic system it switches you from reactive to a strategic thinking. It's basically a small ritual that empower you and again increase your focus.
🇺🇸 New York Session
I always have charts updated from the London and got set alarms n the price levels. So just some final updates and being focused on price action. If I have trades from the London. Im looking to other pairs, but I never want to have trades on more than 4 instruments at the time. So NY session is kind optional for me, sometimes Im not even by PC and as I got Tradingview notifications if the levels are hit. I execute from the phone, while Im outside with the family or friends or doing some other activities. I don't trade NY session at Fridays.
💊 Social Media (30 min)
You might thinking why I have social media in my plan. Well at 5PM when Im done with trading and business It's the first time I go to check social media for some time. I scroll a bit to feed my dopamine, look what new on X etc... and thats it. Social media are big distraction and checking them multiple times a day is bad. Hence I got plan for them for 30 minutes a day and thats it. All notifications are turned off and I don't let myself bother and interrupt during the day.
✍️ Journaling / Daily Planing (30 min)
Every day at 7:30 PM. I do journal with pen and paper. Writing down what Im grateful for , what I have achieved, where I can improve and planing next day. Since Im done with this. I don't think about a business and charts anymore. It used to be difficult when you have running positions, but I got stop loss and risk under control . I know how much I can loose if Im wrong. So no need to check anything anymore. I can live present evening with family.
🧩 Weekly Review (2 Hours)
I mostly stop trading at Fridays London session. Then gym and massage and thats when my weekend starts. But on the Saturdays early mornings before my family wakes up. I do My Weekly review. Going thru my trades and charts and comparing it with the plan. Doing the self reflections, noticing what I did right so I can repeat it next time but also what I did wrong and trying to find where I can improve. I also review my week from personal development side and checking if Im still on the right path with my longterm goals.
⁉️ This is questions Im asking myself when going thru past trades.
- Was there a type of trade that did/didn’t work well?
- Was there a particular market that I did/didn’t trade well?
- Was there a particular day/time that I did/didn’t trade well?
- Did I enter trades too soon?
- Did I enter trades too late?
- Did I take profits too soon?
- Did I take profits too late?
- Did I put my stops loss too tight?
- Did I use an unnecessarily big stop loss?
- Did I take take any trades with poor Risk:Reward ratio?
- Did I risk too much?
- Did I risk too little?
- Did I deviate from my trading model?
- Did I deviate from my plan?
Since I live balanced life for past few years not only that my trading has exponentially improved but Im also more healthy , less stressed and overall happy and enjoy the life.
‼️Note : Life happens and not every time it goes as you plan. There will be things, people or situations which will take you away from your journey. If that happens come back to schedulle as soon as possible.
Learn to say No, without explaining yourself. Prioritize your time and goals. If it's not within your long term journey say NO. No-one except your kids or family and your health is more important than your mission.
Adapt, useful , reject useless and add something specifically your own - Bruce Lee
David Perk and Dave FX Hunter
BTC EOY ExpectationsFollowing my previous analyses, my first long attempt in the marked areas was invalidated as BTC pushed slightly lower. Now the price is in a zone where almost any scenario is possible heading into the end of the year.
My main thesis is that, since BTC failed to hold the Yearly Open, there is a strong possibility that the yearly candle could close as a doji/ bullish doji yearly close. This would accurately reflect the indecision and volatility that defined 2025. Under this narrative, a period of chop and range into late December would make sense.
On the monthly timeframe the candle has not closed yet and BTC still has a chance to respect the monthly trendline. I took a long position at the January Low because it is a historically important support and resistance level. My stop allows enough room for consolidation in a short term expected bounce and the initial reaction has shown healthy signs of demand.
My first upside target is current week Monday’s High. A more ambitious target is the Daily 200 EMA. BTC may fluctuate and consolidate before moving higher, although a strong reclaim in early December could shift the narrative in a more bullish direction.
To the downside the key levels remain the Weekly 100 EMA and the January Low. Overall I expect chop within the 90K to 110K range as the most likely environment.
There is also a bearish crossover between the Daily 50 EMA and the Daily 200 EMA. The last time this happened was in September 2023, right before a major bullish breakout. It is not a perfect comparison because the structure at that time was already showing clear consolidation, but it is still a useful observation for context.


Crude Oil Market (WTI, Brent) & OPEC+ Decisions1. Understanding WTI and Brent Crude
WTI Crude Oil
West Texas Intermediate (WTI) is a high-quality, light, and sweet crude oil primarily sourced from fields in the United States, especially Texas. Its low sulfur content makes it easier to refine into gasoline and diesel, which are in high demand in the North American market. WTI is traded on the New York Mercantile Exchange (NYMEX) and considered a benchmark for U.S. crude prices.
Brent Crude Oil
Brent is sourced from oil fields in the North Sea, spanning the UK and Norway. It is slightly heavier than WTI but still considered a light, sweet crude. Brent is traded on the Intercontinental Exchange (ICE) and acts as the global benchmark for two-thirds of internationally traded crude oil.
Why Two Benchmarks?
The existence of both benchmarks reflects regional differences in production, shipping costs, refining requirements, and market access. Generally:
WTI represents U.S. supply-demand dynamics.
Brent reflects international conditions across Europe, Asia, and Africa.
The price spread between the two (WTI–Brent spread) often indicates logistical constraints, geopolitical tensions, or shifts in global demand.
2. Factors Influencing Crude Oil Prices
Crude oil markets are volatile due to the interplay of multiple economic, geopolitical, and market-driven factors.
a. Global Supply & Demand
Oil demand is affected by:
Economic growth rates
Industrial output
Transportation needs
Seasonal factors (winter heating demand, summer driving season)
Supply depends on:
Production levels in OPEC and non-OPEC countries
U.S. shale output
Production outages or upgrades
Infrastructure constraints
b. Geopolitical Events
Conflicts in the Middle East, sanctions on major producers like Iran, instability in Venezuela, and maritime disruptions (e.g., Strait of Hormuz tensions) significantly move oil prices.
c. Currency Movements
Oil is priced in U.S. dollars.
When the USD strengthens, oil becomes expensive for foreign buyers → demand decreases → prices fall.
When the USD weakens, oil prices tend to rise.
d. Inventories & Storage
Weekly U.S. crude inventory data, especially from the EIA (Energy Information Administration), provides insights into near-term supply-demand balances.
e. Energy Transition Policies
Shift toward renewable energy, environmental policies, and long-term decarbonization targets influence investment, production, and expectations of future oil use.
3. Role of OPEC and OPEC+
What is OPEC?
The Organization of the Petroleum Exporting Countries (OPEC) was founded in 1960 to coordinate and unify petroleum policies of major producing countries. Key members include Saudi Arabia, Iraq, Iran, Kuwait, and UAE.
OPEC+ Formation
In 2016, OPEC expanded to include major non-OPEC producers such as Russia, Mexico, Kazakhstan, and others, forming OPEC+.
This group controls around 40% of global oil production and 80% of known reserves, making their decisions highly influential.
4. OPEC+ Production Decisions
a. Production Cuts
When demand falls (e.g., during pandemics or recessions), OPEC+ often cuts production to support prices.
Cuts reduce global supply → tighter market → higher prices.
b. Production Increases
During times of strong demand, OPEC+ increases output to maintain market stability.
Higher supply → pressure on prices → prevents overheating of global inflation.
c. Voluntary vs. Mandated Cuts
Sometimes individual countries choose voluntary cuts to stabilize the market.
Saudi Arabia often leads with additional voluntary cuts beyond the group agreement.
5. How OPEC+ Decisions Influence WTI and Brent
Market Expectations
Before meetings, traders speculate on whether OPEC+ will:
Cut supply
Maintain quotas
Increase production
Even rumors can create dramatic price swings.
Outcomes of Meetings
A formal announcement of cuts usually triggers:
Brent prices increasing more sharply, as it is more globally sensitive
WTI moving upward, though influenced by U.S. shale reactions
On the contrary, increases in output often lead to a pullback in both benchmarks.
Long-term Impact
Persistent cuts support a long-term bullish trend.
Persistent increases (or cheating on quotas by some members) lead to bearishness.
6. U.S. Shale Oil and the WTI–Brent Spread
One of the biggest changes in oil markets over the past decade is the rise of U.S. shale production.
Shale oil is flexible and responds quickly to price changes:
When prices rise → shale producers increase drilling
When prices fall → production slows
Because shale is mostly priced off WTI, higher U.S. output often widens the WTI–Brent spread.
Logistics Constraints
Pipeline bottlenecks in the U.S. midcontinent region can cause WTI prices to fall below Brent due to oversupply.
7. The Financialization of Oil Markets
Crude oil is not just a physical commodity—it's also a major financial asset.
Investors trade oil futures, options, ETFs, and swaps, influencing price movements.
Key players include:
Hedge funds
Banks
Producers hedging future output
Airlines hedging jet fuel costs
This financial activity creates liquidity but also increases volatility.
8. OPEC+, Price Stability, and Global Economics
Inflation Management
Crude oil is a major driver of fuel prices, transportation costs, and overall inflation.
Sharp increases in oil prices often:
Push inflation higher
Increase the chances of central bank rate hikes
Slow down economic growth
OPEC+ often aims to maintain price ranges that balance producer revenues with global economic stability.
Revenue Dependence
Many OPEC+ members rely heavily on oil revenue to fund government budgets.
Low prices strain fiscal systems; high prices improve surpluses.
9. Future of Crude Oil Markets
Short to Medium Term
Demand is expected to remain strong in developing economies.
Geopolitical risks will continue to play a major role in volatility.
Long Term
Energy transition policies and global decarbonization will gradually reshape demand patterns.
However, oil will likely remain a major energy source for decades due to:
Transportation needs
Industrial petrochemicals
Aviation fuel
Limited large-scale alternatives in some sectors
OPEC+ is expected to maintain a central role in managing supply and stabilizing prices during this transition.
Conclusion
The crude oil market, anchored by the benchmarks WTI and Brent, plays a central role in global economic activity. Price movements are influenced by production levels, geopolitical events, inventory data, currency dynamics, and financial market behavior. Among all players, OPEC+ remains the most influential force in shaping supply trends and managing market stability. Their production decisions can trigger global inflation shifts, currency volatility, and economic fluctuations. As the world gradually moves toward cleaner energy sources, the balance between demand, supply, and policy-driven cuts will define the future of oil markets for years to come.

BTC - Next MoveFor those following my Bitcoin Crash prediction from the top, here is a smaller broken down trade that’s the first wave down in this crash.
Entry - 86,500
Stop Loss - 89,600
Take Profit - 36,000
Will report back when the next move is ready, which will likely be a long.
Happy trading.
-DD

BTCUSDT.P - November 21, 2025Price is in a short‑term downtrend, with a series of lower highs and lower lows after rejecting the highlighted resistance area near 92,300–92,500 and breaking back below intraday consolidation. Loss of upside momentum and a rotation from a prior minor rally confirming sellers’ control and opening the door for continuation toward the marked support area around 88,800–89,200.
