DeGRAM | BTCUSD is testing the $90k level📊 Technical Analysis
● BTC/USD is testing a major support cluster near 88–90K, where price aligns with the long-term dynamic support line formed from previous triangle and flag breakdowns.
● The new rejection wick at support and the descending channel structure suggest a potential medium-term rebound toward 95–97K if buyers defend this level.
💡 Fundamental Analysis
● Bitcoin sentiment stabilizes as ETF inflows resume and risk assets recover after easing US inflation expectations.
✨ Summary
Support: 88–90K. Rebound potential: 95–97K. Medium-term bullish scenario valid while holding the dynamic support.
-------------------
Share your opinion in the comments and support the idea with a like. Thanks for your support!
Trade ideas

BITCOIN LONGBitcoin long from 91k area.
A swing trade. This will occur during the week .
Let us be patient .

$BTC: let’s see who the lucky and intelligent winner is.Suggest a title for this CRYPTOCAP:BTC post the best one will get a small reward from me! Let’s see who the lucky and intelligent winner is.

BTCUSD SELL WITH LIMIT ORDER!!!!!!!BTCUSD have been on a bearish move after taking out the internal structure low on the weekly time frame todays sell will be price to revisit the 75% level fib which is also my volume profile POC area at 92k to 93k area and a long sell from that zone till new low is created 87k is my measure target.....

Bitcoin’s 125k Dream or 80k Nightmare, Who Wins This GameAre you buying the top at 125k and panicking at 80k
Ever wondered why someone else always takes the profit
Let’s uncover who wins this long term Bitcoin survival match
Hello✌️
Spend 3 minutes ⏰ reading this educational material.
🎯 Analytical Insight on Bitcoin:
In my view, Bitcoin usually drops around the New Year and Christmas, and this has happened almost every year. This is normal because people are buying during this time. So we might see another small drop. But this time, unlike before, Bitcoin may not go into a long multi-year “winter.” It could bounce back to higher levels, or even new highs, much faster than in the past.
Now , let's dive into the educational section,
🌋 The Real Nature of Bitcoin
Bitcoin rewards those who understand the market’s true behavior
It acts like digital hard money with massive upside potential
Higher risk than gold yes but the payoff can be life changing
Without knowledge risk becomes panic and panic becomes loss
🏛 Hard Money vs Fiat Traps
Fiat money constantly loses value through inflation silently
People ignoring inflation stay trapped in financial decline
Bitcoin exists to protect wealth from this invisible theft
📈 Ten Years of Proof
Buying small every month would have changed your net worth
Hype buyers get wrecked but consistent buyers get rewarded
History shows deep crashes but even higher recoveries
Every major dip eventually turned into new all time highs
🏆 The Two Traits of Real Winners
First understand fiat is designed to inflate forever
Second stay consistent for years not weeks or months
Long term players always get the long term rewards
😰 Who Loses This Game
Those who see price only not the asset’s purpose
Those with hype not strategy fall at every dip
Oversized positions amplify fear and destroy accounts
🎭 Fear and Greed Control Weak Hands
Greed at the top creates bad entries no patience
Fear during crashes triggers the worst possible exits
Market simply transfers money from emotional to patient traders
🛠 Tools of TradingView for Smarter Bitcoin Plans
Set price alerts to avoid decisions made in panic
Volume Profile reveals where strong hands accumulated Bitcoin
Supply and demand zones highlight high probability reactions
Multiple timeframes prevent tunnel vision during volatility
Summary
Understand the game stay consistent and Bitcoin can serve you
Inflation won’t stop but your wealth doesn’t have to shrink
Three Key Recommendations
Think in decades not in daily candles to stay rational
Use DCA and never invest more than your true capacity
Protect emotions first because the market pays the calm ones
✨ Need a little love!
We pour love into every post your support keeps us inspired! 💛 Don’t be shy, we’d love to hear from you on comments. Big thank s, Mad Whale 🐋
📜Please make sure to do your own research before investing, and review the disclaimer provided at the end of each post.

Last chance for Bitcoin to go upHi traders,
Last week Bitcoin dropped and broke through the Weekly FVG. But it rejected from the small bullish Daily FVG.
So this is the last chance to go up again for (red) wave 5 (or a big correction up).
Let's see what the market does and react.
Trade idea: Wait for an impulsive move up, a small correction down on a lower timeframe and a change in orderflow to bullish to trade longs.
Price is too low to trade shorts.
This shared post is only my point of view on what could be the next move in this pair based on my technical analysis.
But I react and trade on what I see in the chart, not what I've predicted or expect.
Don't be emotional, just trade your plan!
Eduwave

IM BUYING THE DIP ON BITCOINIM BUYING THIS DIP ON #BITCOIN 📈
Following my plan, level by level!
Later Shorter are gonna be REKT in my opinion! 🔴
That 0.786 fib level daily, will likely act as bottom for tonight! 📈
#BTC price is also on key dem support + highly oversell (H1) & ichimoku.
I wont be surprise to see a bull trap & fake test of the previous levels.
89,000 - 90,000$ next 📈🎯 , Then dump toward 84k- ?
A retest of the 100k previous key support before to see another crash could also be a possibility!? 👀

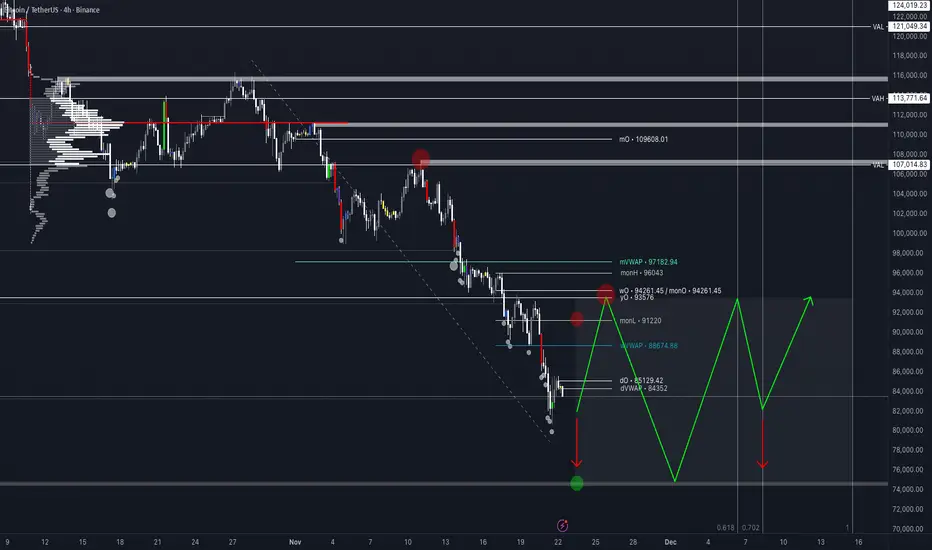
BTC temporary recovery - short term this week📌 BTC Weekly Outlook Update — Plan Remains on Track
Bitcoin continues to follow the expected roadmap with precision. The recent price action confirms a corrective move to the upside before resuming the larger bearish structure.
📍 Current Structure & Price Behavior
BTC has shown a short-term bullish retracement after forming a temporary low. However, the overall outlook remains bearish as price continues to trade below key moving averages and under the major downtrend line.
Price is now heading toward the resistance area between 94,300 and 100,780 USD, where the following confluence exists:
Previous support turned resistance
Fibonacci retracement zone
Trendline rejection zone
Liquidity pool
This area remains the most important zone to watch early this week.
📈 Expected Move — Still Valid
The original plan remains unchanged:
Short-term move upward into the supply zone at 94K → 100K.
Rejection and continuation of the downtrend.
Price targets the Fibonacci 1.618 extension zone at ~80,000 USD.
🎯 Key Target: Fibonacci 1.618 (≈ 80,500 USD)
This level is crucial as it aligns with:
✔ A major demand zone
✔ The 1.618 Fibonacci extension
✔ A deep liquidity sweep level
✔ Potential cycle correction completion
This area is expected to act as the macro support level where buyers step in aggressively.

BTC/USDT CHART UPDATE !!Bitcoin (BTCUSDT) is currently approaching a major support zone between $76,000 and $80,000. The chart shows two possible scenarios:
If support holds, a rally to $90,000 or above is possible, continuing the overall long-term bullish trend.
If support breaks, a downward move is likely to retest the lower support zone before any major recovery move can begin.
The chart suggests that this area is crucial; the next major action depends on how the price reacts to this support zone.
DYOR | NFA

Bitcoin is approaching an important support level (1D)Bitcoin has entered a strong bearish structure.
It is currently near an important origin zone that has broken significant highs (BOS). It is expected to make an upward reversal from this area.
It’s natural for this momentum to require some base-building, and since the movement is on the daily timeframe, the upward reversal may take some time.
The target range is 95K to 96K.
A daily candle closing below the invalidation level will invalidate this analysis
Do not enter the position without capital management and stop setting
Comment if you have any questions
thank you

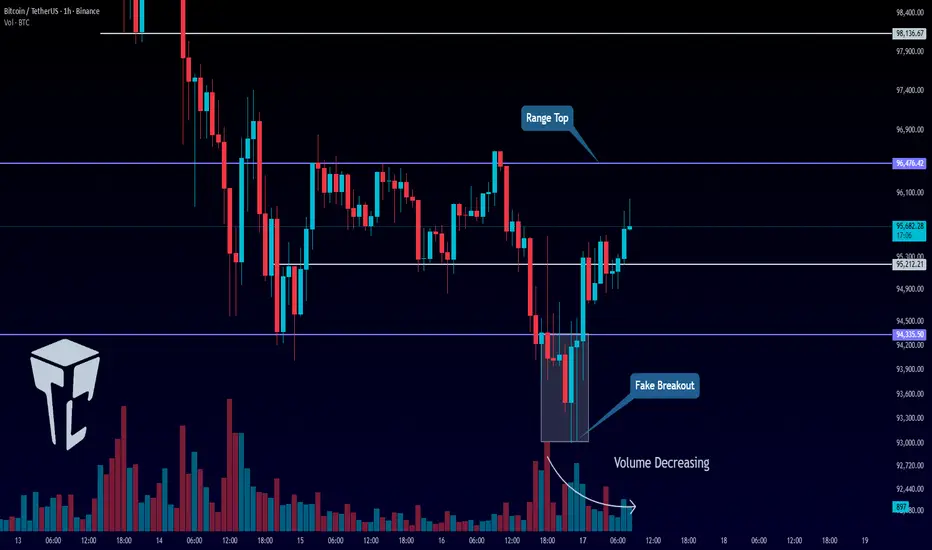
TradeCityPro | Bitcoin Daily Analysis #223👋 Welcome to TradeCity Pro!
Let’s dive into the Bitcoin analysis. Yesterday, Bitcoin made a fake downward move and is now back in its range box.
⏳ 1-Hour Timeframe
Yesterday, the short triggers we had at 95,212 and 94,335 were activated, and the price moved slightly downward. However, this bearish move turned out to be a fakeout, and the price started moving upwards again.
✅ Currently, the price has moved above 95,212 and managed to stabilize above this level. The next resistance zone for Bitcoin is at 96,476.
⚡️ The 96,476 zone was faked yesterday, and after a candle closed above it, the price moved downward. Now, we need to wait for the price’s next reaction to this level to refine the exact breakout point.
✨ After this encounter, we can open a risky long position if the level breaks on the next attempt. The next target above this level is 98,136.
📊 For a short position, since the price faked the bottom of the range, the chart is a bit messy. I personally prefer to wait for the price to establish more structure and for a new trigger to form. We can then open a new position upon the breakout of the next trigger.
💼 For previously opened short positions, we can move the stop loss above the 96,476 level.
❌ Disclaimer ❌
Trading futures is highly risky and dangerous. If you're not an expert, these triggers may not be suitable for you. You should first learn risk and capital management. You can also use the educational content from this channel.
Finally, these triggers reflect my personal opinions on price action, and the market may move completely against this analysis. So, do your own research before opening any position.
BTCIn my opinion this area will rebound the price to the previous top because it supported with FVG & Order block the price stay at this area for accumulation it’s not financial advisor it’s just my personal opinion

BTCUSDT Trending Down.Hi,
A look at BTCUSDT over a one-hour period. Based on the current daily low candle, the price is consolidating somewhat above the price low of 82129.49. We have bearish pressure at 88K that could potentially resist the current bullish pressure.
We want to see price break below 83401.72 for bearish bias to aim for potential targets of 77056.62 and 72799.55
Happy Trading,
K.
This is not financial advice.

BTC - How Low Can We Drop? DXY is just about to finish a bearish retest of a breakdown of a major multi-year bearish ascending channel, this indicated a true bull run spanning 3-7 years.
How manipulated is the crypto market? If it is to a large degree, we will likely see a “flash crash” to as low as 7,500
Personally I feel this is coming, as I’ve been indicating in my posts the last months.
Be prepared for this possibility.
- DD

Bitcoin Toxic Flows! We need to find balance. After the violent & toxic order flow selling this week on CRYPTOCAP:BTC spot holders in pain, but as traders we have a few key levels to observe. READ PREVIOUS POST ^ for dates & timing. We have major weekly level at 75k & yOPEN 93.5k.
The cleanest outcome is to auction price with organic flows, how does the market find balance? We range. This can come from a squeeze up 1st to test the 93.5k supply or rip the band aid off & give us 75k test. From there? we simply need to observe all flows with zero bias as mercenary sharp shooting traders.
80K is well supported for now. 1.49billion aggregated. But as we have seen this week, key levels breaking one after another. Either way, I would enjoy a range here, why? it simply makes for better trading.
Have a great weekend all!
BTCDaily and higher time frame indicators show CRYPTOCAP:BTC is heavily oversold and selling pressure is exhausted. This looks like a massive bear trap. I expect an inverse head and shoulders to form and price to target $170K. We have traded below the 200MA for 20 days and historically it takes 50 to 70 days before reclaiming and starting a new uptrend. This could be the biggest bear trap in Bitcoin history.

Is Bitcoin still bearish? (1D)In response to the question of whether Bitcoin is still bearish | the answer is yes.
After the drop, Bitcoin has reached a strong support zone, where it’s currently reacting and consuming lower supports. A rejection from the red zone is expected.
However, keep in mind that due to the high volume of short positions, the red zone might even experience a fakeout before the drop continues.
A daily candle closing above the invalidation level would invalidate this analysis.
For risk management, please don't forget stop loss and capital management
Comment if you have any questions
Thank You

BTC/USDT Technical Analysis, 2025-11-14 16:45 UTCBTC/USDT Technical Analysis, 2025-11-14 16:45 UTC
📈 High-Probability Buy Signal Triggered
A strong bullish reversal signal has been confirmed following a significant dip. This is not based on a single indicator—all 9 TradingView indicators aligned under heavy whale accumulation.
Key Rationale
1️⃣ Extreme Fibonacci Dip Zone Confirmed
Price retraced to and held the 0.618 Fibonacci level ($102,941.44)
Identifies a high-probability “Extreme Dip Zone”, a classic reversal area
2️⃣ Overwhelming Whale Buyer Dominance
Whale Buy Imbalance: +80.4%
Whale Activity: 10 buy orders vs. 4 sell orders
Mega Whales (≥150k USDT): 4 bids vs. 0 asks
Market Pressure: Strong Buy Pressure
3️⃣ Bullish Momentum Reversal
Momentum indicator shows a shift from SELLERS → BUYERS, signaling a short-term bullish reversal
4️⃣ Oversold Bounce Setup
Stochastic indicator confirms STOCHASTIC_STANDARD_OVERSOLD condition (K: 11.4)
Asset is primed for a bounce
5️⃣ Proprietary Pump Detection
Custom order flow & whale activity analysis confirmed the buy signal with full confidence
✅ Summary:
All 9 indicators on the TradingView chart align under strong whale accumulation in the Extreme Dip Zone, signaling a high-probability buy setup.

There is a chance BTC can return the 80K zone - Data should confEven with the increase from 80K zone to up 86.7K, BTC is able to return from this zone into the breakdown trend, where this will go exactly the coming time frames, which should be confirmed with time. We need to confirm this, the data change, and the last data shows a bitcoin that can get a correction again.

Symmetrical Triangle incoming Avoid trading during a symmetrical triangle formation
Market Indecision & Uncertainty: Symmetrical triangles represent periods where buying and selling pressures are almost equal, causing price to consolidate with lower highs and higher lows converging towards a point. There's no clear directional bias until a breakout occurs, making trade direction and timing highly uncertain during the formation phase.
Risk Management Challenges: Stop-loss placement inside the triangle is unreliable, as price often touches both trendlines without a breakout, increasing the probability of being stopped out repeatedly

$BTC Dead-Cat Bounce?Bitcoin tapped 88k after a sharp drop from 80.6k, showing a short-term recovery off the recent low. Relief rallies like this are common and don’t instantly confirm a bullish reversal.
On the 8-hour chart, price is starting to form a mini-range at this zone, similar to what we saw after the November 5 drop. The key area to watch now is the 84–82k region, we have a CME gap that might get filled around 84k as well. Any bounce from here has room to retest 90k or even push toward the yearly open at 94–96k.
However, the broader downtrend structure stays intact until CRYPTOCAP:BTC can reclaim the 94–96k zone.

DeGRAM | BTCUSD will rebound to $92k level📊 Technical Analysis
● BTC/USD formed a false break below the 82K support zone while bouncing off the long-term dynamic support line, signalling seller exhaustion and a potential mid-trend reversal.
● Price is reclaiming structure inside the descending channel; a push toward 90–92K becomes likely if buyers break the local diagonal resistance.
💡 Fundamental Analysis
● Bitcoin sentiment improves as risk appetite stabilizes and institutional inflows show signs of recovery.
✨ Summary
Support: 82K. Targets: 90K → 92K. Medium-term bullish bias while above dynamic support.
-------------------
Share your opinion in the comments and support the idea with a like. Thanks for your support!

Bitcoin Breakdown TrendlineBitcoin breakdown trendline, we can see no retest trendline right now
usually price will retest trendline, maybe something like this
invalid when closed below 80k
