U.S. GOVT SHUTDOWN.WHAT HAPPENED?After Senate Republicans and Democrats failed to reach an agreement on a new continuing resolution Wednesday, the U.S. government shut down for the first time since 2019. Leaders from both parties issued statements blaming each other, and President Trump has threatened to fire more federal workers during the shutdown.
Social security payments will continue to be made, and active duty members of the U.S. military will continue to be paid. But many other government agencies will be forced to close their doors and cease operations until a new budget bill is passed by Congress.
Why it Matters
The government shutdown will affect tens of thousands of federal employees, hundreds of government agencies, and millions of people in the United States who rely on those agencies for a wide range of services. Most federal workers will be placed on leave without pay for the duration of the shutdown, and if President Trump follows through on his firing threats, for some of those workers, the shutdown could be the end of their government service.
According to the Washington Post, the lapse in funding for the federal government means crucial government functions, from small business loan services to national parks to job training for veterans, will be halted until lawmakers pass new budget legislation. Federal work deemed essential for national security will continue.
Wednesday’s budget impasse created the twenty-second federal government shutdown in the past fifty years. The longest government shutdown lasted thirty-five days in 1995, and the shortest shutdown lasted less than one day. Thus far, leaders in both major political parties have given no indications they are ready to make concessions. Cuts to health care were at the center of the dispute this time, just like they were during the 2013 shutdown, which lasted sixteen days.
The reason for the shutdown is the lack of a normal budget process in Congress. Rather than passing a budget to cover the costs of government operations for an entire fiscal year, Congress has gotten into the habit of using continuing resolutions to fund the government. A continuing resolution is a temporary measure to keep the government funding for a set period of time, but rather than being used as a stopgap measure, they have instead become the norm.
Using continuing resolutions to fund the government is at the root of much of the dysfunction in the federal government. Because without a normal budget, many agencies have no choice but to adapt their operations to the provisions of the temporary funding bills, which can curtail and interfere with normal procedures.
Will this Impact the Market ?
1. Safe-Haven Assets like Gold and BTC prices often rise during shutdowns as investors seek refuge.
2. USD Fluctuations: The U.S. dollar might weaken initially, reflecting risk-off sentiment.
3. Delayed data like the Non-Farm Payroll (NFP) report and other Economic reports.
Historical Context
Past shutdowns have had limited long-term effects on equities if resolved quickly. However, prolonged closures (like the 35-day shutdown in 2018-2019) introduced volatility and eroded confidence.
Potential Outcomes
- *Brief Shutdown*: Minimal lasting impact, historically common.
- *Extended Shutdown*: More pronounced negative effects on GDP growth and confidence.
- *Resolution*: Markets often recover swiftly once funding is restored.
Overall, the impact depends on the shutdown's duration and the broader economic context.
BTCUSDT.P trade ideas

$BTC BTC/USDT Analysis (Daily Timeframe)
Chart Pattern
A double bottom pattern has formed around 109,000 – 110,000, which often signals a strong bullish reversal as buyers defend the same support level twice.
Key Levels
Main Support: 109,000 – 110,000 (double bottom area).
Immediate Resistance: 118,000 – 120,000 (currently being tested). A breakout above this level will confirm the double bottom reversal.
Upside Target (TP): Supply zone around 127,000 – 130,000.
Bullish Scenario
If price holds above 114,700 – 115,000 (minor support after breakout), BTC has the potential to continue toward 118,000.
A confirmed breakout above 118,000 – 120,000 will open the path toward 127,000 – 130,000.
Bearish Scenario (Alternative)
Failure to break 118,000 – 120,000 and a drop back below 114,700 may lead BTC to retest 110,000 support.
A breakdown below 110,000 will invalidate the double bottom and expose BTC to further downside below 105,000.
Conclusion
The structure currently favors the bulls with the double bottom pattern in play. As long as 110,000 holds, the medium-term outlook remains positive. A breakout above 118,000 – 120,000 would confirm the bullish bias and set the stage for a move toward 127,000 – 130,000.

BTC - Testing Key LevelHere is an update to my last post:
In my last post I was outlining how BTC was trying to hold the support of the trendline. For a brief period of time, price did breakdown to create a "false break" of the trendline.
However this still created a higher low in the trend still representing bullish momentum.
Once price reclaimed the green trendline we have seen a large rally back to the upside.
Now, BTC is testing our key level of resistance "Mid Term Resistance". This red box has acted as a great sell zone before price made a move back to the downside. So what's next?
If BTC can start closing candles above our red box then watch for these level to the upside.
Level 1: $120,000-120,400 (Key daily level)
Level 2: $123,200-124,400 (ATH)
Level 3: $129,000-$130,000 (first 1.618)
Level 4: $135,400 (predictive 1.618 top)
However, if price get rejected again from the red box, we want to see either the green trendline or green box hold to create another higher low. If we fail to create a higher low that could represent the start of the next bear market, but for now the trend is intact!

Bitcoin HOLDING THE MAIN TREND.. UPDATE 30-09-2025BTC/USDT Update
🔻 Bitcoin is currently trading below the low time frame zone, showing short-term weakness.
✅ However, BTC is still holding the main trend, which keeps the bigger picture positive.
📊 As long as the main trend support (around $110K) is defended, the market structure remains intact.
🚀 A rebound from this area could bring BTC back into the low time frame range and open the way toward $115K+.
📌 Summary:
BTC lost the low time frame, but the fact that it’s holding the main trend is a key positive signal. This level is crucial for maintaining the bullish outlook.

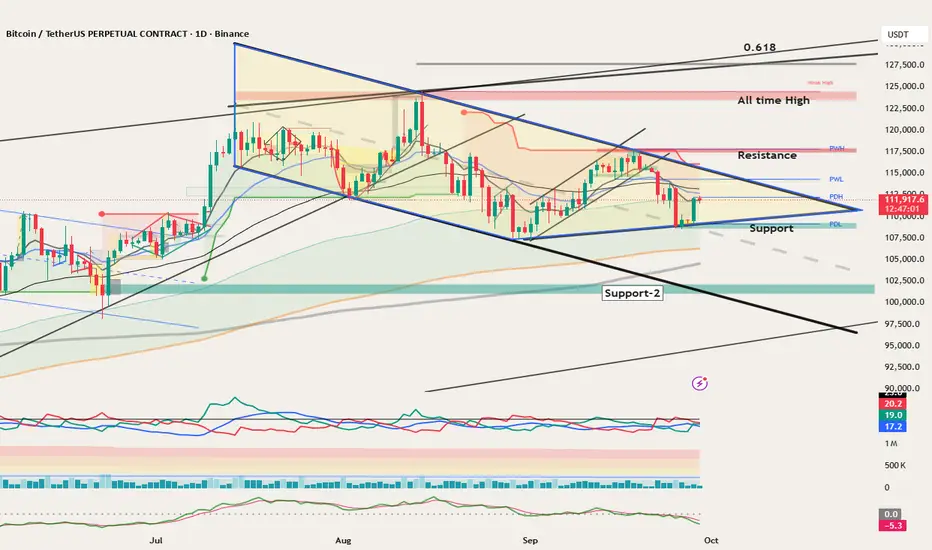
BTC coiling within daily triangle at 112k – watch 110k support aBTC/USDT daily chart shows price compressing inside a large symmetrical triangle, trading near $112K. With upcoming catalysts (NFP Oct 3, CPI Oct 15, FOMC Oct 28–29), the next breakout could set the trend.
BTC has formed lower highs since July and higher lows since June, creating a wedge. Recent support is at 108,723, with deeper support near 101,000. Resistance is at 117,711, with higher targets near 124K–126K. A breakout above 117,711 opens the way toward 128,000, while a breakdown below support risks a slide toward 101,000. EMAs are clustered, momentum is neutral, and volume is fading.
Trade Plan:
Long Setup: Break and daily close above 117,711 → enter on retest; stops below 110K. Targets: 124K–126K, extension to 128K.
Short Setup: Breakdown below 108,723 → short on retest; stops above 114K. Targets: 106K and 101K.
Takeaway:
BTC is coiling tightly within the triangle. With critical macro data ahead, a clean break beyond 117,711 or below 108,723 will likely decide the next leg.
Disclaimer: Educational content only, not financial advice.
Shorting BTC.2-Month on BTC is closing and it doesn't look great. Monthly is getting rejected as well. Daily currently as of now doesn't look good. Taking a short position.

BTC 1H Short Trade Idea First confluence is the 1H FVG, but the candle that created it had no real volume, which makes me see it as weak continuation and a potential rejection area.
The 4H trendline has been respected multiple times but also broken enough that it’s losing strength, even though it hasn’t fully given way yet.
There’s also an unfilled 1H bearish FVG that lines up as a clear downside target if structure starts breaking down. Both 1H trendlines are still trending upward, but if they give way, momentum flips quickly.
Support on the 1H is the main level I’m watching once that fails, it opens up a deeper sweep into lower liquidity zones.
Confluences
• 1H bearish FVG (unfilled) → downside target
• 1H support → break level
• 1H bullish FVG → rejection zone
• 4H TL → weakening
• Deeper liquidity zone → lower target
Bias: I’m short here. Watching for rejection off the 1H imbalance and targeting the unfilled bearish FVG and lower liquidity. A clean hold above structure would invalidate.

Trigger: 4h-close above 114,826 (Donch-H20)Snapshot of the last 4h candle + what does it mean
Price: ~114 314.7
VWAP (the entire period): ~114 199.5, z(Price−VWAP) ≈ 0.36 — the price is moderately higher than the "fair" price over 100 candles; there is no overheating according to VWAP, but there is a positive slope.
aVWAP (multiple anchors): start 114 199.5 / 60d 114 096.5 / from swing low 112 682.1 / from swing high 112 128.1 — trading above all aVWAP, trend support from below.
Donchian 20/55:
20: H 114 825.7 / M 111 969.8 / L 109 113.9 — channel of the last 20 candles; exit above H = update of the loc. extremum.
55: H 115 623.8 / M 112 086.9 / L 108 550.0 — wider context of the range.
Volume Profile (~60d): POC ~115 112.5 / VAL ~109 261 / VAH ~120 964 — currently slightly below POC, within the value zone (VAL↔VAH). POC is a magnet; VAH is the top of the demand corridor.
HVN/LVN landmarks: maximum volume nodes near POC ~115k and in the area ~121k (closer to VAH); thin spots (LVN) — ~109–110k.
RSI(14): ~67.5 — close to the overbought zone, bullish momentum.
MFI(14): ~81.1 — overbought by money, the movement was driven by volume inflow.
CMF(20): ~+0.27 — steady positive cash flow (buyers control).
MACD(12,26,9): 838 > 558, hist +280 — bullish momentum persists.
ADX(14): ~41.4; +DI 33 / −DI 15 — the trend is strong and upward.
ATR(14): ~928$ — average true range; used for buffers/stops.
Keltner: Upper 114 202 / Mid(EMA20) 112 377 / Lower 110 553 — we are standing right above the upper edge, a sign of a trend "throw."
Bollinger(20,2): Upper 115 722 / Mid 111 760 / Lower 107 798 — there is still room for the BB-Upper; there is no compression.
z(Price−VWAP) : 0.36 — a small premium to the "fair" price, allows the trend to continue without mandatory unloading.
OBV z-scores: z50 +1.54 / z100 −0.43 / z200 −0.96 — short-term inflow, medium-/long-term — not yet fully confirmed (traces of previous outflow). OBV ROC(10) ≈ −0.28 — the inflow rate has cooled locally.
Open Interest: ~67.44k, z(168) ≈ −0.79, ROC(5/10) ≈ −1% / +4% — OI is below average: some of the growth may have been due to the covering of shorts rather than the addition of fresh longs. For a sustained uptrend, it would be desirable to see a stabilization/growth in OI.
Latest divergences (by auto-detector)
RSI: bullish 22 Sep 07:00 → 22 Sep 19:00, bullish 22 Sep 19:00 → 23 Sep 19:00
MACD: bearish 17 Sep 07:00 → 18 Sep 03:00, bearish 26 Sep 03:00 → 26 Sep 23:00
OBV: bearish 17 Sep 07:00 → 18 Sep 03:00, bearish 26 Sep 03:00 → 26 Sep 23:00
MFI: bullish 23 Sep 19:00 → 25 Sep 23:00, bearish 26 Sep 03:00 → 26 Sep 23:00
How to interpret: a bullish divergence increases the likelihood of a rebound/continuation upwards; a bearish divergence increases the risk of a rotation/correction. Signals are more reliable when confirmed by a candlestick pattern + OBV/CMF.
What does this mean now
The momentum is strong: MACD↑, ADX>40, CMF>0, and the price is in a trending mode at Keltner-Upper.
Position relative to the profile: we are inside the VA and close to POC ~115k, which is an area of equilibrium; the market likes to test/balance around POC.
Risks of "hotness": RSI≈68 and MFI>80 indicate short-term overheating of money; without OI support, there may be откаты к средним значениям перед новым импульсом.
VWAP context: z(Price−VWAP) is low (≈0.36), and all aVWAP are lower, indicating that buyers are in control.
Key levels
Resistances: 114 826 (Donch-H20) → 115 113 (POC) → 115 624 (Donch-H55) → ~118k (inter-nodal zone) → 120 964 (VAH).
Supports: 114 202 (Keltner-Upper/Return boundary) → 114 096 (aVWAP 60D) → 112 377 (EMA20/Keltner-Mid) → 112 087 (Donch-Mid55) → 111 970 (Donch-Mid20) → 109 261 (VAL) → 109 114 / 108 550 (Donch L20/L55).
Scenarios and triggers (not the financial council)
A) Continuation of the upward trend is the basic trend.
Why is it the basic trend: convergence of momentum metrics (MACD+, ADX>40, CMF>0, aVWAP control), moderate z(Price−VWAP), and proximity to POC (often broken by the trend).
Trigger: 4h-close above 114,826 (Donch-H20) with buffer ≈ +0.1·ATR ≈ +93$ → > 114,920, with CMF>0 and OBV z50 ≥ 1.0.
Targets: 115 113 (POC) → 115 624 (H55) → ~118k → 120 964 (VAH) with normalization/growth of OI.
Invalidator: quick rollback and fixing below 114 202 (return to Keltner) and below aVWAP 60d 114 096.
B) Rotation to the averages / reload.
Trigger: 4h-closing below 114 202, RSI < 60 / MFI < 70, weakening of the MACD histogram, while OI↑ on the fall.
Targets: 112 377 (EMA20) → 112 087 / 111 970 (Donch Mid 55/20) → 109 261 (VAL) → 109 114 / 108 550 (L20/L55).
Cancel: return and hold above 114 826 with OBV recovery.
C) Quick short squeeze up.
If a set of shorts (OI↑) starts near POC and the price does not give back, a breakout > 114 920 with a fall in OI on a green candle ⇒ closing shorts and accelerating to 115.6k → 118k → 121k.
Tactics (example of logic)
Impulse long: after fixing > 114 920. Partial fixation at 115 113 and 115 624, then a trawl to the zone 118k → 121k. Stop under 114 202 (or under the retest level).
Reversal long (conservative): zones 112.4k–112.1k (EMA20 / Donch-Mid55) at signs of demand (CMF>0, candle reaction, OBV z50 turns up). Stop — below 111.9k, targets — 114.2k → 114.8k/115.1k.
Contra-trend short: only if 114.8k–115.6k is rejected + RSI/MFI reversal down and weak MACD histogram. Targets are 114.2k → 112.4k → 111.9k, stop at 115.7k.
In short: what to expect
The bullish trend is active, but the money is overheated (MFI>80), and the OI is below average.
If we consolidate above 114.9k, it is logical to break through to 115.1k → 115.6k → 118k, and with a good flow, to 121k (VAH zone).
If we return below 114.2k, a rotation/reboot to 112.4k–112.0k is likely; a deep scenario leads to VAL ~109.3k.

Short Term (until Friday)The price is in range or pullback, stay awake and ready to get aboard the train. You can enter now or wait until tomorrow. Market needs liquidity. Next Stop 117K--118K. Make the right choice. Good trades to everyone

BTCUSDT.P - September 30, 2025BTC looks primed to bounce off the 0.236 Fib ($98.8k) and the weekly 50EMA confluence, setting up the next leg higher toward the $124.5k breakout and $150k extension.

BITCOIN BITCOIN WATCH 114-116 ZONE descending trendline rejection and break and close will be 119-120k.
then we will change our chart to reflect the new upswing.
#btc #bitcoin

BTCUSDT.P SHORTBTCUSDT.P SHORT
The market has the potential for an downtrend
Price: 111658.3 $
Main target 110156.0 $
SL 114334.0 $

First Major Bounce 81.1kThe last Short was clearly premature, and was based purely on a technical level. Volume bust through it. Had I have waited for a stall and confirmed Distribution, the situation would have been better.
Now that Shorts have been wiped, and the majority of the market is in a Long, I believe we can now drop to the first major bounce at 81.1k.
When one side starts winning for an extended period of time, the losing side becomes "Unfavourable". Many who opened a Short and lost, fear opening another.

Very important Bitcoin will soon reach the 41k areaVery important Bitcoin will soon reach the 41k area

#BTCUSDT 4H ChartPrice is currently retesting the S/R Flip at 113k where it is bouncing from as well as the 100MA. MACD is showing some bullish weakness, RSI is bought and EMAs are turning bullish. Price is expected to keep pushing up aiming towards the 115.5k area where we have a minor supply zone.

BTCUSD trading plan Hi traders we are still in a strong bull run however many get confused during pull backs,note that we have a gap at 110 am expecting it to be close before take off if not its gonna be closed after some few mouths note that we do left some gaps but always come bek for them,am not going to change any trend before its done my first target for btc is 150k followed by 180k then we can sell higher but anything that is happening now is pure manipulation n am aware of that,use each dip as a chance to position yourselfs people's will always come with different opinions make sure you follow the right once,this the trend its up to you,do the work.

BTC Update – Monday, 29.09.2025🚀 BTC Update – Monday, 29.09.2025 🚀
Bitcoin gave us some real fireworks over the weekend! 🎇 After hunting stop losses on both buy and sell sides, price quickly reversed and pumped back into the zone of indecision.
📌 In my last analysis, I mentioned two key levels:
* 113,460
* 116,310
Last week, BTC broke downside of 113,460, which was the first confirmation of a downtrend wave. But guess what? The market didn’t confirm the breakout – instead, price snapped back up, showing that bulls are still alive and fighting! 🐂🔥
👉 My view remains the same:
* If BTC breaks above the Yellow Line (Arrow #1) → we enter super bullish mode 🟢 and momentum can explode higher.
* If BTC fails to break and gets rejected from there → we could see a drop towards 100K 🔻.
* On the higher time frame, BTC is still in a range between Arrow #1 and Arrow #3. Until one side breaks cleanly, we stay patient and let the market decide the real direction.
💡 Reminder for all traders: Sometimes the best trade is no trade. Let the price confirm – don’t rush. Patience = Profits! 🧘♂️💰
⚡Stay focused, stay motivated, and remember – market shakeouts are designed to test weak hands. Strong hands win in the long run. 💪🔥

BTC/USDT - BREAKOUT Or BREAKDOWN AHEADThe price is currently trading around the 112,112 USDT level with slight intraday fluctuations. The chart highlights a key horizontal support and resistance (S/R) structure with two red horizontal lines marking these zones.
1. Resistance (R) Zone
The upper red horizontal line, marked as “R,” is acting as a resistance level around the 112,400 USDT region. Price has tested this level multiple times in the recent sessions. A clear breakout above this resistance could signal further bullish continuation.
2. Support (S) Zone
The lower red horizontal line, marked as “S,” is situated around the 111,600 USDT level. This zone has provided a strong demand base for buyers. If the price retraces, this level will act as a critical support.
3. Current Price Action
At the time of observation, Bitcoin is consolidating right above the resistance zone, suggesting a possible breakout attempt. The candlesticks indicate bullish momentum leading into the resistance, with a series of higher lows forming before the test of resistance. This pattern reflects increasing buying pressure.
4. Possible Scenarios
• Bullish Scenario: If the price successfully breaks and holds above the resistance zone (R), it may trigger a move towards the next target to the upside, projected around the 112,800 – 113,200 USDT region. The structure suggests the possibility of forming a bullish continuation pattern, with traders targeting higher resistance levels.
• Bearish Scenario: If the breakout attempt fails and Bitcoin gets rejected at resistance, price could retrace downward. A move below the support zone (S) at 111,600 USDT would likely signal bearish momentum, with the next target projected around the 111,200 – 110,800 USDT range.
5. Market Sentiment
The price action is consolidating in a range-bound structure between support and resistance. This often reflects market indecision before a breakout. A breakout from this range, either above resistance or below support, will provide a clearer directional bias.
⸻
Conclusion:
The BTC/USDT 15-minute chart is currently at a critical juncture. Traders should closely monitor whether Bitcoin sustains above the 112,400 resistance to confirm a bullish breakout, or if it fails and drops back below support at 111,600, signaling bearish continuation. Patience and confirmation of breakout direction are key before entering new trades.

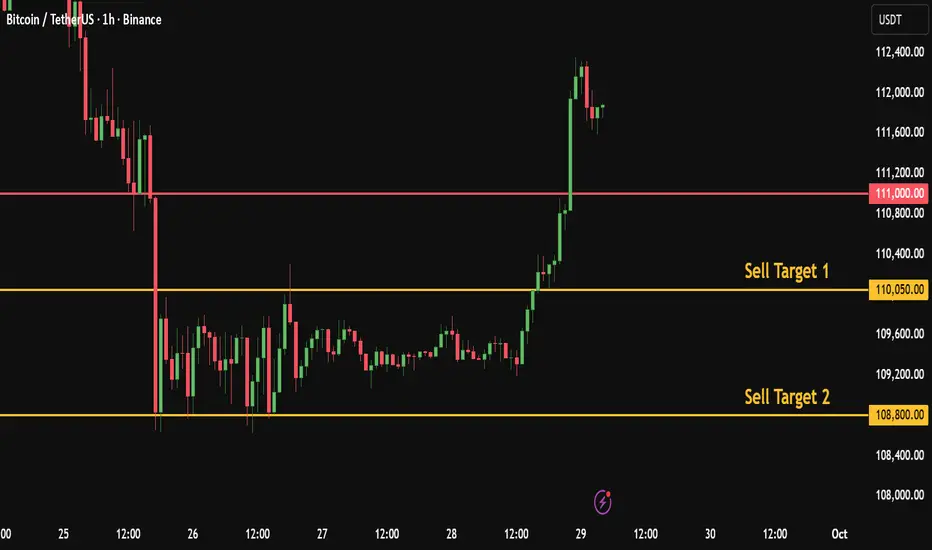
Daily Bitcoin Signal: Watching the 111K Breakout, target 108KBitcoin Daily Numeric Analysis
Based on my numeric analysis, Bitcoin is showing potential weakness near key support.
My Personal Short Setup
If price breaks and closes a 1H candle below 111K, I will enter a short trade.
🎯 Target 1: 110,050
🎯 Target 2: 108,800
❌ Stop-loss: 112,700
👍 Don’t forget to boost this trading idea if you found it helpful,
and follow me for more daily crypto insights and trade setups.
Please note:
This is not financial advice – I’m only sharing my personal trades.
Always do your own research before taking action.
Best of luck 🌹
BTCUSDT.P - September 29, 2025BTC is holding above 112k after rebounding from strong 108k–107k support. Bulls want a clean break over 113.2k to target 124.5k and 131.9k, while bears see rejection here as a setup for another drop to the 108k zone. Key risk is repeated failure at resistance; upside only confirms if 113k is reclaimed with strength.

BTC 1H Analysis - Key Triggers Ahead | Day 46👋🏻 Hi, how are you?
❄️ Welcome to the cryptos winter , I hope you’ve started your day well.
Shall we jump into the Bitcoin analysis?
⏰ We’re analyzing BTC on the 1-Hour timeframe.
👀 On the 1-hour timeframe for Bitcoin, we can see that after the recent drop, Bitcoin has formed a trading structure between a resistance and a support zone. A breakout from this structure — either to the upside or downside — could provide a trading opportunity. Currently, Bitcoin is trading near its resistance at $113,146, while holding support around $111,780. A break of either level may trigger the next move.
🧮 Looking at the RSI oscillator, after exiting oversold conditions, it’s now hovering near the 50 zone. Two key RSI levels to watch are 40 and 56; breaking above or below these levels could set the stage for Bitcoin to start moving out of its current structure.
🕯 The candle size and volume have increased when testing the $11,780 support, indicating the presence of buyers. However, the issue is that the number and volume of red candles are still dominant. The key question is whether buyers will step in strongly this time to defend support.
🧠 For positioning, it’s worth keeping a close eye on altcoins such as AVAX, which has shown strong upward momentum and recovered much faster compared to Bitcoin. Recently, Google search trends also indicate stronger interest in altcoins and the broader bull run narrative. That’s why Bitcoin might not be the best option for long-term positions right now. Even if you take a BTC trade, the potential might only extend to reward ratios like 1:2 or 1:3. Instead, focus more on altcoins that are showing bullish trends against Bitcoin.
❤️ Disclaimer : This analysis is purely based on my personal opinion and I only trade if the stated triggers are activated .

Bitcoin Analysis –> The Critical Resistance ZoneHello guys!
Bitcoin (BTCUSDT) has been moving within a well-defined ascending channel since early September, showing consistent higher lows and higher highs. Currently, price action is approaching a major resistance zone (highlighted in blue), around the $118,000 – $119,500 level.
----------Why the Blue Zone is Critical----------
This area has acted as a historical supply zone, where sellers have previously stepped in to push prices lower. It represents a significant hurdle for the bulls, and the next move from here could determine Bitcoin’s medium-term trajectory.
Bullish Scenario (Red Path):
If BTC breaks above the blue resistance area with strong momentum, it could confirm a breakout continuation. In this case, Bitcoin has the potential to test $120,000+ and eventually aim for new all-time highs (ATHs) within the ascending channel structure.
Bearish Scenario (Blue Path):
If the price fails to clear this resistance, a rejection could send BTC back to retest the channel’s lower boundary near $115,000–$114,500. Holding this support would be crucial to maintain the bullish structure. A breakdown from the channel would signal a potential trend reversal.
Key Levels to Watch
Resistance (Blue Zone): $118,000 – $119,500
Immediate Support: $115,000 – $114,500 (channel bottom)
Upside Target (if breakout succeeds): $124,000 – $125,000
Conclusion
The blue resistance zone is the make-or-break level for Bitcoin right now. A successful breakout could be the start of a new bullish leg toward ATH, while rejection here might trigger a healthy correction within the channel. Traders should closely monitor price action in this area before making directional decisions.

Bitcoin: What's Next?My Philosophy & Approach
My foundation is the pure chart. I don't consider news or outside opinions, as I see them as secondary. All primary information is already in the price. Of course, no one can give a 100% forecast. The crypto market can fall sharply just as it can rise sharply. This uncertainty must be accepted as the norm. This is why I work from risk, not from expectations.
General Market Sentiment & BINANCE:BTCUSDT.P Analysis
In my opinion, a bearish sentiment prevails in the market. After its drop, Bitcoin isn't having a deep correction but is re-testing the level where the decline stopped, which is a sign of seller pressure. Currently, the price is grinding the 111,959.5 level, but I don't see a strong reaction from buyers even on false breakouts. This indicates their weakness. Although the trading zone of Sept 3-10 creates an obstacle, I am still leaning towards a further decline.
Asset Selection Criteria in Current Conditions
After high volatility comes a dangerous time, so I am especially careful in selecting assets based on two criteria:
Strength Against the Market: Assets that are rising despite the general fall. This indicates the presence of a large buyer.
A Clear Stop: Assets that, after a sharp decline, stopped precisely at a level where large capital absorbed all sales.
