BTC target 145 before crashingBTC is moving in a rising channel my target is 145k area in next month, where I expect the end of bullish cycle started in 2020 and a massive crash of bitcon to 40k-50k range
BTCUSDT.P trade ideas

Is BTC affected by SELL the news?Analysis of BTC:
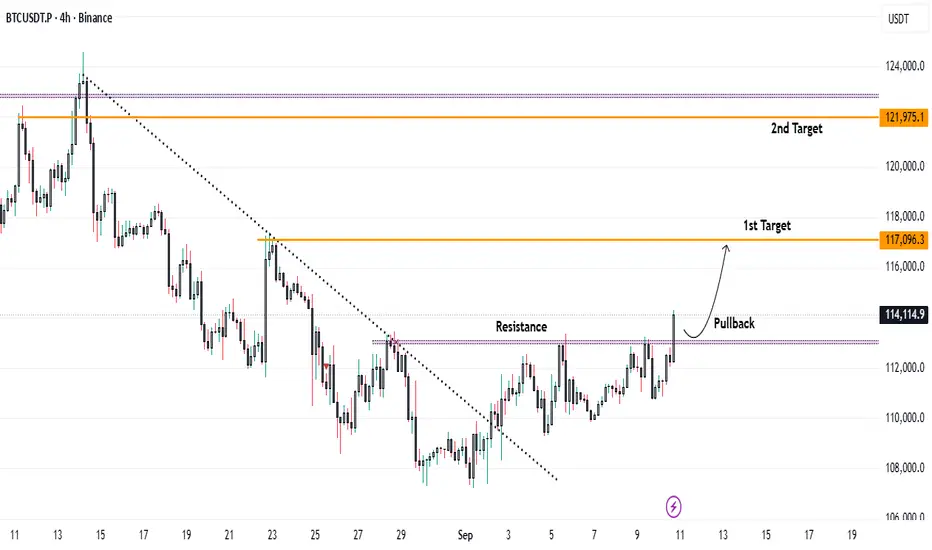
BTC is fluctuating around the 114k – 115k range, which is an important equilibrium zone. If buying pressure holds strong, the price could move toward the 118k resistance area – a key level that will determine the upcoming trend.
• Scenario 1: If BTC successfully breaks above 118k, the uptrend will be reinforced, with the next target at 123k – 124k.
• Scenario 2: If rejected at 118k, the price will likely retest 112k – 110k before recovering.
Summary: The overall trend still leans bullish, but 118k is the crucial resistance zone to watch closely in order to confirm the next direction.

BTC - Are the bulls looking for a liquidity grab?Market Context
Bitcoin is holding strong after bouncing from a higher support zone and is now pressing into an area packed with liquidity. The recent bullish price action has carved out multiple fair value gaps on the way up, each serving as confirmation of demand and strengthening the bullish structure. Above current price lies a major cluster of buy-side liquidity — a magnet for price.
Fair Value Gaps & Confirmations
On the way up, price created several bullish fair value gaps that have each been respected as support. The first, second, and now third retests into these imbalances show that demand continues to step in, absorbing supply and building pressure upward. Adding to that, a bullish inversion fair value gap (IFVG) has formed, giving extra confirmation that buyers are in control.
Liquidity Target Above
The most obvious draw for price is the heavy buy-side liquidity resting above recent highs. With so many stops positioned there, the market is incentivized to push higher and sweep that zone. The path toward it could involve another retest into one of the fair value gaps below before expansion takes place, or a direct continuation straight into the liquidity pocket.
Final Thoughts
This structure is showing textbook bullish strength: stacked fair value gaps, IFVG confirmation, and a clear liquidity pool overhead. Unless the market breaks back below the deeper support zone, the expectation remains a run into buy-side liquidity.
If this breakdown sharpened your view, a like is appreciated — and I’d love to hear from you: do you expect a retest first, or do we shoot straight into liquidity?

Bitcoin Breaks Key Resistance – Upside Targets in Focus...Bitcoin has been consolidating below the $113,000 resistance level over the past few sessions. On the hourly timeframe, price has now successfully broken above this barrier and is sustaining the breakout.
📈 Trading Outlook:
* A pullback towards $113,000 could offer a favorable long entry opportunity.
* Upside Targets:
* First target: $117,000
* Second target: $122,000
The breakout and successful close above resistance suggest strong bullish momentum, provided price holds above the $113,000 zone.
BTC's situation+next targets and expected movementsThe price seems to have completed the corrective wave, and from now on, it's time for a price increase, which will continue up to around $150k .
_ _ _ _ __ _ _ _ _ _ _ _ _ _ _ _ _ _ _ _ _ _ _ _ _ _ _ _ _ _ _ _
✅Thank you, and for more ideas, hit ❤️Like❤️ and 🌟Follow🌟!
⚠️Things can change...
The markets are always changing and even with all these signals, the market changes tend to be strong and fast!!

BTC/USDT – 1H Outlook
Bitcoin is currently facing pressure from a significant supply zone. After testing the area, price showed a strong rejection, highlighting seller dominance at these levels. The broader structure remains bearish, suggesting that the recent upward moves may only be corrective retracements rather than a true trend reversal.
Should rejection persist within supply, it may trigger continuation to the downside, potentially driving price toward lower key levels. On the other hand, a decisive breakout above supply would delay bearish confirmation and could allow buyers to extend the rally further.
At this stage, the supply zone acts as a decisive area for the next direction, making it crucial to observe how price reacts in this region.


The Technical Analysis Superpower (That Isn’t Real)Imagine this: You spot the perfect candlestick pattern. It feels like the market’s secret code just unlocked. You hit buy. An hour later you’re staring at a loss, asking yourself: “What the hell just happened?”
That’s the illusion of control at play. I’ve been there. We all have.
How the illusion shows up:
You believe one pattern guarantees the next move.
You stack indicators thinking more = more control.
You convince yourself you’ve finally “cracked the code.”
The emotional side:
It feels good to play wizard. Technical analysis (TA) gives us tools, but it doesn’t give certainty. The market doesn’t care about your Fibonacci line or your perfect breakout. TA only tilts the odds—not controls them.
So what actually matters?
Keep it simple: 2–3 tools max. Start with trend. When you are following the higher timeframe bias, you are following the trend. The top 5-6% of traders get 90-100% of their profit from a selective bias.
Always ask: “If I’m wrong, where’s my exit? wher's my Stop loss?”
Backtest and track results. Aim for probability, not perfection.
Respect patience. Most fakeouts die fast—wait for confirmation.
Bottom line:
TA is not a superpower. It’s a probability framework. The real edge isn’t in control—it’s in discipline, trend recognition, and managing yourself when the market doesn’t care.
👉 What’s your biggest illusion of control story? Drop it in the comments—I want to hear how TA has tricked you.
— Skeptic

Bitcoin Go 140kAfter the interest rate cut, another upward step to the range of $138,000 to $140,000

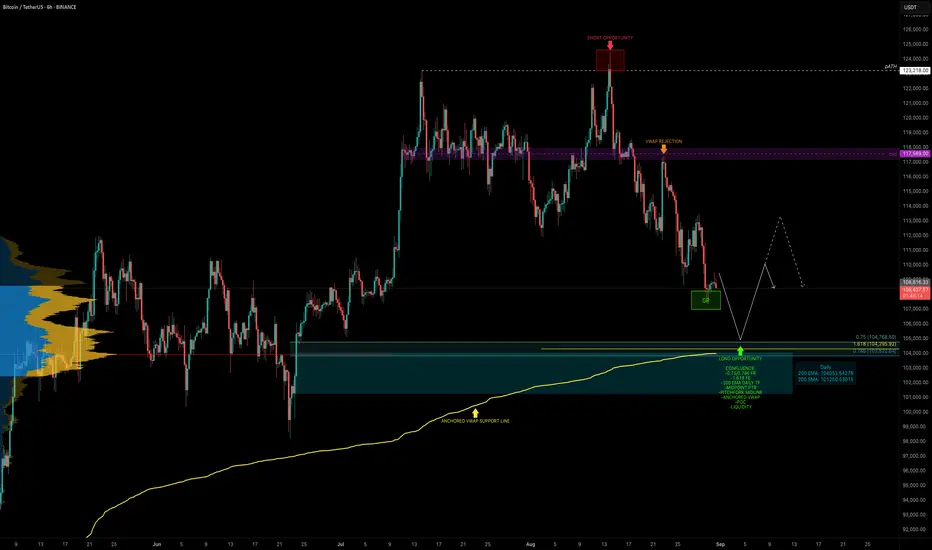
BTC — Identifying High-Probability Long Zone With ConfluenceBTC has been in a 17-day downtrend since the swing failure at the ATH (~$124.5K). That move acted as both a bull trap and the completion of a 5-wave structure, offering an excellent short entry at the highs.
Now the key question: where is BTC heading next, and where is the next high-probability trade setup?
Current Situation
BTC is sitting at the 0.618 Fib retracement ($108,236) of the move from $98.2K → $124.5K. Many traders are already buying this level, which is valid but a deeper zone below offers stronger confluence.
🧩 Confluence Zone: $105K–$104K
POC of the previous trading range → ~$104K
0.75 Fib retracement: $104,768.5
0.786 Fib retracement: $103,823
Anchored VWAP (from swing low $74,508) → just above the 0.786 Fib
Midpoint of the previous 60-day range
Liquidity cluster → positioned around $105K–$104K
1.618 Fib extension target: $104,296
Pitchfork midline → supporting this level
200 EMA (daily) → adding dynamic support at ~$104K
This creates a high-confluence support cluster between $105K–$104K, making it the next strong long setup.
🟢 Long Trade Setup
Entry Zone: $106K–$104K
Stop-Loss: Below $103K
TP: $110K-$114K
R:R Potential: 1:2+
Technical Insight
The ATH rejection confirmed both bullish exhaustion and a completed 5-wave move, triggering the current correction.
While the 0.618 retracement offers valid support, the $105K–$104K zone holds significantly stronger confluence.
This makes it the most attractive high-probability long entry zone in the current structure.
🔍 Indicators used
Multi Timeframe 8x MA Support Resistance Zones → to identify support and resistance zones such as the daily 200 EMA/SMA.
➡️ Available for free. You can find it on my profile under “Scripts” and apply it directly to your charts for extra confluence when planning your trades.
_________________________________
💬 If you found this helpful, drop a like and comment!
BTCUSDT D1BTCUSDT is still in an uptrend. Given that it has reached a resistance level, a price correction toward the specified zone is expected. If it reaches the support levels, it could present a good buying opportunity after confirmation.

[BTCUSDT] is preparing for a potential reversalOn the daily chart, BTC is currently forming a pin bar candlestick, signaling the possibility of a trend reversal. If no new selling pressure emerges within the next 8 hours, I expect BTC to confirm the pin bar close and break above the downtrend line. In this scenario, the price could rebound toward the 117k area before establishing a new trend.
Before the daily candle closes, investors should carefully observe whether fresh selling pressure appears.
This analysis is for reference only and should not be considered as financial advice.

BTC Analysis — Long-Term Buy Zone AheadI'm watching $111,000 as a major buy zone on Bitcoin.
If price retraces to that level, I’ll be ready to enter a long position.
This is not a prediction — it’s a scenario.
Smart traders don’t guess, they prepare.
Let price come to your level. No chasing.
📍Set your alerts and stay patient.

Bitcoin Short Opportunity Before the Next Leg UpBitcoin is currently showing noticeable weakness in buying momentum.
Most likely, it will drop to the 113K–112K area to retest before moving higher again.
✅ My Personal Strategy:
Entry (Sell): 115,600
🎯 Target 1: 114,000
🎯Target 2: 113,600
Stop-Loss: Daily close above 117,400
Please note:
This is not financial advice – I’m only sharing my personal trades.
Always do your own research before taking action.
👍 Don’t forget to like if you found this useful, and feel free to follow me for more analysis of this kind.
Best of luck 🌹

#BTC: Daily AI Market Breakdown. 2025/16/09Howdy, crypto-warriors and lords of volatility! NeuralTraderingPro is back on the air to decipher the language of charts and orders for you. It’s Tuesday, September 16th, and the market is charged with so much energy you could mine it! ⚡️ Let's see who's calling the shots today.
📜 FORECAST REVIEW: BULLS HELD THE LINE
My analysis from yesterday turned out to be a treasure map! I emphasized the rock-solid support wall at 114,750 USDT and suggested an aggressive Long 1 trade idea: "Buy at current values with a tight stop just below the support wall." This exact scenario played out perfectly! The bears couldn't breach the bulls' defense; the price bounced off that level and surged upward, reaching current marks around 115,800 USDT. The primary bearish breakout scenario was invalidated. Congratulations to everyone who took advantage of this idea and caught the bounce! It was a classic demonstration of how crucial it is to read the order book.
📊 CURRENT SITUATION: CHART AND INDICATOR ANALYSIS
Current Price: 115837.56 USDT
📈 Daily Chart (1D): The global bullish trend is undeniable. The price is confidently holding above the SMA 20 and SMA 50 moving averages. The RSI is at 60, indicating strong buying momentum but still leaving room for growth before hitting the overbought zone. The MACD histogram is rising in the positive zone, confirming the strength of the trend. The structure looks very confident for continued ascent.
💹 4-Hour Chart (4H): Here, we see a picture of bullish triumph. The price didn't just bounce; it broke through local resistance and is now trading above the SMA 20 and SMA 50, which have transformed into dynamic support. Bollinger Bands have begun to expand, and the price is hugging the upper band—a clear sign of buyer strength. RSI is above 60, and MACD is confidently rising above the zero line. All signals point to preparation for the next upward impulse.
⏱️ 30-Minute Chart (30m): On the smaller timeframe, we see the current phase: consolidation after yesterday's rally. The price is moving in a narrow sideways channel, accumulating strength. RSI is oscillating around the neutral zone, and MACD shows a fading momentum. This is a typical breather before the next move. The key support zone here is 115,500 USDT.
📋 ORDER BOOK ANALYSIS: THE BATTLE FOR 115,837
The main battle of the day is unfolding right now!
🟢 Support Walls: Below the current price, buyers have placed several support levels in the 115,822 - 115,804 USDT range. They don't look massive, but their purpose is to cushion small pullbacks.
🔴 Resistance Walls: And here's where it gets interesting! Right at the current price of 115,837.56 USDT, there's a colossal sell wall of over 12 BTC (worth approximately $1.4 million)! This is the main barrier preventing the price from taking off right now. Sellers have concentrated all their power at one point.
Conclusion: The fate of the immediate movement is being decided here and now. If buyers "eat through" this $1.4 million wall, it will be a powerful signal of their strength and could trigger a sharp price surge upward (short squeeze), as the next significant resistance is higher up.
📰 MARKET SENTIMENT AND KEY THEMES
The news background is clearly favoring the bulls and is filled with expectations of growth.
1. 💳 PayPal is lighting the fire! The integration of BTC and Ethereum for P2P payments in PayPal is fundamentally powerful news. It significantly expands cryptocurrency use cases for millions of users and is a long-term growth driver.
2. 💵 Dollar under pressure. Ahead of the Fed's decision, the US Dollar is weakening. The market is pricing in expectations of an interest rate cut, which historically makes risky assets like Bitcoin more attractive.
3. 🐂 Analysts are sounding the horn. Several sources are pointing to bullish technical signals and pattern formations, forecasting a rally to $122,000. In particular, the importance of breaking the $117,500 level to confirm the rally is noted.
4. 🚀 Historical optimism. Renowned analyst Tom Lee predicts a "grand rally" in Q4, fueling long-term bullish sentiment. Interestingly, historically, September is often a turning point. For example, in September 2021, the market was also actively discussing Ethereum valuations and its approach to new highs, creating a generally positive mood.
5. 😐 Fear & Greed Index in neutral zone. The market is not overheated with euphoria nor paralyzed by fear. This is an ideal state for forming a strong and healthy trend movement.
🔮 FORECAST AND KEY TARGETS FOR THE WEEK (September 16-23)
All factors—technical analysis, news background, and sentiment—point to a high probability of continued growth. The only obstacle is the huge sell wall at the current price. A breakthrough of this level will be the main bullish trigger of the week.
Scenario Probability: Long 📈 (65%) / Short 📉 (35%)
🎯 Key targets for the upcoming week:
UP Targets (in case of resistance wall breakout):
1. 🐂 117,500 USDT - Key level mentioned by analysts. Its breakthrough will confirm the start of the rally.
2. 🐂🐂 119,000 USDT - Important psychological resistance, the next target for profit-taking.
3. 🐂🐂🐂 122,000 USDT - Optimistic target for the week, based on technical patterns.
DOWN Targets (in case of rejection from the wall and correction):
1. 🐻 115,000 USDT - Return to the psychological mark and recent support zone.
2. 🐻🐻 114,200 USDT - Local low from September 15th, an important support level.
3. 🐻🐻🐻 112,500 USDT - Deep correction in case of a shift in market sentiment.
💡 TRADING IDEAS
1. Long Positions (Long) — playing the breakout.
Trading Idea Long 1 (Aggressive): Buy immediately after a break and sustained price above the wall at 115,900 USDT. This would signify buyers have won. Target: 117,500. Stop-loss: 115,450 USDT.
Trading Idea Long 2 (Conservative): Buy on a pullback to the support zone of 115,000 - 115,200 USDT, if the market provides such an opportunity. Targets: 117,500, 119,000 USDT. Stop-loss: 114,400 USDT.
2. Short Positions (Short) — playing against the trend.
Trading Idea Short 1 (Risky): Sell at current values, betting that the $1.4 million wall will hold. Target: 115,000. Stop-loss: very tight, at 115,950 USDT.
Trading Idea Short 2 (On structural breakdown): Short only if the price falls below the 4H chart support and consolidates below 114,800 USDT. This would signal a false breakout upward. Targets: 114,000, 112,500 USDT. Stop-loss: 115,500 USDT.
🛡️ CONCLUSION AND RECOMMENDATIONS
The market is bullish. Positive news and a strong technical picture create favorable conditions for growth. The key is whether buyers can absorb the massive sell order. This will determine short-term movement. I recommend acting situationally: either join the breakout or catch a pullback to strong support. Control your risks and always use stop-losses 🛡️, as volatility can be high.
May your deposits multiply! 💰 Don't forget to like 👍 this analysis and subscribe to always stay on top of the hottest trends!

16-09-2025 BTCUSDTAs shown in the figure: 30M Bullish Cypher
The market is not always chaotic and disorderly, and there is a precise geometric beauty hidden in price fluctuations. The harmonic form long strategy is a powerful tool for accurately identifying potential market reversal points based on the Fibonacci ratio. When the form forms perfectly at the key support level, it often indicates the depletion of bearish momentum and the initiation of bullish trends.

#BTCUSDT 4H ChartPrice is still consolidating between the EMAs and the resistance area at 116.5k. MACD is showing bearish weakness, RSI is bought and EMAs are bullish. Price needs to break above that area of resistance in order to expect further bullish movements.

BITCOIN BTCUSDTBITCOIN ,bulls are holding the price, if they come back for retest in the zone of 112500-113000 look for point of entry from lower time frame and go long.
but if the fail from the retest zone sell and hold till we get 90k zone
#BITCOIN #BTCUSDT

BTC pressing $117k–$118k supply — watch the break or fadeIntroduction:
BTC is testing a stacked resistance zone around $117k–$118k on the Daily/4H while the Weekly trend remains broadly up. Price has printed a sequence of higher lows since early September inside a rising channel. My invalidation for the bullish case sits below $114k (last notable swing-base / channel support).
Chart Read (bullets):
• Trend & Structure: Weekly uptrend intact; Daily/4H show ascending structure with consecutive higher lows. A larger down-sloping trendline from the prior peak still caps price near $118k–$119k.
• Key Levels: Resistance $117k–$118k (labelled “Eyes on 18000” on chart); overhead supply/ATH zone $124k–$125k. Supports: $114k (recent swing/median), $106k–$105k (Major Support-1), and $100k area (Major Support-2).
• Pattern/Triggers: 4H rising channel; price compressing under horizontal supply and descending trendline. Break/close above $118k = bullish trigger; failure/rejection here = short setup back toward $114k.
• Indicators (from chart): RSI hovering near ~59–60 on Daily (not overbought). Short/medium EMAs are rising with price trading above them (periods not labeled). ADX shows trend strength around ~23 with +DI above −DI. Volume has been moderate; an expansion would confirm the move.
Trade Plan (risk-managed):
Long Setup: Consider on a decisive Daily/4H close above $118k or a clean break-and-retest of that zone turning it to support. SL: below $114k (or channel base), allowing for wick noise. TP1: $121.5k–$122k (intermediate supply). TP2: $124k–$125k (ATH supply). Aim for ~1:2–1:3 R:R.
Short Setup: If price rejects $117k–$118k with bearish reversal (long upper wicks / momentum roll), consider a short toward $114k. SL: above $119.5k–$120k (above trendline/supply). TP1: $114k. TP2: $106k–$105k if momentum accelerates.
Note: Multi-week compression under supply often precedes an explosive move; confirmation (close + volume) matters more than the first poke.
Upcoming News/Events (Top 3):
• FOMC rate decision — Sep 16–17, 2025. Policy shift or guidance can swing liquidity and risk appetite.
Federal Reserve
• CME BTC futures & options quarterly expiration — Fri, Sep 26, 2025 (last Friday). Position rolls/hedging can amplify volatility.
CME Group
+1
• TOKEN2049 Singapore — Oct 1–2, 2025. Major crypto conference; headlines/fund flows can influence sentiment.
TOKEN2049
+1
Educational Takeaway:
A break-and-retest is simply price closing through a key level, then pulling back to that same level and holding it as support (or resistance). It filters fake breakouts: the retest shows whether supply/demand truly flipped. Pair it with rising EMAs and a supportive RSI to improve odds and define your stop objectively.
Conclusion:
Bias is constructively bullish only on acceptance above $118k; that unlocks the path toward $124k–$125k. Lose $114k convincingly and the risk shifts to a deeper pullback toward $106k–$105k. Let confirmation lead entries and size positions so one trade can’t harm your account.
Disclaimer: This is educational content, not financial advice.
Tags: #BTC #Bitcoin #PriceAction #EMA #Breakout #Support #RiskManagement #TradingEducation #TechnicalAnalysis

U.S. Fed Rate Decision — Main Possible ScenariosThis Wednesday, September 17, we’re getting the most important event of recent (and upcoming) months — the one that will decide the direction not only for crypto but for all markets.
Here’s how I see the possible outcomes:
💜 Pink scenario — the most likely
We approach the meeting with positive price action → the Federal Reserve cuts rates → market spikes 1–2 candles up → then crashes hard.
Bitcoin goes to retest the lows at $107,000.
Why?
Because this rate cut is already priced in — that’s exactly what fueled the entire rally of the past few months.
Just like with the iShares Bitcoin Trust and Grayscale Ethereum Trust approvals — it’s the classic sell the news: everyone who wanted to buy has already bought, the catalyst plays out, and there’s nothing left to push price up.
Also: historically, every bear market started right after the Fed cut rates.
And this bull cycle is already one of the longest — almost 2 years.
💚 Green scenario — least likely
We again approach with positive sentiment → the Fed cuts rates → market rallies → somehow new liquidity appears → and we go to retest the ATH.
Personally, this “pink ponies” scenario seems unlikely — the market is extremely overheated, there’s been no fresh liquidity for months,
and this entire rally has run on declining volume.
It’s not that everyone suddenly wants crypto — it’s just that no one wants to sell.
But at some point… they will.
💙 Blue scenario — plausible
We approach with neutral/negative price action because insiders already know the decision and are positioning.
The Fed keeps rates unchanged → the market nukes, because this was the main catalyst priced in for months.
First target: $107,000,
and if that breaks — $99,000 comes fast.
This would likely mark the start of a new bear market.
📌 Drop a comment — which scenario do you think is coming?

Bitcoin (BTC): Looking For Strong Breakout Near $117K | BullishLooking for that break near our buy entry, which would also mean a full fill of bullish CME (which can be seen on smaller timeframes). Once buyers secure the zone, we are going to look for further movement into $140-150K; until then, we are just waiting for that momentum to form.
Swallow Academy

Bitcoin (BTC): Almost Filled CME Gap | Very BullishCRYPTOCAP:BTC continues to show strength after breaking above the 200EMA, with buyers holding momentum firmly in their favor. We are now very close to fully filling the bullish CME gap around $116K — the first key target in this move.
As long as buyers keep control of this zone, the structure points toward continuation. The major target remains the $120K+ region, which would confirm a new ATH in this cycle.
Swallow Academy

Bitcoin is on a A B C correction on the 15 minBTC/USDT is in a corrective pattern. The ABC ends Sunday evening after the Weekly close.
There is hidden bearish divergence on the MAC-D and RSI, that will allow the C wave to complete.
