BITCOIN → The hunt for liquidity before the fallBINANCE:BTCUSDT.P continues to update lows within the global downtrend. The retest of 91K confirmed the dominance of bears...
The downtrend continues. The technical and fundamental situation for the crypto market is neutral to weak.
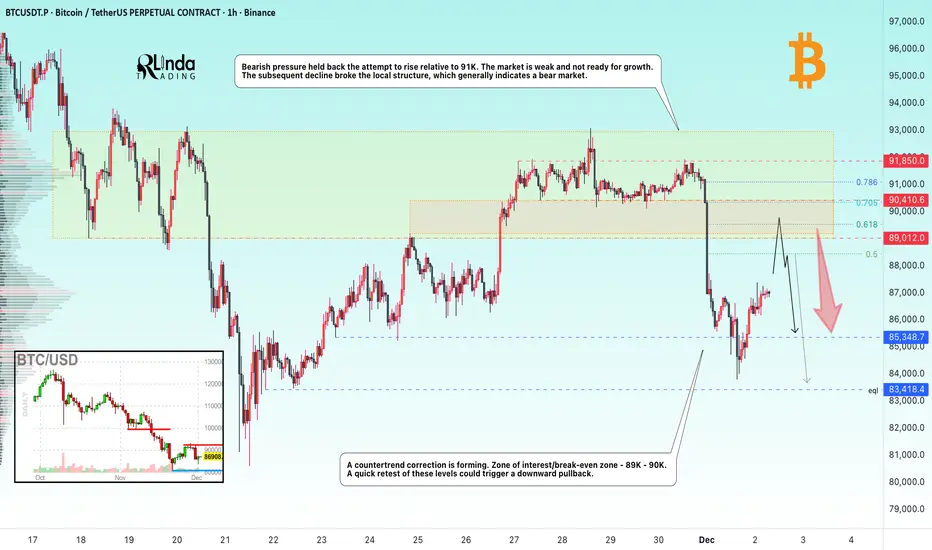
Bearish pressure held back the attempt to rise relative to 91K. The market is weak and not ready for growth. The subsequent decline broke the local structure, which generally indicates a bear market, but after updating the local minimum to 83700, a countertrend correction is forming. Zone of interest/break-even zone - 89K - 90K. A quick retest of these levels could trigger a downward pullback.
Resistance levels: 89K, 90K
Support levels: 85,400, 83,400
A retest of the range boundary and zone of interest could trigger a liquidity squeeze and a further decline if the bears keep the price below these boundaries.
Best regards, R. Linda!
Trade ideas
Bitcoin - 66k in 2026 (but first a pump - watch this!)Bitcoin has been going down drastically, as I expected many, many weeks in advance. But this is not the end of the crash! We will see lower prices in 2026, specifically 66k and possibly 50k later in Q3 2026. This is my long-term vision, but in the short term I think Bitcoin should go up to retest the previous long-term trendline and the previous falling wedge pattern at 97k! Usually after a breakout/breakdown, we want to see a retest. These retests are very important because they give us a chance to sell Bitcoin at a better price and also to short Bitcoin on the futures market.
Bitcoin did some pretty crazy movements in the past weeks, regardless of the seasonality patterns. Statistically Bitcoin is extremely strong in October and November—but this time it was the opposite. Even though seasonality patterns are helpful, you always need to look for more indicators and fundamentals. Moonboys that were screaming for 200k and 500k got liquidated, and soon they will disappear from the market for good. I have been trading for almost 10 years, and I have experienced many crypto crashes, and the moonboys are always here at the top. When I was bearish at 120k, everyone was screaming in the comment section and even spitting on my bearish predictions.
So my plan for the next Bitcoin movements is as follows: First, Bitcoin should retest the 97k level (this will take some time). After that we should see another big leg to the downside to 66k.
Write a comment with your altcoin + hit the like button, and I will make an analysis for you in response. Trading is not hard if you have a good coach! This is not a trade setup, as there is no stop-loss or profit target. I share my trades privately. Thank you, and I wish you successful trades!

Lingrid | BTCUSDT Major Resistance Rejection. Potential Sell BINANCE:BTCUSDT perfectly played out my previous trading idea. Price has broken sharply below the pullback channel after failing to sustain momentum into the 93,000 resistance zone — a heavy confluence of the mid-channel trendline and the broader descending structure. This rejection confirms another lower high, reinforcing the dominant bearish sequence visible since early November. The breakdown signals a shift back into trend continuation mode, with sellers retaking control after a corrective rally.
As long as CRYPTOCAP:BTC trades below 90,000–92,000, the downside path points toward the 81,000 support, where the previous bottom formed and where a potential double-bottom setup may emerge. Momentum remains pressured, and liquidity below the recent swing low increases the probability of a sweep toward 81,000, and possibly deeper into the buying zone.
➡️ Primary scenario: continuation lower → targets 81,100.
⚠️ Risk scenario: a breakout above 93,800 would neutralize the bearish outlook.
If this idea resonates with you or you have your own opinion, traders, hit the comments. I’m excited to read your thoughts!

Bitcoin: Final Pump Before the Fall?Over the past five to six days, Bitcoin ( BINANCE:BTCUSDT ) has been attempting to recover from previous weekly declines, and it still appears to be in a corrective phase. This analysis builds on my previous idea, and if you’d like a deeper look at Bitcoin’s mid-term chart, you can check out the 4-hour timeframe in that previous analysis .
Now, a key point for Bitcoin traders is that, despite the recent rally in the S&P 500 ( SP:SPX ) over the past few days, Bitcoin hasn’t been able to keep pace. While it had a good correlation with the S&P 500 in the past, it didn’t experience a similar upward movement this time. Therefore, once the S&P 500 corrects, we may also see Bitcoin resume its downward trend.
Currently, Bitcoin seems to be near a resistance zone($92,200-$88,400) and Cumulative Short Liquidation Leverage($91,570-$89,660). It also appears to be forming an ascending channel over the past few days, indicating a corrective structure.
From an Elliott Wave perspective, Bitcoin seems to be completing microwave C of the microwave Y of the main wave 4, and we can expect this corrective phase to end soon, leading to another downward move. A break of the lower line of the ascending channel would confirm the end of this Wave 4.
I expect that after the Cumulative Short Liquidation Leverage($91,570-$89,660), Bitcoin will resume its decline and move towards the Support zone($86,200-$85,130).
Cumulative Long Liquidation Leverage: $86,000-$85,000
Cumulative Long Liquidation Leverage: $83,249-$81,840
Cumulative Long Liquidation Leverage: $80,263-$78,131
First Target: $86,290
Second Target: $83,800
Stop Loss(SL): $92,229
Points may shift as the market evolves
Note: At lower price levels, Bitcoin’s price includes several Cumulative Short Liquidation Leverages, each potentially causing further price drops. However, if the S&P 500 starts another correction, these levels may break more easily.
Note: Overall, trading in crypto has become a bit challenging lately, with less volatility, so it’s wise to be cautious and manage your capital carefully.
Note: If Bitcoin breaks through the resistance zone($92,200-$88,400) around $92,229, we can expect a renewed upward trend and hope for a bullish movement.
💡 Please respect each other's opinions and express agreement or disagreement politely.
📌Bitcoin Analysis (BTCUSDT), 1-hour time frame.
🛑 Always set a Stop Loss(SL) for every position you open.
✅ This is just my idea; I’d love to see your thoughts too!
🔥 If you find it helpful, please BOOST this post and share it with your friends.

Quick Bitcoin Update (4H)The corrective phase of Bitcoin is an expanding triangle/diametric/symmetrical , with wave C completed and now we are inside wave D. This is a bullish D wave.
There is still time remaining for wave D to complete.
We have marked a green box below the price; if the price reaches this area, we can look for long/buy positions.
Look for long/buy positions in the red box, as there are many sell orders placed there.
For risk management, please don't forget stop loss and capital management
When we reach the first target, save some profit and then change the stop to entry
Comment if you have any questions
Thank You

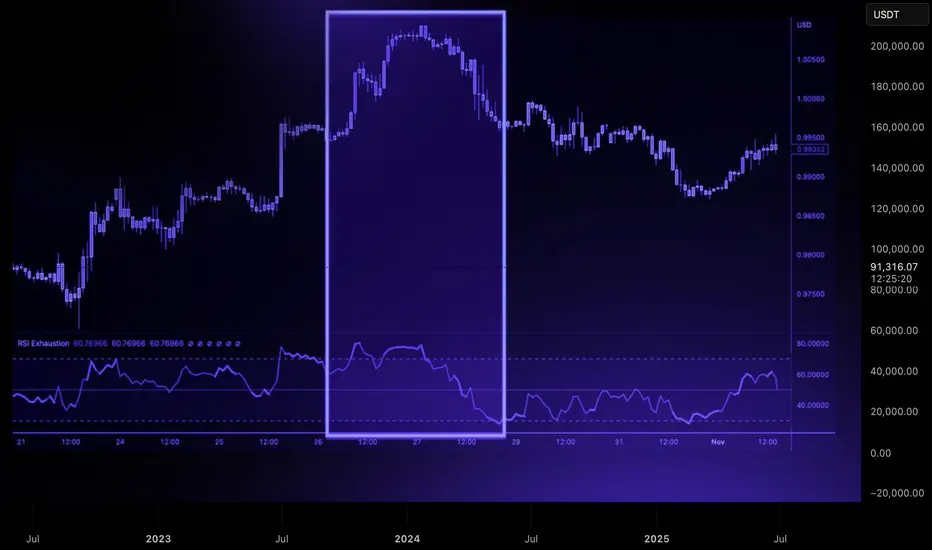
Trend Exhaustion: How to Spot a Reversal Before It HappensReversals rarely start with dramatic candles. They begin quietly, through subtle shifts in momentum and structure that most traders overlook.
A strong trend doesn’t collapse all at once. It loses strength in stages, and those stages are visible long before price turns in the opposite direction.
The first sign of exhaustion is weakening impulse strength. In a healthy trend, impulsive moves are clean and decisive, and retracements are controlled. When each new push produces smaller higher highs or lower lows, it signals reduced participation.
Buyers or sellers are still present, but the force driving the trend is fading.
The second clue lies in how price interacts with liquidity. Strong trends break key levels with conviction. Exhausted trends start reaching above highs or below lows only to reject immediately.
These sweeps show that the market is clearing liquidity without gaining follow-through, often trapping late entries and signaling that larger players are offloading positions.
A third indication appears when structure begins to fracture. An uptrend losing its higher-low sequence or a downtrend failing to maintain lower highs is a shift in narrative. A single break is not confirmation, but when it aligns with slowing impulses and liquidity failures, momentum is clearly changing.
Volatility then begins to compress. Candle ranges shrink, movement becomes less directional, and price enters a tightening pattern.
This compression often precedes expansion in the opposite direction. When a decisive candle breaks out of this cluster, the reversal typically accelerates.
Trend exhaustion is about recognizing when the conditions that supported continuation no longer exist.
By reading momentum, liquidity, and structure together, you can anticipate shifts earlier, manage risk more effectively, and position yourself on the right side of the next move.
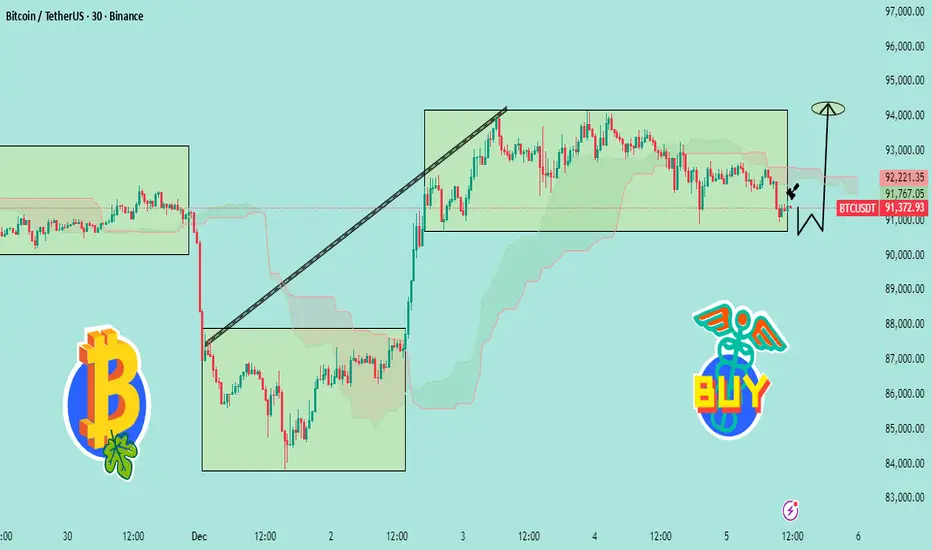
“BTC Bounce From Demand Zone – Targeting 94K Next📊 BTCUSDT Analysis (Based on Your Chart)
1️⃣ Price is Still Respecting the Range
Bitcoin is trading inside a wide consolidation box (around 91,000 – 93,000).
The recent drop tapped the bottom of the range, showing a clean liquidity sweep.
That wick below the box = fake breakdown → bullish signal.
---
2️⃣ Strong Reaction at Demand Zone
The chart shows BTC touching the demand/support zone, followed by a small bullish reaction (the black arrow).
This suggests:
Sellers failed to break lower
Buyers are stepping in exactly where expected
Market preparing for a reversal bounce
---
3️⃣ Expected Move (Your W Pattern Idea)
The drawn “W-shape” indicates a double bottom setup.
If the bottom holds around 91,000, BTC can push back toward:
🎯 Target: 93,500 – 94,000
This matches the upper boundary of the consolidation.
---
4️⃣ Bullish Scenario
If BTC holds above 91,000–91,300:
Reclaim mid-range
Break through resistance
Continue toward 94,000+
This aligns with the “BUY” tag you added.
---
5️⃣ Bearish Invalidations
Bullish idea is invalid if: ❌ Price closes below 90,800 on 30-minute
= fresh breakdown → deeper correction
---
🧠 Summary
BTC swept liquidity at the support → formed a bounce → still inside range → bullish reversal expected toward 94K
How to Build a Consistent Execution Checklist on TradingViewMost trading mistakes don’t come from bad strategy, they come from inconsistent execution.
An execution checklist removes guesswork and replaces it with structure.
When your actions follow a routine, your results stabilize.
TradingView gives you everything you need to build a checklist that stays visible, actionable, and tied directly to your chart.
1. Define Your Core Conditions
Before any trade, the bigger picture must be clear.
Start your checklist by answering three questions:
What is the higher-timeframe direction
Where is price relative to key levels
Is price approaching with strength or weakness
Use TradingView’s drawing tools to mark support, resistance, value zones, and session highs and lows.
Add a simple text note on the chart listing your core conditions so they are always visible.
If the market context fails this first screen, the trade is already invalid.
2. Build Confirmation Criteria
Once structure is confirmed, you move to evidence.
Mark confirmation areas directly on your chart:
Liquidity pools
Fair value zones or imbalances
Previous session highs and lows
Asian range or New York open
If your strategy uses indicators, document exact conditions:
Moving average position and slope
Volume behavior
VWAP location
Volatility expansion or contraction
Define rules that don’t change based on emotion.
Confirmation should prove your bias, not justify your urge to trade.
3. Validate Risk Before Execution
Every setup must survive a risk checkpoint before it’s allowed to go live.
Your checklist must answer:
Where is my invalidation level
How much capital am I risking
Does this violate any daily limits
Is the reward worth the risk
Use TradingView’s long or short position tool to visualize risk directly on the chart.
Save it as a template so your risk process stays uniform across all trades.
No trade is valid if risk isn’t clean.
4. Create a Pre-Execution Routine
A checklist only works if you actually follow it.
Add a short pre-trade process directly to your chart notes using checkboxes or bullet points:
Example execution checklist:
Market phase confirmed
Level identified
Confirmation present
Risk valid
Entry condition active
Walk through this list before clicking buy or sell.
If one item fails, the trade fails.
Over time, this routine removes emotional impulse completely.
5. Review and Refine Weekly
Your checklist isn’t static, it evolves.
Every week ask:
Where did I break my rules
What conditions led to losses
Which confirmations work best
What rules saved me from bad trades
Use TradingView’s trade replay and journaling features to review execution quality, not just profit.
Consistency improves when your system evolves with you.
Final Thought
A checklist doesn’t restrict your trading, it frees you from emotion.
When your process is clear, your confidence increases.
When your confidence increases, discipline follows.
Good traders make decisions.
Great traders execute procedures.
Stay Green!
Understanding Discipline in TradingWelcome back everyone to another post. In today’s article we will dive deeper into the 3 keys of Trading success! As attached below.
Today we will be reviewing the Key “DISCIPLINE”
Just like risk management and Psychology this is also a difficult skill to maintain.
In the modern world it’s considered a skill now, because most of society doesn’t have any discipline in any field.
Let’s get started.
Definition:
When it comes to Trading Discipline. Trading Discipline means one user has the mental ability ( strength ) to follow their system. Their Trading Plan, risk management and maintain their psychology regardless of what events happen.
Trading Discipline separates profitable traders from the gamblers.
(Below I have attached the article Trader or Gambler as it relates to this post, make sure to give it a read!)
Discipline ensures that the user makes the right decisions based on strategy and logic instead of FOMO, ego and greed.
It is not just about following rules though. Discipline relates to the outside world of cultivating habits, mindsets and self-control too.
1) Understanding Trading Discipline
Firstly, you must truly grasp what it actually means. Most individual traders confuse it with stubbornness. They think it’s about holding on to trades or forcing a system. In reality, it’s only about consistency and self-control! Simple right?
Example:
Imagine, you have a system. A trading plan. It has the 1% rule where you don’t risk more than 1% of your account per trade. Understanding discipline means you must know why that rule is in place. It’s too protected your capital! Not breaking it after a few losses just to catch up.
Real Life Analogy:
A professional runner trains every day. They do it even when they are sad, tired, unhappy and unmotivated. This is discipline. Discipline drives long term results. Discipline is continuing it no matter what the current situation is.
2) Implementing Trading Discipline
The process of implementation is nothing complicated. It’s only turning knowledge into action. Knowing about it won’t do anything, you must maintain the effort of consistently applying it to each step in your system.
How to implement it:
- Follow your plan: Before each trading day starts, read out your system and tell yourself you will follow it. Even if no set ups appear, you will still succeed because you followed your plan.
- Set risk rules: Apply proper risk management and lot management so you don’t cave into fear. Apply the 1:3 Rule or 1:4 Rule.
- JOURNAL your TRADES Damn it: Record every trade, your reasoning, and whether you actually followed your rules. Don’t just add a screen shot and nothing else. YOU won’t succeed if you don’t journal your trades properly.
Example:
A novice trader may plan to place an entry when price is at $50 and exit at $55 with a 2% risk per trade. Even if it dips to price $48, they hold to the stop loss accepting the loss instead of moving it and hoping it “recovers”
Real Life analogy:
Think of it as budgeting every day, or for a holiday, or your next maccas run. You set a weekly budget plan and stick to it. Even when tempted by special deals, sticking to your budget allows for long term financial health to take place. Just like risk management but with real life.
3) Maintaining Trading Discipline
Discipline can’t act overnight, it’s the process of small steps working your way up to solid consistency over time. Even when feelings run high – discipline isn’t one time. It’s daily practice.
Some strategies are:
- Reviewing your previous trades daily or at the end of each week during a market close. Assess your wins and losses.
- Build up emotional awareness, be aware of what fear, greed and overconfident emotions take place.
- Reward yourself to the rules of your system, not just profitable outcomes.
If you reward yourself for not trading in one day because not a single set up appeared, you were still successful because you didn’t “force” a set up and take a gamble.
Example:
A trader might experience 3 losses in the first hour of the day, even if they were all A++ set ups. Instead of revenge trading, he sticks to his plan, accepts the L and leaves the charts for the rest of the day to reset mentally and gain a win in another field, eg – Gym.
Real-life analogy:
By maintaining a healthy lifestyle, you must apply the same approach. You don’t stop exercising after a few days off. Discipline keeps you aligned even when your motivation and mental strength fades.
4) Adapting without breaking your Discipline
Long story short, Markets move, Markets change, Markets can and WILL evolve.
Traders must adapt. Not just allows their system to adapt, but their psychological mindset of discipline.
Adapting can be confusing but it can be done by:
- Don’t switch up new strategies, adjust your current system slightly then back test and forward test it on demo accounts. Eg Paper trading.
- Update your trading system based on data and monthly results, not emotions.
- Avoid making sudden changes right after losses.
Example:
Let’s say a forex strat no longer works due to low volume and volatility. A strict trader tests adjustments in their demo accounts, then incorporates them into the plan after they have received positive data from tests.
Real-life analogy:
A chef might change his recipe based on a specific ingredient availability but will not ignore the core cooking principles. It’s about adapting strategically, not impulsively.
5) Reinforcing Discipline Through mindset and daily life.
Discipline in the trading field is just amplified by the discipline process outside of trading. It follows the exact same process. Daily habits and mindset directly impact one’s trading performance.
To reinforce discipline, you can:
- Maintain routines: Wake up at consistent times. Don’t wake up at 3:00am to “grind” if you do that, you’re stupid – you’ll burn yourself out and make the process harder.
Plan your day and review goals. Eg do a brain dump every morning, write down or type out all ideas, thoughts and emotions and sort it out.
- Practice mental training: People suggest doing personal journaling or meditation. Just go for a walk in the morning for 5 minutes. First thing in the morning, feel the fresh breeze, air, sunlight and nature. You simulate the mind and body in a natural way allowing for you to think clearly and train your mind.
- Change your environment: surround yourself with work dogs, people who are strict on routines, self-improvement, self-development, individuals who don’t slack off.
Example:
Traders who can control their time well, exercise, eat healthy can maintain their stress in trading better than one who does not focus on outside habits.
Real-life analogy:
A school student who studies consistently every day and night rather than squishing it all in before exams perform better. Just like a trader who can maintain structured habits inside and outside of the market.
Conclusion:
Trading discipline is more than following rules, it’s a mindset and a lifestyle, it relates to the world outside of trading. Just like psychology, if you can’t master it outside, you won’t master it inside.
It's about understanding your own weaknesses and adjusting the system to hold structured rules that will allow it to be more easily achievable for yourself.
Remember, trading is not sunshine and rainbows.
It’s about building a system and following it. It is the hardest way to make “ easy ” money.
To find out what the other 2 keys are, review the 3 posts below where I explain the 3 keys to trading success, and go deeper into each of them!

Bitcoin Potentially break Shift to downside Bitcoin’s price a rising parallel channel. Price recently reached the upper boundary of the channel, entering a highlighted supply zone around 94,000. After touching this zone, the chart indicates a potential rejection.
A projected path is drawn suggesting small consolidation or minor pullback within the supply zone followed by a deeper downward move toward the mid-channel region and possibly extending toward the 88K support level a further extension toward 84K is marked as a deeper support target if the decline continues I expect Bitcoin price continue its downtrend if the price react we could see a more server sell off in the crypto market.
You may find more details in the chart,
trade wisely best of luck Buddies.
Ps; Support with like and comments for better analysis thanks for supporting.

TradeCityPro | Bitcoin Daily Analysis #240👋 Welcome to TradeCity Pro!
Let’s move on to today’s Bitcoin analysis. The market has started its correction phase today.
⏳ 1-Hour Timeframe
Yesterday, Bitcoin had a very strong bullish momentum and reached the 93,609 level.
✨ Breaking this level could have continued Bitcoin’s upward movement, but the price failed to break through and faked it, starting a correction instead.
💥 The RSI oscillator, as I mentioned before, was showing strong bullish momentum while above the 50 level. However, with the break of this level, the bullish momentum faded, and Bitcoin entered a deeper correction.
📊 During this correction, volume has decreased significantly, and the price has corrected down to 91,974.
The reaction of the price to this level is very important.
⚡️ If the price is supported at 91,974, the likelihood of breaking the resistance increases, and the price could break through this level in future attempts.
💫 However, if the price breaks 91,974 and volume increases, Bitcoin could see deeper corrections, potentially moving to 90,421 or even 88,082.
✔️ For now, I’m only looking for long positions and will open a long position if 93,609 is broken.
⭐ However, I won’t open a short position if 91,974 breaks; I’ll wait for more bearish momentum to enter the market before considering a short.
❌ Disclaimer ❌
Trading futures is highly risky and dangerous. If you're not an expert, these triggers may not be suitable for you. You should first learn risk and capital management. You can also use the educational content from this channel.
Finally, these triggers reflect my personal opinions on price action, and the market may move completely against this analysis. So, do your own research before opening any position.

TradeCityPro | Bitcoin Daily Analysis #239👋 Welcome to TradeCity Pro!
Let’s move on to today’s Bitcoin analysis. The market has started a new bullish move, which seems to be the beginning of a sharp upward move.
⏳ 1-Hour Timeframe
Yesterday, after the previous drop, Bitcoin created a range structure, and the bullish move began with the break of the 87,088 resistance.
🔔 This move was very sharp, and the price continued its way up to 93,609, a level that is very important for Bitcoin’s future trend.
⚡️ Currently, after reaching 93,609, the price has entered a range and correction phase, with a pullback to the 91,974 level, preparing for the next upward move.
📊 If volume starts to increase, we can open a long position after the 93,609 level is broken.
🧩 Breaking this level has been a long-awaited trigger for a long position.
💥 The RSI oscillator, after entering the overbought zone, has now reset. If the price starts moving upwards again, and RSI enters the overbought zone once more, we can get momentum confirmation for the next leg up.
❌ Disclaimer ❌
Trading futures is highly risky and dangerous. If you're not an expert, these triggers may not be suitable for you. You should first learn risk and capital management. You can also use the educational content from this channel.
Finally, these triggers reflect my personal opinions on price action, and the market may move completely against this analysis. So, do your own research before opening any position.

BTCUSDT Price Update – Clean & Clear Explanation✅Bitcoin is trading inside a broader downward structure, and the recent rally has reached a strong supply zone near 92,000–94,000, where sellers have stepped in again. The price reacted sharply from this resistance band, indicating that the market is still respecting the higher-timeframe bearish trend.
✅Currently, the market is showing signs of exhaustion after the latest push upward, and the price is starting to form a lower-high rejection pattern, suggesting that buyers are losing momentum. As long as Bitcoin stays below the 92,000–94,000 supply zone, the long-term outlook remains bearish.
✅If selling pressure continues, the chart supports a gradual decline toward the first target near 88,000, where a previous demand zone and trendline support meet. Breaking below that structure may trigger a deeper drop toward the second major demand zone around 83,000–84,000, which aligns with the lower boundary of the long-term descending channel.
✅Overall, unless Bitcoin breaks and holds above 94,000, the higher-timeframe structure favours a bearish continuation, with sellers aiming for lower levels over the coming sessions or weeks.
✅If If you find it helpful please like and comments for tis post and share thanks.

The Most Underrated Skill: Reading the Market Without Bias!Most traders focus on indicators, patterns, and strategies…
But very few focus on the skill that actually moves the needle:
Learning to read the market without forcing your bias onto the chart.
Here’s the truth 👇
When you zoom out and remove the noise, the market is always telling one of only three stories:
📘 1. Impulse → Market is moving with strength
An impulse leg is a clear, strong movement in one direction.
Candles are decisive. Pullbacks are shallow. Speed is visible.
When you identify an impulse, the message is simple:
“Don’t fight me, follow me.”
This is where continuation trades thrive.
📔 2. Correction → Market is taking a breath
A correction is messy, slow, overlapping price action.
The market is not reversing; it’s reloading.
Most beginners confuse corrections with trend reversals… Professionals don’t.
The key question becomes: “Where will this correction end?”
Because that’s where the next impulse usually begins.
📕 3. Reversal → Structure shifts, and momentum dies
A reversal is structural.
You see new lower lows in an uptrend, or new higher highs in a downtrend.
Momentum slows. Failed impulses appear. Trendlines break.
A true reversal is never a single candle; It’s a story told over multiple chapters.
🔑 The Skill: Listening Instead of Predicting
Most traders lose because they try to predict what comes next.
Professionals focus on reading what’s happening now.
Ask these questions every time you open a chart:
- Is momentum increasing or decreasing?
- Are corrections getting deeper or shallower?
- Is structure still intact?
- Which key level holds all the power?
Master these, and you’ll start seeing the market in HD.
💡 Why This Matters
Your entries, exits, and risk management improve automatically when you can answer one simple question:
“Is the market impulsive, corrective, or reversing?”
This removes emotional trading, kills hesitation, and builds confidence, because you’re no longer guessing... You're listening.
🤔 Final Thought
Strategies don’t fail because they’re bad.
Strategies fail because traders apply them at the wrong time.
Read the market first. Trade second.
⚠️ Disclaimer: This is not financial advice. Always do your own research and manage risk properly.
📚 Stick to your trading plan regarding entries, risk, and management.
Good luck! 🍀
All Strategies Are Good; If Managed Properly!
~Richard Nasr

BTC/USDT | The real test ahead! (READ THE CAPTION)Hello everyone, back with another analysis, this time on BTC.
By examining the daily chart of BTC, we can see that bitcoin has been boosted up after hitting the demand zone and is currently being traded in 93K zone. I expect a rise to 97k-98k FVG zone, if BTC manages to go past through this zone, a rise to 104K could be possible. Should it fail to go past 98K, another drop to 81K is likely to happen.

BITCOIN SIGNAL: SELL EVERYTHING NOW!!!!!!!? (big)Yello Paradisers! Enjoy the video!
And Paradisers! Keep in mind to trade only with a proper professional trading strategy. Wait for confirmations. Play with tactics. This is the only way you can be long-term profitable.
Remember, don’t trade without confirmations. Wait for them before creating a trade. Be disciplined, patient, and emotionally controlled. Only trade the highest probability setups with the greatest risk to reward ratio. This will ensure that you become a long-term profitable professional trader.
Don't be a gambler. Don't try to get rich quick. Make sure that your trading is professionally based on proper strategies and trade tactics.

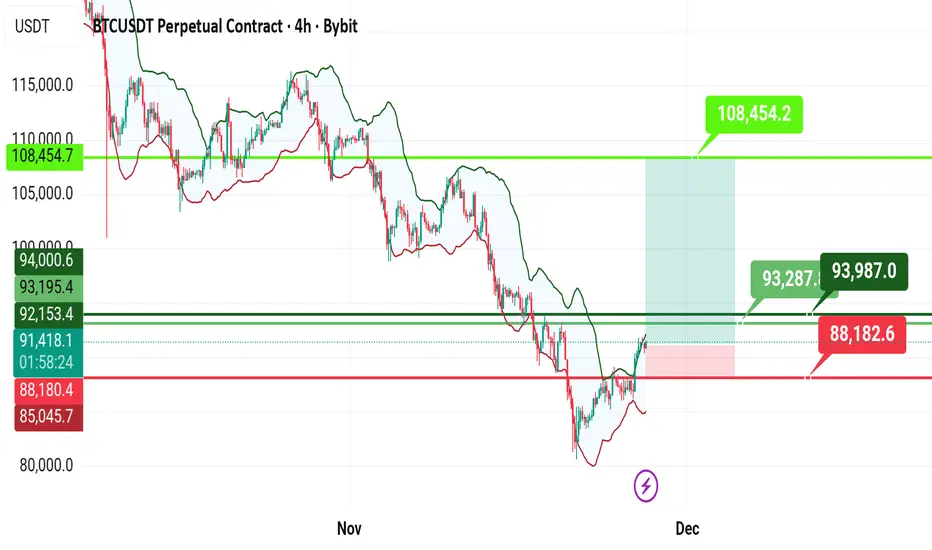
Alert for short positions, 108454 available without stopThere is currently no point of change in the trend in Bitcoin's upward path, and on the other hand, a break above 95,750 completely eliminates the downside trend in the short term, and if there is a reversal, the 94,000 range will provide support.
Bitcoin Bitcoin highlighting recent price movement, supply–demand zones, trend structure, and potential trade planning.
Recently, Bitcoin experienced a sharp drop from the upper zone near 90K, breaking below the rising trendline and entering a corrective phase. After this strong bearish candle, price fell into a lower demand zone, where buyers stepped in again. This created a temporary support area around 84K – 82K
Resistance Zone: Around 90K – 92K shown in the red area. This is the region where sellers previously dominated and pushed the price down Bitcoin is now trading around $87,300–$88,000, where price is retesting a previous breakdown area. This zone acts as both resistance and a decision point.
If You find it helpful please like and comments for this post and share thanks.

BTC Sell/Short Setup (4H)Based on the previous wave counts, it seems that wave D will complete in the red zone.
We have prepared a setup that you can use to enter a position with 10X to 14X leverage.
The targets, stop-loss levels, and entry point are marked on the chart.
For risk management, please don't forget stop loss and capital management
When we reach the first target, save some profit and then change the stop to entry
Comment if you have any questions
Thank You

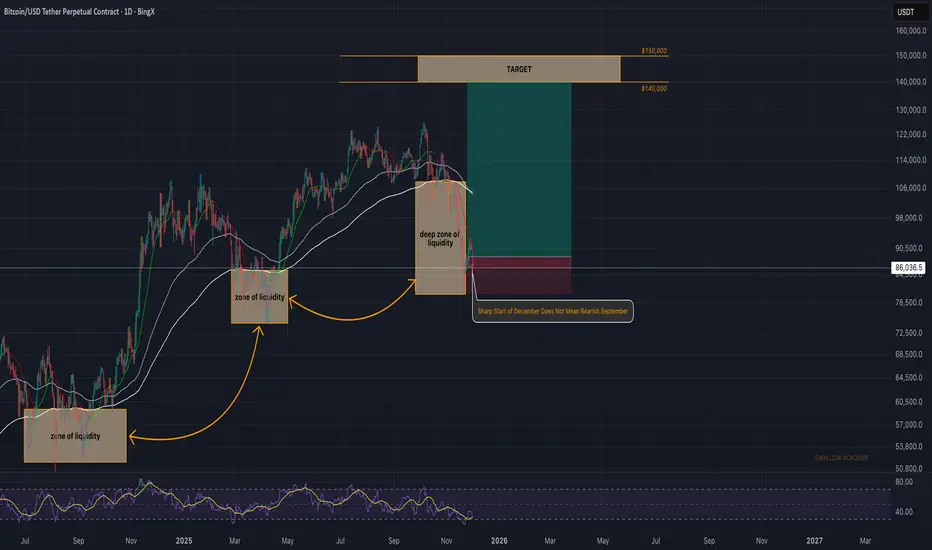
Bitcoin (BTC): Sharp Start of Dec Does Not Mean Bearish DecBitcoin had a rough start to the month but this does not change a thing for now. EMAs are still far away from the market price and we are looking for the price to recover in a matter of a week or two.
As long as buyers hold the ground around 80K, this is our game plan: long until EMAs ($105K) and then look for a breakout.
Swallow Academy
Bitcoin's daily chart on fire
Daily time frame with a medium-term view
1. Market trend:
Downward trend
2. Supports and resistances:
Support levels:
1- 84.646
2- 76.236
3- 67.672
Resistance levels:
1- 100.889
2- 110670
3- 123.410
3. Technical tools and indicators:
The RSI oscillator has reached near the oversold zone again after a short-term rest, and if it enters the oversold zone, it could signal further price declines.
4. Price patterns:
No specific pattern is observed.
5. Trade volume:
The trading volume is increasing in the downward trend.
Market scenarios ahead:
- Price increase scenario (bullish):
For the bullish scenario, we need the price to close above 100889; in that case, the targets of 110670 and 123410 are accessible.
- Price decrease scenario (bearish):
If the candle closes below the price of 84646, we enter the bearish scenario, in which case the targets of 76236 and 67672 are accessible.
Final note:
This view is merely a personal analysis, and the responsibility for trading transactions rests entirely with the trader. Always consider proper and safe risk management.
#Technical_Analysis #Financial_Markets #closetrader

EcoByG Bitcoin Daily Analysis #1 — Daily BTC Market UpdateWelcome to My Analysis.
Now, let’s break down today’s Bitcoin structure.
We can clearly see that Bitcoin has risen from the accumulation zone at 84K, moved up toward the 93K level, and is currently stuck there.
The 93K–96K area is the liquidity zone for sellers, which makes it a difficult region to break through.
To push past this level, Bitcoin either needs a whale-driven move, or we need to see stronger volume inflows.
From a broader perspective, the current range is between 84K and 94K. For a confirmed breakout and to say that the market structure has turned bullish.
we need Bitcoin to close several 4-hour candles above 96K.
On the other hand, if we want to consider a safe scenario for a move downward, then price must continue below 84K.
RSI shows us that when price reached 94K, momentum slowed down, indicating that BTC wants to take a breather. This is a reasonable area for consolidation before potentially continuing its movement in the upcoming sessions.
⚠️ Risk Alert ⚠️
Futures are not beginner-friendly. These triggers require solid experience.
Before using them, study risk management and practice with the learning content here.

Mastering Divergence in Technical AnalysisIn technical analysis, a divergence (also called a “momentum divergence” or “price/indicator disagreement”) is one of the most powerful early warning signals available to traders. In simple terms, divergence occurs when price and a momentum indicator (such as RSI, MACD, or Awesome Oscillator etc.) move in opposite directions.
This disagreement often signals that the current trend is losing strength and that a pause, pullback, or full reversal may be approaching.
1. What Is Divergence?
Normally, in a healthy trend:
In an uptrend, price makes higher highs and momentum indicators also make higher highs.
In a downtrend, price makes lower lows and momentum indicators also make lower lows.
A divergence appears when this alignment breaks.
Typical example with RSI or MACD:
Price makes a higher high,
But the indicator makes a lower high.
This tells us that, although price has pushed to a new extreme, the underlying momentum is weaker. Smart money may be taking profits, and the late participants are driving the final leg of the move.
2. Types of Divergence
There are two main families of divergence:
Regular (classic) divergence – often associated with potential trend reversals.
Hidden divergence – often associated with trend continuation after a correction.
Within each family, we have bullish and bearish versions.
2.1 Regular Bullish Divergence – Potential Trend Reversal Up
This suggests that sellers are still pushing price to new lows, but momentum is no longer confirming the strength of this selling pressure. The downtrend is weakening and a bullish reversal may develop.
Context where it’s most powerful:
After a prolonged downtrend.
At or near a higher-timeframe support level (daily/weekly support, major demand zone, trendline, or Fibonacci confluence).
2.2 Regular Bearish Divergence – Potential Trend Reversal Down
This signals that buyers are still able to push price higher, but each new high is supported by less momentum. The uptrend is aging, and a bearish reversal or deeper correction becomes more likely.
Context where it’s most powerful:
After a strong, extended uptrend.
Around major resistance levels, supply zones, or upper trendlines.
2.3 Hidden Bullish Divergence – Trend Continuation Up
Here, price structure still shows an uptrend (higher lows), but the indicator has overshot to the downside. This often appears during pullbacks within an uptrend, suggesting that the correction is driven more by short-term emotion than by real structural weakness.
Interpretation:
Hidden bullish divergence indicates trend continuation. Bulls remain in control, and the pullback may provide an opportunity to join the uptrend at a better price.
2.4 Hidden Bearish Divergence – Trend Continuation Down
Price structure still favors the bears (lower highs), but the indicator has spiked higher, often due to a sharp counter-trend rally. This suggests that the bounce is corrective rather than the start of a new uptrend.
Interpretation:
Hidden bearish divergence favors continuation of the downtrend and often appears before the next impulsive bearish leg.
3. Which Indicators to Use?
Divergence can be spotted on many oscillators, but the most commonly used are:
RSI (Relative Strength Index) – very popular for spotting overbought/oversold zones and divergences.
MACD (and its histogram) – useful for trend and momentum, especially on higher timeframes.
Stochastic Oscillator – often used in range-bound environments.
Awesome Oscillator, CCI, etc. – alternative momentum tools, depending on your preference.
The concept is the same: price and indicator should generally confirm each other. If not, you have a divergence.
4. Timeframes and Reliability
Divergences can be found on all timeframes, but their reliability increases with higher timeframes:
On M5–M15, divergences are frequent but often short-lived. Better for scalpers.
On H1–H4, signals have more weight and can lead to multi-session moves.
On Daily/Weekly, divergences can mark major tops and bottoms, but they may take longer to play out.
A good practice is to:
Identify major divergences on higher timeframes (H4, Daily).
Refine entries on lower timeframes (M15, M30, H1) using structure and price action.
5. How to Trade Divergences (Practical Framework)
Divergence by itself is not a complete trading system. It is a signal of potential imbalance, which should be combined with:
Key levels (support, resistance, supply/demand zones).
Trend structure (higher highs/lows or lower highs/lows).
Price action confirmations (reversal candles, break of structure, etc.).
Risk management (position sizing, stop loss, invalidation level).
6. Common Mistakes When Using Divergences
- Trading every divergence blindly.
Not every divergence leads to a big reversal. Many will result in only minor pullbacks.
- Ignoring the trend.
Regular divergences against a strong trend can fail multiple times before a real top or bottom forms. Hidden divergences are often more reliable in trending markets.
- Forcing divergences where they don’t exist.
Only connect clear, obvious swing highs and lows on both price and indicator. If you have to “stretch” the lines, the signal is probably weak.
- No risk management.
A divergence is just a probability edge, not a guarantee. Always define invalidation and manage position size accordingly.
7. Best Practices
Combine divergence with market structure (trendlines, channels, higher highs/lows).
Use higher-timeframe context and drop to lower timeframes for refined entries.
Pay attention to confluence:
Divergence + key level + candlestick signal is stronger than any single factor.
Keep a trading journal of divergence setups, including screenshots from your charts. Over time, you will see which conditions work best for your style.
Divergences are not magic, but they are one of the cleanest ways to see when price and momentum disagree. Used correctly, they can:
Help you avoid entering late in a trend,
Alert you to potential reversals before they are obvious to the crowd, and
Provide high-probability continuation entries via hidden divergences within strong trends.