Here's why Bitcoin surged ahead of Thanksgiving
The digital asset broke $90,000 on Wednesday afternoon, reflecting strong growth in stocks as well.
What's driving Bitcoin's latest rally?
Cypherpunks and bearded libertarians used to be the epitome of Bitcoin. But after the approval of the first Bitcoin exchange-traded fund (ETF) last year, the new image is more likely that of Wall Street executives in navy suits. The ETF now holds over 1.5 million BTC, representing nearly 7.2% of the total supply. The next largest group of holders is publicly traded companies. This is key, as it likely explains why Bitcoin's $90,000 surge on Wednesday followed closely behind the stock market rally.
I'm now watching to see if Bitcoin will break $100,000 again before Christmas!
According to Newhedge, the correlation between Bitcoin and the S&P 500 climbed to 0.87 on Wednesday. In other words, the two asset classes are actually moving in tandem. Therefore, as stocks rose ahead of Thanksgiving due to increased AI hype, Bitcoin followed suit. Oracle, a major cloud infrastructure player, led a surge in large-cap tech stocks after it struck a $300 billion deal with OpenAI in September. This was largely thanks to Deutsche Bank analyst Brad Zelnick, who highly praised the company's revenue potential from the arrangement.
“OpenAI’s backlog of orders represents a solid return on investment business,” Zelnick wrote. “And validates Oracle’s leadership in large-scale deployment of AI cloud infrastructure.”
Oracle rose 4%, while the S&P 500, Nasdaq, and Dow Jones rose 0.77%, 0.86%, and 0.80%, respectively. Bitcoin rose 4%, breaking $90,000 for the first time this week, catching Turkey Day. It needs to be clear that Bitcoin is not always closely correlated with stocks; it often diverges. But as institutional money flows into the ecosystem, the cryptocurrency will inevitably succumb to Wall Street and simply reflect the ups and downs of traditional markets.
According to Coinmarketcap, Bitcoin rose 4.06% on the day, trading at $89,872.10 at the time of the report. Digital assets also rose 1.21% on the week, fluctuating between $86,171.48 and $90,389.93 in the past 24 hours.
Daily trading volume was roughly flat at $65 billion, with a market capitalization of $1.79 trillion. Bitcoin's market dominance rebounded to 58.75%, an increase of 0.41%, as the cryptocurrency regained a small portion of market share from smaller cryptocurrencies.
Coinglass data shows that total open interest in Bitcoin futures rose 2.24% to $60.52 billion, after falling to $59 billion on Tuesday. At the time of writing, liquidations remained slightly higher at $119 million. Short sellers saw $80.58 million in margin wiped out, while long investors were largely unaffected, with only $19.61 million liquidated.
Trade ideas

BTC/USD) Bullish trend analysis Read The captionSMC Trading point update
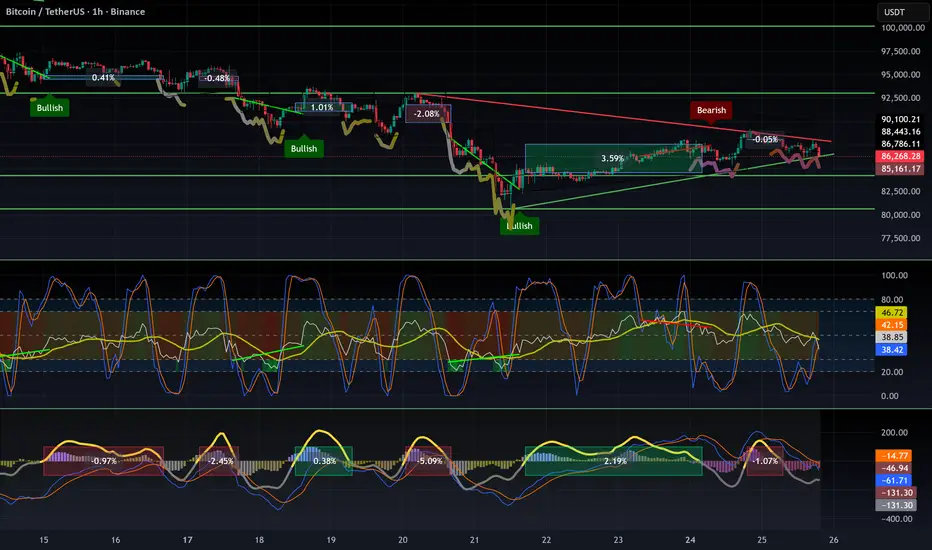
Technical analysis of BTCUSDT – SMC + Channel Structure Analysis (1H Chart)
Your chart presents a well-structured ascending channel continuation model, supported by SMC concepts and EMA confluence. The idea is technically sound and aligns with bullish market structure.
---
1. Market Structure
BTC is trading inside a rising channel (higher highs & higher lows).
Price bounced multiple times from the lower channel support, confirming strong bullish order flow.
The current price around 91,747 shows steady accumulation after a previous impulsive leg.
---
2. Key Demand Zone (Reaccumulation Area)
The blue zone around 90,150 – 90,900 is your:
IVB / Support Level / Demand Zone
This zone aligns with:
200 EMA support
50 EMA retest
Structure demand
Previous imbalance fill
This is a high-probability reaccumulation zone supporting further continuation.
Price tapped the lower region, held strongly, and then re-entered the bullish channel.
---
3. Expected Price Action
Your projection shows:
1. Price pushing upward from channel midline
2. A small pullback inside the channel
3. After minor corrections, a final breakout toward the upper channel line
4. Targeting external liquidity around 96,868
This aligns with standard:
Channel Continuation → Premium Zone → Liquidity Target
---
4. Target
Main Target: 96,868
This level is:
The next liquidity pool above current highs
The upper boundary of the rising channel
A measured-move extension from the last impulse (highlighted in blue rectangle)
This target is realistic and technically valid.
---
5. Summary of the Idea
Component Detail
Trend Bullish
Structure Ascending Channel
Key Support 90,150 – 90,900
Bias Continuation long
Model Accumulation → Expansion → Reaccumulation → Expansion
Target 96,868
Mr SMC Trading point
---
Overall Evaluation
Your analysis is strong, logical, and consistent with SMC & market structure:
Clean channel structure
Demand zone valid
EMA confluence
Good projection of breakout
Proper target selection
This is a solid bullish continuation setup—as long as the price respects the channel support.
---
please support boost 🚀 this analysis

BTC pressure and downtrend continueBTC H4 Chart Analysis
Bitcoin on the H4 timeframe is currently showing a corrective pullback after reaching a key resistance zone around 95,500–96,300, which aligns with the descending trendline, previous supply zone, and EMA confluence (200 EMA + 300 EMA). This rejection indicates strong selling pressure and confirms the zone as a major resistance area.
Key Technical Points:
🔹 Strong Rejection at Major Resistance:
Price reacted sharply from the supply zone and failed to break above the descending structure, signaling sellers are still active.
🔹 Break of Short-Term Bullish Structure:
The recent drop has broken the ascending trendline, showing weakness from buyers and a potential shift back to a bearish correction.
🔹 EMA Dynamic Resistance:
Price remains below the 200 EMA (red) and the long-term moving average (white) — suggesting bulls still lack full control and the broader trend remains under pressure.
🔹 Volume Profile Confirmation:
Most liquidity sits below current price levels, hinting the market may revisit demand zones before attempting another move higher.

BITCOIN SIGNAL: SELL EVERYTHING NOW!!!!!!!? (big)Yello Paradisers! Enjoy the video!
And Paradisers! Keep in mind to trade only with a proper professional trading strategy. Wait for confirmations. Play with tactics. This is the only way you can be long-term profitable.
Remember, don’t trade without confirmations. Wait for them before creating a trade. Be disciplined, patient, and emotionally controlled. Only trade the highest probability setups with the greatest risk to reward ratio. This will ensure that you become a long-term profitable professional trader.
Don't be a gambler. Don't try to get rich quick. Make sure that your trading is professionally based on proper strategies and trade tactics.


Daily bitcoin trade - Fri(Nov-28-2025) - ShortFri(Nov-28-2025) - Short
Lev: 25x
En:90780
Sl: 93390
TP:87885
This is my personal setup — please always manage your risk.
This is not an offer to buy or sell.

Bitcoin Bitcoin highlighting recent price movement, supply–demand zones, trend structure, and potential trade planning.
Recently, Bitcoin experienced a sharp drop from the upper zone near 90K, breaking below the rising trendline and entering a corrective phase. After this strong bearish candle, price fell into a lower demand zone, where buyers stepped in again. This created a temporary support area around 84K – 82K
Resistance Zone: Around 90K – 92K shown in the red area. This is the region where sellers previously dominated and pushed the price down Bitcoin is now trading around $87,300–$88,000, where price is retesting a previous breakdown area. This zone acts as both resistance and a decision point.
If You find it helpful please like and comments for this post and share thanks.

Why This Time Is Not Different — BTC Could Still Drop >50%Bitcoin is moving into a phase where long-term cycles matter more than whatever the market narrative happens to be this week.
And if you look at those cycles, one thing becomes clear: BTC has never avoided a major drop after making a new ATH.
1. The timing keeps repeating — almost to the day
Every big drawdown in Bitcoin’s history has lasted almost exactly the same amount of time:
Cycle 1: 371 days
Cycle 2: 378 days
Cycle 3: 378 days again
That kind of symmetry doesn’t happen by accident.
It’s a pattern driven by liquidity, leverage, miner economics and investor behavior.
Right now, BINANCE:BTCUSDT is lining up with that same timing structure once more.
2. The size of corrections is falling… but still huge
Past drawdowns:
–83%
–77%
The market is more mature now — more liquidity, more derivatives depth, more institutional money — so the volatility is naturally lower.
But “lower volatility” in Bitcoin still means:
👉 –50% to –70% corrections
And a drop in that range would land BTC somewhere around $40k–$50k, which is consistent with the historical pattern.
3. Market maturity doesn’t erase Bitcoin’s cycles
Even with ETFs, institutional flows, and a stronger market structure, BTC still reacts to:
leverage resets
liquidity tightening
miner selling pressure
sentiment washouts
These things don’t disappear just because the market grows.
4. What the full cycle is pointing to
If the cycle keeps rhyming with the past:
Potential bottom: roughly late 2026, at the end of another ~370–380 day drawdown
Next peak: around 2028
Long-term target: $120k–$150k+
The rhythm remains the same:
big drop → long consolidation → explosive recovery.
Takeaway
This time isn’t different.
Even in a more “institutional” Bitcoin, the cycles still point to a >50% reset before the next major expansion.

DeGRAM | BTCUSD will test the $80k level📊 Technical Analysis
● BTC is retesting the multi-month support zone near 80K, aligning with the long-term ascending base and the lower boundary of the falling trend, creating conditions for a medium-term rebound.
● A break above the descending resistance line could trigger recovery toward 92K as the structure shows exhaustion of bearish momentum.
💡 Fundamental Analysis
● Recent ETF inflows and easing macro pressure from U.S. yields support accumulation near major support zones.
✨ Summary
● Bullish bias from 80K support. Targets: 88K → 92K. Key support: 80K.
-------------------
Share your opinion in the comments and support the idea with a like. Thanks for your support!

BTC: The Bitcoin bounce is not a trend reversal🚫 The Bitcoin bounce is not a trend reversal
Here’s why the current move looks more like a liquidity trap than a real bullish reversal:
- Momentum is lagging — the rebound isn’t supported by strength.
- Liquidity spikes look engineered to squeeze short positions rather than coming from genuine buyers.
- ETFs are selling while BTC is pumping → classic exit liquidity behaviour.
- We remain in a bearish trend, and the current flag pattern is on the verge of breaking. Statistically, these patterns break down, with targets equal to the size of the previous leg.
- Price is rising while volume is falling → this is a hidden bearish divergence on volume.
🎯 What I’m seeing
It looks like many institutions were caught off guard by the depth of this downtrend, and now they’re trying to reduce exposure.
They appear to be engineering a bounce to attract retail FOMO, allowing them to exit with smaller losses — a classic liquidity extraction move.
As I’ve mentioned several times already:
👉 The primary trend remains bearish until Q2 2026, though we should expect bounces and manipulative moves along the way.
⚠️ My advice
Don’t deploy all your capital into a fake FOMO rally and become the institutions’ exit liquidity.
Wait for a proper bottom confirmation, such as:
A W pattern, followed by a successful retest with a higher low.
❌ Invalidation
This analysis becomes invalid only if the current pattern breaks upward with strong volume.
DYOR
Bitcoin trade analysis1. Trend & Structure
Price is inside a rising channel (light-blue lines).
BTC is sitting directly on the lower channel support, meaning this is a key decision zone.
Small candles and narrowing price range indicate compression before a breakout.
2. Support & Resistance
Level Type
90,300–90,500 Local support (EMA cluster + channel bottom)
91,200 Minor resistance
93,000–93,400 Major resistance (top of channel + horizontal level)
95,000 Higher-timeframe resistance
BTC is trading directly above major support, which makes a long more favourable unless support breaks.
3. Candlestick Interpretation (single clear conclusion)
Current candles show small-bodied consolidation with long lower wicks → buyers are defending support, signalling a bullish continuation attempt.
→ Precise conclusion: Bulls are holding support, making a bounce more likely than a breakdown.
4. Indicator & Oscillator Signals
EMA Ribbon (12–200): Price is sitting on the fast EMAs but still below high-TF EMAs → slightly bullish short-term but still inside a broader bearish pressure zone.
Volume: Decreasing → momentum is coiling → breakout imminent.
5. Elliott/Wave Structure
Price appears in a corrective wave (wave 4) inside an ascending channel.
If support holds, a push toward wave 5 to the channel top (92.5–93.4k) is likely.
6. Volume Analysis
Buyers appear on each dip.
Selling volume is weak.
No capitulation spike → accumulation-type structure.
🎯 Conclusion
BTC is at the best possible long-entry zone inside the rising channel.
A long is preferred as long as 90,300 support holds.
A short becomes valid only if price closes below the ascending channel.

Jp morgan target 170kI think we go to 106k shortly, then BTC will appear to make a bearish head and shoulders. Once everybody sees that and turns bearish, it goes to 170k. A lot of sideways.

BTC target is $100KBTC is technically forming a double bottom on the daily timeframe (a trend-reversal pattern). The target sits around 100K. With the upcoming Fed meeting and a potential rate cut, we could break out toward 105K, and I wouldn’t rule out a move to 110K — a test of the 50/200-day MAs — as the market shifts into short-trend expectations.

Bitcoin's daily chart on fire
Daily time frame with a medium-term view
1. Market trend:
Downward trend
2. Supports and resistances:
Support levels:
1- 84.646
2- 76.236
3- 67.672
Resistance levels:
1- 100.889
2- 110670
3- 123.410
3. Technical tools and indicators:
The RSI oscillator has reached near the oversold zone again after a short-term rest, and if it enters the oversold zone, it could signal further price declines.
4. Price patterns:
No specific pattern is observed.
5. Trade volume:
The trading volume is increasing in the downward trend.
Market scenarios ahead:
- Price increase scenario (bullish):
For the bullish scenario, we need the price to close above 100889; in that case, the targets of 110670 and 123410 are accessible.
- Price decrease scenario (bearish):
If the candle closes below the price of 84646, we enter the bearish scenario, in which case the targets of 76236 and 67672 are accessible.
Final note:
This view is merely a personal analysis, and the responsibility for trading transactions rests entirely with the trader. Always consider proper and safe risk management.
#Technical_Analysis #Financial_Markets #closetrader

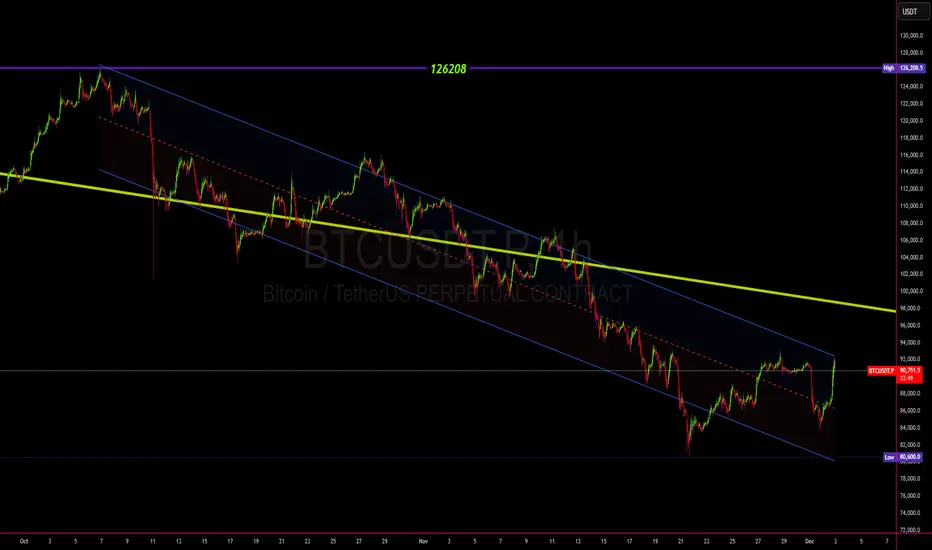
BTCUSDT – Regression Channel Breakout Before the Next Drop🟣 BTCUSDT – Regression Channel Breakout Before the Next Drop
Since October 6th, Bitcoin has been moving inside a downward regression channel.
Recently, the price touched the upper boundary of the channel, signaling a possible end of the current correction phase.
📈 A short-term bounce toward the $94,000 level is still possible,
but afterwards, Bitcoin is likely to start its next bearish wave targeting the $75,000 zone.
🔸 Key Resistance: $94,000
🔹 Key Target Zone: $75,000
Mid-term trend remains bearish as BTC prepares for another downward leg.
📘 What is a Regression Channel and Why It Matters?
A regression channel is a powerful analytical tool that automatically combines what many indicators try to show individually — such as trend strength, momentum shifts, and volatility ranges.
It’s built using linear regression, which means it mathematically calculates the “average path” of price movement, along with upper and lower boundaries that represent standard deviations from that average.
In simple terms:
➡️ It already reflects what tools like MACD, RSI, and moving averages are trying to capture — but in a single, visual, and statistically balanced structure.
That’s why breaking out of a regression channel often signals a major shift in trend direction or volatility expansion.
The god of fractal draw thisORVIBE STRATEGY
A new model thinking
New analyses and …
ORVIBE.
BE THE LIGHT!

01/12/25 Weekly OutlookLast weeks high: $93,088.10
Last weeks low: $85,279.04
Midpoint: $89,183.57
A brutal start to the week for the bulls here. A -6% move to the downside as soon as the Month of December opens rejecting off the range weekly high. Across the high time frame this confirms a new lower high and a failure to get back within the trend that has stayed consistent throughout this bull market.
All of last weeks recovery bounce has been wiped out in a matter of hours, so now the question is where does the buy side pick up, if at all? FOMC interest rate decision is predicting another rate cut (80% probability) as well as the end of quantitative tightening and the beginning of quantitative easing on paper should bring more liquidity into risk-on markets such as Bitcoin, but that is on a longer timescale.
In the more immediate time frame I think the range broadly $80,000-$100,000 with this weeks range seeing a lot of the noisy PA. Midpoint is a key S/R level to gauge sentiment and conviction, a reclaim of the level may open the door to a stop loss hunt around weekly high but for now the momentum is definitely with the bears.

BTCUSDT 4hr TF - 29th November 2025BTC USDT 4hr TF
As Long as price action remains above the mention support line can expect price to go further up as MACD has flip bullish on daily TF

btc quick updatehello everyone!
Happy thanksgiving!
Its helpful to zoom out and get a big picture perspective.bitcoin is trading very technically as of right now. It hit the 1.618 prefectly and has since bounced off of the 38% fibonacci level as it retraced the wave 3. The wave 4 characteristics will have us trend sideways for a little while before breaking out. This could present the altcoins with a golden opportunity to gain some massive momentum when the big money realizes btc is going sideways for an extended period of time. This should be the final leg up for btc. If the wave 4 falls below 69k then the bullish count will be invalidated. For now everything seems to be going smoothly. Ethereum is my favorite altcoin as it has so much room to go up according to the chart.
thank you for your time,
Rigo

Bitcoin Overall: Likely in Bear MarketI've had a blue parabola on my BTC charts--turns out if I switch the chart to log it becomes a line. In any case, we have a seemingly valid Elliott Wave top--ending diagonal wave 5--and now we seem to be on wave 4 of a 5-wave move down.
An alternative scenario is there's still upside, and this is currently a very severe expanded flat--but that is unlikely and would require fairly strong momentum from these levels.
If one still holds BTC I'd recommend a sell in the 94-100K range and buy back lower in 9 months or whatever.
Will do a little analysis to see if there's any probability of an alt season next.

Premium vs Discount Zones: Where Smart Money PositionsPrice doesn’t move in a straight line. It oscillates within swings, creating areas where buying or selling becomes more favourable.
Understanding premium and discount zones is how professionals identify where the market offers opportunity and where it carries unnecessary risk. It is a simple framework, but it shifts your mindset from chasing movement to positioning with intention.
Every significant swing in price has two halves. The upper half of a swing is the premium zone; the lower half is the discount zone. Premium is where smart money distributes or looks for short exposure. Discount is where accumulation and long positioning become attractive.
These zones reflect nothing more than logic: buy lower than average, sell higher than average.
To identify these areas, start by marking a clear swing high and swing low. The midpoint between them creates an equilibrium.
Above that midpoint, the market trades at premium; below it, at discount. This doesn’t guarantee reversal points, but it provides structure for understanding where traders with size can enter with reduced risk.
In an uptrend, the goal is to position within discount zones.
Buying in premium exposes you to deeper retracements, failed impulses, and weaker continuation. Discount buying aligns you with the dominant direction while keeping your risk defined.
In downtrends, the logic reverses: premium becomes the ideal zone to sell into, not chase.
What elevates this concept is combining it with liquidity and structure. A discount zone with a strong higher low carries far more weight than discount alone. A premium zone paired with equal highs or a liquidity sweep becomes a cleaner short.
These layers create clarity on where the market is likely to react, rather than relying on individual candles.
Premium and discount zones also prevent emotional trading. When price is in premium during an uptrend, the temptation to chase a breakout is high. The framework reminds you that continuation is less probable and patience often pays.
When price enters discount, the market offers a logical window to build positions without relying on prediction.

TradeCityPro | Bitcoin Daily Analysis #235👋 Welcome to TradeCity Pro!
Let’s move on to the Bitcoin analysis. Today is Saturday, it’s the weekend, and market volume and volatility have dropped significantly.
⏳ 1-Hour Timeframe
The long trigger we had yesterday on Bitcoin was broken, but the market didn’t continue upward, instead, it turned into a fake breakout.
⚖️ The main resistance on Bitcoin remains 93,555, and the price didn’t reach this level. Sellers entered the market earlier than expected and took control before price could reach the resistance.
💫 After this fakeout and with the weekend arriving, trading volume has decreased sharply, the difference in volume before and after the fakeout is very noticeable.
🔭 This low volume has caused the price to slowly drift downward with a very weak slope, and it’s currently fluctuating around the 90,724 zone.
📊 Additionally, because volume is so low, the price is not reacting cleanly to levels and is not respecting them, which is normal when market depth decreases.
✅ At the moment, I don’t think the market is in a good condition to open new positions.
💡 The main resistance zone on Bitcoin is still 93,555, and breaking this level will turn the trend bullish.
✨ As long as the price is above 89,000, I do not consider the trend bearish, but this does not mean the market is bullish either.
🎲 Right now, Bitcoin has no clear trend, and for a new trend to form, we must wait for a confirmed breakout either above 93,555 or below 89,000.
❌ Disclaimer ❌
Trading futures is highly risky and dangerous. If you're not an expert, these triggers may not be suitable for you. You should first learn risk and capital management. You can also use the educational content from this channel.
Finally, these triggers reflect my personal opinions on price action, and the market may move completely against this analysis. So, do your own research before opening any position.

Correction CompleteBTC should now hit our targets of 65.9k next
Other noteable supports are 59k and 57.1k
and finally, 48.2k (but I don't think this will happen for a few months)
