Deep Learning Model for 24-Hour BTC Price PredictionHi everyone,
I’ve developed a deep learning AI model designed to predict BTC's price movement over the next 24 hours on the 15-minute timeframe.
It’s important to note that this model does not directly provide exact entry points for trades. Instead, it indicates the likely direction of the market, meaning you’ll still need basic trading knowledge to apply it effectively.
After testing it over the course of one month, I achieved a success rate of around 90% in my trades when using the model as part of my strategy.
The model was trained using the following features:
Time-related: Hour, DayOfWeek
Price & volume lags: Close_lag_1, Close_lag_2, Close_lag_4, Close_lag_8, Close_lag_12, Volume_lag_1, Volume_lag_2, Volume_lag_4, Volume_lag_8, Volume_lag_12
Moving averages & statistics: MA_4, Std_4, Dist_MA_4, MA_16, Std_16, Dist_MA_16, MA_48, Std_48, Dist_MA_48, MA_96, Std_96, Dist_MA_96
Technical indicators: Return_log, MACD, RSI
Hourly Forecast for the Next 24 Hours
BTCUSDT.P trade ideas

TradeCityPro | Bitcoin Daily Analysis #183👋 Welcome to TradeCity Pro!
Let's dive into today's Bitcoin analysis. The market has had an upward movement. Let's see what's ahead in the market.
⏳ 1-Hour Timeframe
Yesterday, I mentioned that there was a high probability of movement and that it would be a good idea to keep an eye on the chart during the New York session as the market could move.
📊 With the start of the New York session, good buying volume entered the market, and after breaking 109890, Bitcoin started an upward wave.
🔑 The first area where the price could have faced resistance was 111605, which was broken on the first attempt. After a pullback, the next leg started.
🚀 The break of 109890, along with RSI entering Overbuy and the entry of buying volume, was a good trigger for a long position, and we could have opened a position with it.
⭐ Now, the price has reached a very important resistance zone, and the probability of a correction starting is high. For taking profit, I suggest you lock in profits whenever RSI exits the Overbuy zone, as this will reduce the upward momentum and increase the chances of a correction.
📈 For new positions, no triggers are available yet, and it's better to wait until the market gives us a clearer structure. However, if the price reacts several times to the level, we can open a long position in subsequent attempts if it breaks.
❌ Disclaimer ❌
Trading futures is highly risky and dangerous. If you're not an expert, these triggers may not be suitable for you. You should first learn risk and capital management. You can also use the educational content from this channel.
Finally, these triggers reflect my personal opinions on price action, and the market may move completely against this analysis. So, do your own research before opening any position.

BITCOIN SIGNAL: PROBABILITIES SHOWING THIS NOW!! (careful) Yello Paradisers! Enjoy the video!
And Paradisers! Keep in mind to trade only with a proper professional trading strategy. Wait for confirmations. Play with tactics. This is the only way you can be long-term profitable.
Remember, don’t trade without confirmations. Wait for them before creating a trade. Be disciplined, patient, and emotionally controlled. Only trade the highest probability setups with the greatest risk to reward ratio. This will ensure that you become a long-term profitable professional trader.
Don't be a gambler. Don't try to get rich quick. Make sure that your trading is professionally based on proper strategies and trade tactics.

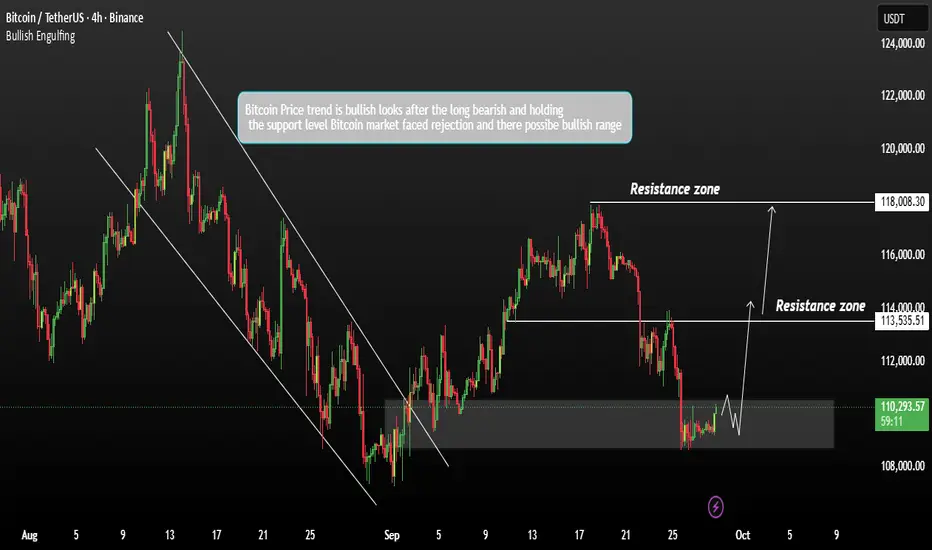
Bitcoin False breakout a bullish longer-term correction phaseBitcoin’s price has recently broken below a key trendline support despite a generally positive fundamental backdrop and an ongoing bullish longer-term trend. This suggests that the market may currently be undergoing a counter-trend correction phase.
One contributing factor to this short-term weakness appears to be the decline in U.S. interest rates, which has unexpectedly had a negative impact on the cryptocurrency market as a whole.
From a technical perspective, I have identified several important levels:
A breakout and confirmed close above this level could signal renewed bullish momentum and potentially trigger a positive market reaction. and there target will be 113K to 118K
You may find more details in the chart.
Trade wisely best of Luck.
Ps; Support with like and comments for better analysis Thanks for Supporting.
Bitcoin Defends $111,816 Fibonacci Support as Bulls Target PoinBitcoin is holding above $111,816, a high-confluence support region that includes Fibonacci retracements and the value area low. Bulls must defend this level to maintain momentum toward higher resistance levels.
Bitcoin’s price action remains stable above a critical support at $111,816, reinforced by the 0.618 Fibonacci retracement, the value area low, and a recent swing low. This confluence makes the level a key battleground for bulls. Holding above it keeps the door open for a bullish rotation back into the point of control, which remains the ultimate resistance on the intraday timeframe.
Key Technical Points:
- $111,816 Support Zone: Anchored by Fibonacci, value area low, and swing low.
- Bullish Requirement: Price must remain above 0.618 Fibonacci for upside continuation.
- Resistance Target: Point of control serves as the immediate upside objective.
The $111,816 region has emerged as a critical inflection point for Bitcoin. With multiple technical layers converging here, buyers have a clear line in the sand to defend. Past reactions from similar confluences have led to sharp upside rotations, adding conviction to this setup.
Remaining above this level keeps the bullish trend intact on the intraday timeframe. The path toward the point of control becomes increasingly likely if volume inflows support the defense. However, slipping below $111,816 would expose Bitcoin to deeper corrective structures, weakening the bullish case in the short term.
The point of control remains the next major objective, representing the area of highest traded volume and strong resistance. Successfully reclaiming it would mark a significant bullish milestone in BTC’s market structure.
What to Expect in the Coming Price Action
As long as Bitcoin holds $111,816 support, the probability of a bullish rotation toward the point of control remains high. A breakdown below this zone would shift momentum back to sellers and signal caution.

Bitcoin Weekly Opens Bearish, Buy The Dip?Bitcoin’s weekly candle has set a bearish tone after breaking through last Monday’s swing low. This shift signals that short-term market structure has changed from higher-lows to a more bearish pattern, suggesting corrective pressure may dominate in the coming sessions.
Key Technical Points:
- Bearish Weekly Candle: Engulfing structure broke last week’s swing low.
- VWAP Support Critical: Losing VWAP opens risk of $112,500 correction.
- ABC Structure: Current move resembles an Elliott Wave ABC correction.
Bitcoin’s short-term structure has shifted, with higher-low projections now invalidated. The bearish engulfing weekly candle points to weakness, though lower time-frame bounces remain possible. VWAP currently serves as the line in the sand; a reclaim could stabilize price, while a breakdown would likely extend correction to $112,500.
The pattern resembles an ABC corrective structure following a prior Elliott Wave impulse. If confirmed, further retracements could occur before Bitcoin resumes broader bullish trends.
What to Expect
Expect near-term bounces, but risks lean bearish unless VWAP is reclaimed. Loss of support would accelerate correction toward $112,500.

#BTCUSDT 4H ChartPrice is still consolidating with no major changes. MACD is slightly bullish, RSI is sold and EMAs are turning bearish. Price still needs to break and close above 114.5k to expect further bullish movements.

BTCUSDT - end of the partyA parachute is a device designed to slow an object's descent through an atmosphere by creating drag or aerodynamic lift. It is primarily used to safely support people exiting aircraft at height, but also serves various purposes like slowing cargo, aiding in space capsule recovery on Earth, landing spacecraft on other planets, and stabilizing vehicles or objects. Modern parachutes are typically made from durable fabrics like nylon and come in various shapes, such as dome-shaped, rectangular, and inverted domes, depending on their specific function.

Deep Learning Model for 24-Hour BTC Price PredictionHi everyone,
I’ve developed a deep learning AI model designed to predict BTC's price movement over the next 24 hours on the 15-minute timeframe.
It’s important to note that this model does not directly provide exact entry points for trades. Instead, it indicates the likely direction of the market, meaning you’ll still need basic trading knowledge to apply it effectively.
After testing it over the course of one month, I achieved a success rate of around 90% in my trades when using the model as part of my strategy.
The model was trained using the following features:
Time-related: Hour, DayOfWeek
Price & volume lags: Close_lag_1, Close_lag_2, Close_lag_4, Close_lag_8, Close_lag_12, Volume_lag_1, Volume_lag_2, Volume_lag_4, Volume_lag_8, Volume_lag_12
Moving averages & statistics: MA_4, Std_4, Dist_MA_4, MA_16, Std_16, Dist_MA_16, MA_48, Std_48, Dist_MA_48, MA_96, Std_96, Dist_MA_96
Technical indicators: Return_log, MACD, RSI
Hourly Forecast for the Next 24 Hours
2025-09-24 13:00:00+00:00 113187.886528
2025-09-24 14:00:00+00:00 113166.087645
2025-09-24 15:00:00+00:00 113073.892346
2025-09-24 16:00:00+00:00 112978.206348
2025-09-24 17:00:00+00:00 112883.998556
2025-09-24 18:00:00+00:00 112796.765538
2025-09-24 19:00:00+00:00 112723.646122
2025-09-24 20:00:00+00:00 112663.771152
2025-09-24 21:00:00+00:00 112613.883389
2025-09-24 22:00:00+00:00 112571.205400
2025-09-24 23:00:00+00:00 112533.084434
2025-09-25 00:00:00+00:00 112497.620988
2025-09-25 01:00:00+00:00 112464.608684
2025-09-25 02:00:00+00:00 112438.388997
2025-09-25 03:00:00+00:00 112409.348295
2025-09-25 04:00:00+00:00 112374.666791
2025-09-25 05:00:00+00:00 112334.960094
2025-09-25 06:00:00+00:00 112292.571287
2025-09-25 07:00:00+00:00 112248.481242
2025-09-25 08:00:00+00:00 112202.961260
2025-09-25 09:00:00+00:00 112156.047936
2025-09-25 10:00:00+00:00 112107.635662
2025-09-25 11:00:00+00:00 112057.822715
2025-09-25 12:00:00+00:00 112006.340060
2025-09-25 13:00:00+00:00 111953.576911

BTC back to trend ???BTC Bitcoin is currently moving through a channel that marks its upward trend. Yesterday's sell-off on Monday tested this channel. If the attempt to recover it consolidates, it will be a buy signal. Stay tuned.

BTC Correction targeting 100k?> Bitcoin is showing bearish RSI divergence on the August high, while the recent low shows no divergence, signaling potential weakness in momentum.
> I´m interpreting the current structure as an ABC correction, which may still be unfolding.
> The 100% Fibonacci extension aligns with the key psychological support at $100k, making it a high-probability target if the correction continues.
> The $115k level could act as resistance, setting the stage for further downward legs.

BTC/USDT Analysis – Rotation Continues
Hello everyone! This is the CryptoRobotics trader-analyst with your daily market review.
Yesterday we expected rotation within two key zones with a priority on grabbing upper liquidity, but instead, price moved for lower liquidity and tested the $111,600–$110,500 buy zone (accumulated volumes), from which we again saw a strong reaction.
Our current focus remains on capturing the upper liquidity and testing the market imbalance near ~$113,800. After that, we expect another selling wave into the $113,000–$112,000 zone. If we see a strong reaction there, we will consider long setups targeting the higher sell zone at $115,000–$116,000.
Buy Zones:
• $111,600–$110,500 (accumulated volumes)
• ~$108,400 (cluster anomalies)
• $108,000–$102,500 (accumulated volumes)
Sell Zones:
• ~$113,800 (market imbalance, mirror zone)
• $115,000–$116,000 (accumulated volumes)
• $118,000–$119,000 (accumulated volumes)
• $121,200–$122,200 (buy absorption)
⚠️ This publication is not financial advice.

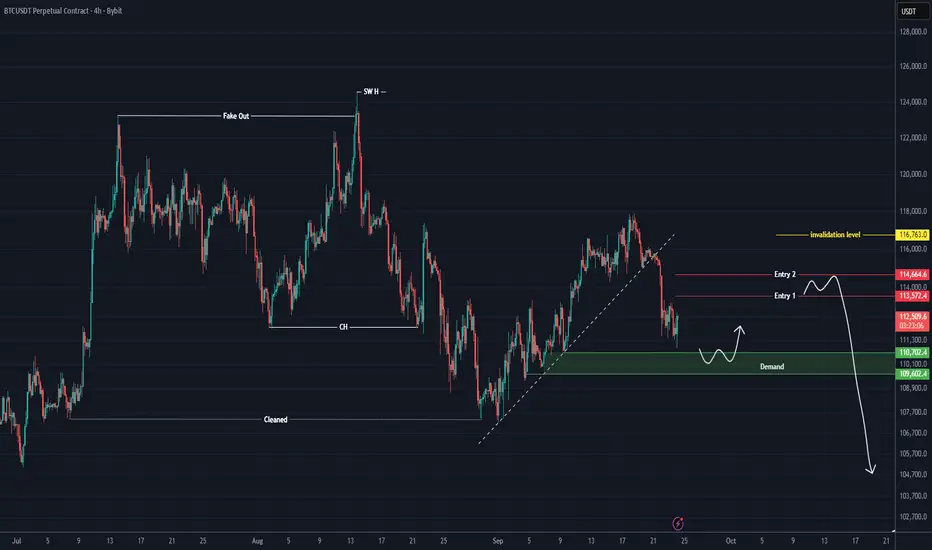
Bitcoin Analysis On Lower TimFrameBitcoin’s movement has truly become complex and trendless, and the drops are not happening with momentum. It’s worth taking a look at Bitcoin’s moves on the lower timeframes.
For opening a short position, we need to wait for the red-marked zone.
If the price reaches the red zone and we enter a position, we will not exit our short position in the green-marked zone, and in this analysis, we are not looking for long trades.
For risk management, please don't forget stop loss and capital management
Comment if you have any questions
Thank You
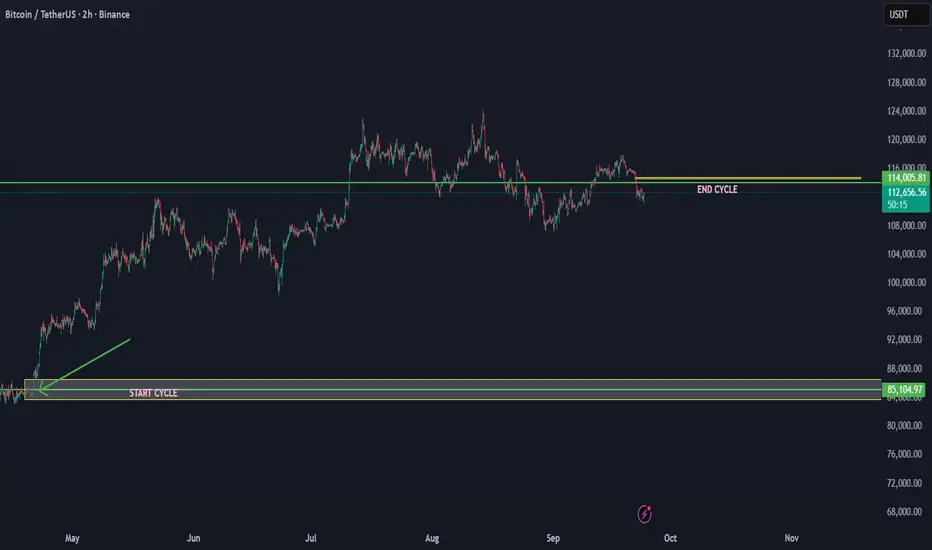
The BTC cycle that started at 84K is projected end at 114K This is a cycle update for BTC/USDT. Based on the cycle data, the cycle that started at 84K has ended at 114K. This indicates that we are now entering a new major trend breakdown in the cycle. It can take time, but when there is a new uptrend cycle, we will add.
This time frame and action made the end of the cycle that started from 84K
This could mean that btc can enter below 110K in the coming time. We have seen more times in the history of BTC that by the cycle end, the trend breaks down in steps.
BTC OutlookI strongly believe BTC reached the ultimate top. Sell the Top!
I predicted the 2022 BTC bottom, now I predict the 2025 top.

$BTC fake pump, you won't be savedSo there's some consolidation taking place, and that's normal at these levels. But let's zoom out for a bit and see the forest vs. the trees. What do we see? Downward channel SMAs / support resistance levels. What does that mean? it will bounce within the downward channel. The direction is way too strong moving it down to it's true support levels. Liquidity is down for retailers and institutions don't have the appetite to experiment with ultra high volatility esp. with YoY diminishing returns. Blackrock is dumping, and some are looking to get luck and hope for an upside. Hope is not a strategy! Maybe one day it will go up higher, but first it will cross 75k and many will get completely wiped out. I've see this many times before. Best of luck and always do your own dd!

$BTC 24/09: PERFECT ENTRY?Sideway -> Liquidity Sweep -> Breadkout + FVG
This is must be a good entry.
If the price drop down the FVG, It will be change into a resistance zone.

BTC - Current Levels Post Rate CutIt has been a week since we saw the fed cut rates. Now it is time to reexamine price action compared to our pre-rate cut chart. That post can be found here:
After the rate cut (Vertical Purple Line), we saw price dump sharply while Powell was speaking. Once he stopped, BTC rallied all the way to our red box (mid term resistance). As expected, price then started to sell off from that level of resistance.
The buyers started to regain control of price action in our green box (current main support). As expected we saw many wicks into this box that were quickly eaten up by buyers. Currently, we are trying to see a break above our micro resistance level of $113.5k. If this level can be broken, the upwards momentum should continue.
However, We do not want to see BTC start closing 4H candles below our green trendline (Support Trendline). That would indicate this support we are building will be negated and further downside price action will ensure.
But based on the current technicals, BTC looks primed for a move back to the upside.

The ABCD Pattern: The Market’s Favorite Alphabet TrickIf the markets had a secret language, the ABCD pattern would probably be one of the first letters you’d learn. Clean, geometric, and surprisingly common, this formation has been studied for decades. In abcd pattern trading, it’s not about spelling words. It’s about spotting balance, symmetry, and rhythm in price movements.
📐 What Is the ABCD Pattern?
Think of the ABCD pattern like a zigzag that markets often draw. It’s one of the simplest chart patterns in technical analysis because it shows how price usually moves in waves, not straight lines. Here’s how it works:
A → B (Impulse Move):
This is the first strong move, either up or down. In trading terms, it’s called an impulse leg — the market pushes in one direction with momentum.
B → C (Correction):
After a big push, the price takes a breather. This is the corrective leg. It doesn’t usually erase the whole move, just part of it.
C → D (Continuation Move):
Here’s the key: the price often makes another move, similar in size and angle to A → B. That’s why people say the ABCD has “symmetry.”
So, when you connect the dots A-B-C-D, you get a neat geometric shape that traders call the ABCD trading pattern. ⚠️ But a warning straight away: no matter how perfect an ABCD looks on paper, it cannot be read in isolation. Without confirmation from other tools — volume, momentum indicators, or broader market context — it’s just a geometric doodle on your chart.
🟩 Bullish and Bearish Variants
Like most patterns, ABCD has two moods. The bullish ABCD pattern shows up after a down-move, hinting that the market might be ready for a rebound. The bearish sibling often forms after an up-move, suggesting exhaustion.
The structure doesn’t change — it’s always AB, BC, and CD — but the meaning depends on where it forms. In a bullish ABCD, sellers push the price down twice before running out of strength, and that’s when buyers often step in. In a bearish ABCD, buyers push the price up twice, but eventually lose momentum, giving sellers a chance to take over. So when you see an ABCD chart pattern, you’re not just connecting dots — you’re watching how buyers and sellers take turns, and where one side might finally give up control.
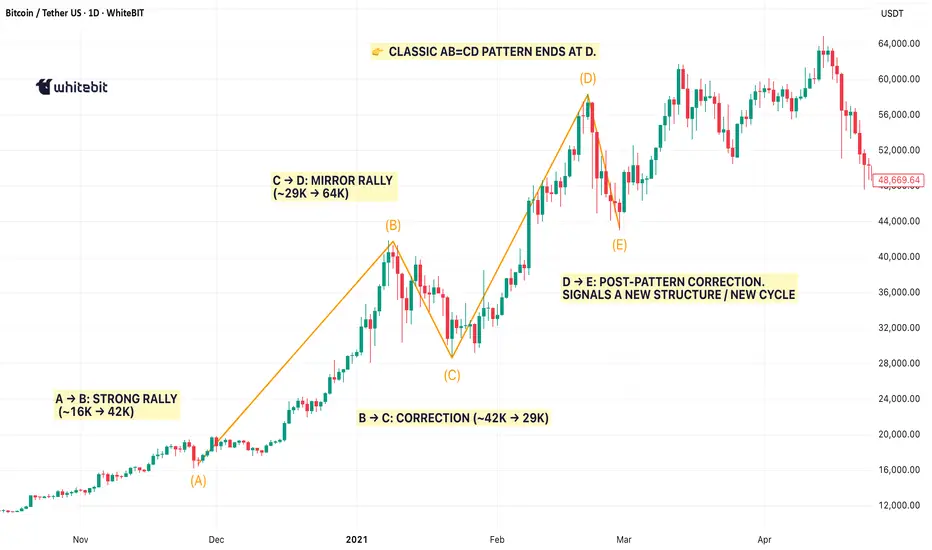
📊 Real Market Example
Take Bitcoin in early 2021. After a powerful rally from around ~$14K to ~$42K, BTC corrected back to ~$29K before surging again to new highs near ~$64K. This sequence mapped cleanly into a textbook ABCD pattern:
A → B: The rally into the ~$42K peak.
B → C: The correction down to the ~$29K zone.
C → D: A rebound to ~$64K, completing the mirrored leg.
It wasn’t a trading signal on its own — far from it. However, when combined with fading momentum and volume divergence, the ABCD chart pattern provided a visual anchor for identifying exhaustion in what was becoming an overheated market.
🧩 Why the ABCD Pattern Still Matters
The appeal of the abcd trading pattern lies in its simplicity. Markets are noisy, messy, and emotional. The ABCD strips that down to a geometric rhythm that even a beginner can spot. But here’s the catch: if you lean only on it, you’ll miss the bigger story. Professional analysts stress this constantly: the ABCD pattern works best as part of a toolkit. Pair it with Fibonacci retracements, moving averages, or support/resistance zones, and you’ll see how it fits into the wider puzzle. Alone, it’s just half a sentence. Together with other tools, it becomes part of the market’s story.
🎯 Final Thoughts
So, what is the ABCD pattern? It’s not magic, not a guarantee, but a visual lens. Think of it as one of the market’s favorite ways of whispering: “Something’s happening here.” The trick is listening carefully and comparing it with the rest of the orchestra. Because in trading, and especially in crypto, a single instrument never plays the whole song.
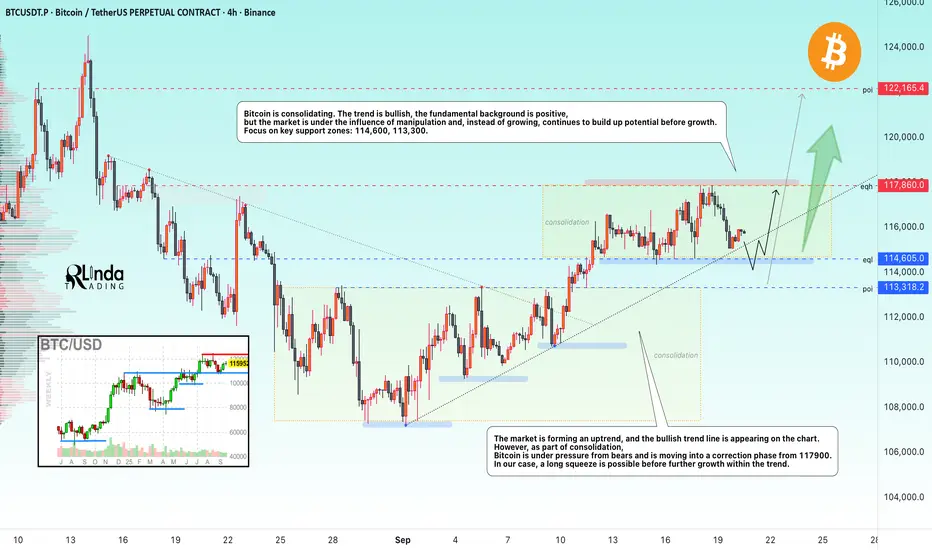
BITCOIN → Manipulation, long squeeze before growth BINANCE:BTCUSDT is in a global bullish trend. The fundamental background, following the start of interest rate cuts, is taking a positive turn, but instead of growth, the market is consolidating...
Bitcoin is showing resilience, trading within the specified trading range (above 114K) amid the Fed's policy easing. For three weeks in a row, growth has been supported by dovish signals from the central bank and growing institutional demand.
Key drivers: The Fed's 25 bps rate cut and forecasts of further easing (to 3.6% by the end of 2025) have strengthened the fundamental backdrop in the cryptocurrency market. Corporate and ETF purchases continue to fuel the bullish trend. Low rates reduce the attractiveness of bonds and increase interest in Bitcoin.
Technically, the market, influenced by manipulation rather than growth, continues to accumulate potential before growth.
Resistance levels: 117860,
Support levels: 114600, 113300
The market is forming an uptrend, with a bullish trend line appearing on the chart. However, as part of consolidation, Bitcoin is under pressure from bears and is moving into a correction phase from 117900. I expect that MM may form a long squeeze in the liquidity zone. That is, a false breakdown of the consolidation support and trend at the same time, and only then return to an upward movement.
Best regards, R. Linda!
Bitcoin (BTC): Buyers Are Beings Taken Out | RectemberIt's Rectember, bloody markets all over the coins and also BTC. Despite the fact that the bull run has not ended yet, better is yet to come!
We have had a breakdown on BTC during the night, which broke the local support zone and might send the price back as low as the $108K zone, where the major support zone is currently sitting.
This is not yet confirmed, as the price might suprice us and buyers might reclaim the local support zone (the one we broke recently) and if they do so by the end of the week, then that's where we will be expecting a bounce to happen. If not, then our attention will be at the $108K zone.
Swallow Academy

BTCUSD BUYBTCUSD H4 CHART
Hello Traders. If you find this analysis useful, please support me with your likes and comments.
If you have another analysis at this pair, please share in comments, I will be glad to discuss with you.

#BTC/USDT WEEKLY CHART UPDATE !!#BTC/USDT is in a strong uptrend, currently trading around $111,700. Key resistance is at $120,000, and a breakout above this level could push the price towards $130,000–$135,000. On the downside, support lies at $105,000–$108,000, with major support near $100,000. Staying above $105,000 maintains the bullish trend, while a drop below $100,000 could lead to a decline towards $92,000–$95,000.
