Bulls strike back, BTC holds steady in the $112,000 range!
Bitcoin is trading around $112,256 today, bringing its market capitalization to $2.23 trillion. Trading volume over the past 24 hours reached $44.38 billion, with the intraday price fluctuating between $109,257 and $112,327—small fluctuations, but enough to get traders' pulses racing.
Looking at the daily chart, Bitcoin appeared to have staged a textbook slump in early September, sliding to the $107,000 region. But then—dramatic music—it double-bottomed like a seasoned professional and rallied with conviction. The green candlesticks, coupled with volume, indicate a renewed surge in bullish sentiment.
The potential long entry point between $110,000 and $111,000 now appears fully validated, with resistance between $117,000 and $118,000 looming. The breakout from consolidation is supported by strong volume, and this rally has a good chance of success—assuming buyers don't exit mid-stream.
After a sharp drop that pushed Bitcoin to $108,652, the asset quickly rebounded, retaking $112,000. We're witnessing a classic V-shaped rebound, with increasingly higher lows. The $109,000 to $110,500 entry zone is ideal, with resistance ahead at $113,500 to $114,000. If the price gets hammered there, some consolidation is expected—but as long as it holds above $108,500, the bulls remain firmly in control.
As long as Bitcoin holds above $112,000, the next logical short-term profit-taking zone lies in the $112,500 to $113,000 window. However, be mindful of bearish divergences in the relative strength index (RSI), as latecomers could be getting scammed.
Now, let's talk about indicators. Oscillators displayed a diplomatic demeanor today—generally neutral. The Relative Strength Index (RSI) was at 48, while the Stochastics oscillator was at 30 and the Commodity Channel Index (CCI) was at −58—all neutral readings. Even the Average Directional Index (ADX), typically a proxy for trend strength, finished at a languid 17. The Awesome Oscillator (AO) dipped to −1986 (also neutral), but Momentum flashed a mildly bullish signal at −3390. The Moving Average Convergence Divergence (MACD) was less supportive of the rebound, flashing a bearish signal at −658. Thus, while the oscillators were acting conservatively, Momentum whispered, "Buy the dip," while the MACD whispered, "Not yet, my friend."
Moving averages (MAs) are the Thanksgiving dinner of the financial world: some support, some don't. The 10-period Exponential Moving Average (EMA) and Simple Moving Average (SMA) waved bullish flags at $112,153 and $112,209, respectively. But the 20-, 30-, and 50-period moving averages—both EMAs and SMAs—are flashing red. If you're counting, that's four consecutive bearish signals. The 100-period EMA at $111,792 offers some hope, and the longer-term 200-period MAs are clearly bullish: the EMA at $106,343 and the SMA at $104,609. Need I make this clear?
The long-term trend remains bullish, but the short- to medium-term picture is quite divided.
In summary, Bitcoin has regained support across multiple timeframes, accompanied by strong volume and a bullish technical pattern. Traders seeking an entry should closely monitor a pullback to the $110,000 to $111,000 area. If $108,500 holds, the current breakout rally has room to continue. But don't ignore the mixed signals from key oscillators and moving averages—the road ahead won't be smooth.
The bulls are back in control and showing no signs of letting up. With a confirmed breakout across all timeframes, strong support at $108,500, and a high-volume rebound from recent lows, the situation favors the bulls. Momentum is quietly building behind the scenes, and the 200-period moving average is perfectly aligned with the long-term trend. As long as Bitcoin doesn't break below $110,000 on low volume, there's a chance the market will head straight for the $117,000 to $118,000 region.
But caution, my friends. While the recent rebound looks convincing, several key moving averages remain bullish, and the sell signal from the MACD should not be taken lightly. Oscillators are neutral at best—not exactly encouraging. If Bitcoin fails to break through $113,500 and flips on declining volume, we could be seeing a bull trap forming. A break below $108,500 would invalidate the entire short-term rally and reopen the door to sub-$107,000 lows!
BTCUSDT.P trade ideas


Ichimuko talks againAccording to BTC price action based on ichimuko clouds we can see that the last time BTC have crossed the red cloud it leaded to a new Ath
Today is the first day of breaking it again
We expect a new ATH as soon as possible
Stop loss under the cloud around 11k
Tp at least 128k
Dyor

MY BTC LONG TERM BIAS $90k - $75kIts obviously obvious green candle chaser will sooner or later get trashed because they fail to understand that the green candles we are currently seeing are as a result of the USDT Dominance taking a break to the downside.
From experience, when the USDT Dominance take a mild dive, BTC only gets a few thousands in aapreciation.
But when table turns, the outcome is always alarming.

Ready for BTC/USDT's Next Big Move?🎉 BTC/USDT: "Bitcoin vs. Tether" Crypto Wealth Heist Map (Swing/Day Trade) 🤑
🚨 Thieves of the Crypto Market, Assemble! 🚨
Ready to pull off a stylish swing/day trade heist on BTC/USDT? This is your Crypto Wealth Strategy Map with a bullish setup that’s screaming opportunity!
📈 Let’s dive into this cheeky yet professional plan with a sprinkle of thief swagger to snatch those profits! 💰
📊 The Setup: Why This Trade is a Steal! 🕵️♂️
Bullish Confirmation: We’ve got a double bottom pattern signaling a potential reversal. ✅
Accumulation Zone: Price action shows buyers stacking up, ready to push BTC higher. 🛒
Heikin Ashi Reversal: Smooth, green Heikin Ashi candles confirm the bullish vibes. 🟢
Market Sentiment: The crypto streets are buzzing with optimism — time to capitalize! 😎
The Thief’s Entry Plan: Layered Limit Orders 💸
This is where our thief strategy shines! We’re using a layering strategy with multiple buy limit orders to sneak into the market like the slick bandits we are. 🕴️
Entry Levels:
🎯 $112,000
🎯 $113,000
🎯 $114,000
🎯 $115,000
🎯 $116,000
Pro Tip: Feel free to add more layers based on your risk appetite! Stack those orders like a master thief planning the perfect heist. 😏
Why Layering?: This approach lets you average into the position, reducing risk if the market pulls a fast one. 🃏
🛑 Stop Loss: Protect Your Loot! 🔒
Thief’s Stop Loss: Set at $110,000. This is our escape hatch if the market turns into a trap. 🕳️
Note: Dear Thief OGs (Ladies & Gentlemen), this SL is just a suggestion. You’re the boss of your own vault — adjust it to your risk tolerance! 💪
🎯 Target: Cash Out Like a Pro! 🏦
Profit Target: Aim for $127,000, where we expect strong resistance and potential overbought conditions. Watch out for a possible trap — don’t get greedy! 😈
Note: Dear Thief OGs, this TP is my take. You decide when to grab your profits and vanish into the crypto night. 🌙 Take the money and run at your own discretion!
🔗 Related Pairs to Watch 👀
Keep an eye on these correlated pairs (all in USD) to confirm the broader market trend:
BITSTAMP:ETHUSD : Ethereum often moves in tandem with Bitcoin. A bullish ETH could reinforce BTC’s upward momentum. 📈
BITSTAMP:XRPUSD : Ripple’s price action can signal broader crypto market strength. Watch for similar bullish patterns. 🌊
COINBASE:LTCUSD : Litecoin tends to follow BTC’s lead. A breakout in LTC could confirm our bullish bias. ⚡
Key Correlation Insight: These pairs often move together due to shared market sentiment in the crypto space. If BTC/USDT pumps, expect ETH, XRP, and LTC to potentially follow suit. Cross-check their charts for confluence! 🧠
🛠️ Technicals Recap: The Thief’s Toolkit 🧰
Double Bottom: A classic reversal pattern signaling bulls are ready to charge. 🐂
Accumulation Zone: Buyers are quietly stacking positions — a sign of strength. 📦
Heikin Ashi: Smooth candles filter out noise, confirming bullish momentum. 🕯️
Resistance Watch: $127,000 is a key level where sellers might step in. Stay sharp! ⚠️
⚠️ Disclaimer: Thief Style, Just for Fun! 😜
This Thief Strategy is for entertainment and educational purposes only. Trading is risky, and the crypto market can be a wild ride. Always do your own research (DYOR) and manage your risk like a seasoned bandit. I’m not a financial advisor, just a cheeky chart enthusiast sharing the vibe! 😎
✨ If you find value in my analysis, a 👍 and 🚀 boost is much appreciated — it helps me share more setups with the community!
#BTCUSDT #CryptoTrading #SwingTrading #DayTrading #ThiefStrategy #Bullish #TechnicalAnalysis #HeikinAshi #DoubleBottom #MakeMoney

Where Can Bitcoin Go? Part 9 – Breakout and History in Motion🌋🚀 Where Can Bitcoin Go? Part 9 – Breakout and History in Motion. 🔓💥
The breakout over 114900 has happened.
After 2 rejections, years of preparation, and countless fakeouts… Bitcoin has finally cleared the $114,921 barrier.
We are now officially in price discovery mode within the upper resistance channel.
📍 As long as BTC stays above $114,900 – we are long.
This level is now our trigger line. Lose it? Flip back to short bias. Hold it? There’s only one word: 🚀
🔑 Context:
We’ve tracked this structure since 2023 using a 1-2-3 model based on macro highs. The third test is always the decider — and this time, we broke through.
✅ Test 1: Rejected (2021)
✅ Test 2: Rejected (2025)
✅ Test 3: Breakout confirmed (July 2025)
Now compare that to previous cycles:
2016 halving → ATH in 2017
2020 halving → ATH in 2021
2024 halving → ATH coming by end of 2025?
🧭 Based on this map, BTC’s next structural targets are:
→ $137K
→ $160K
→ $182K+
But there’s a catch: if we fall back below 114,900, the entire breakout thesis is at risk. This is now a binary zone.
⚠️ What to Watch:
📌 Support Retests:
Expect volatility around the 114.9–116K level. This zone will now be stress-tested.
📌 Media Frenzy vs Structure:
As hype increases, stick to levels — not noise.
📌 Ultimate FOMO vs Breakdown:
Hold structure = ATH potential
Lose structure = Down we go, potentially hard.
🎥 Missed the full structural breakdown?
👉 Watch “Where Can Bitcoin Go? Part 8” for the blueprint
👉 This is now Part 9 – The terminal move has begun
We are now playing for cycle maturity – this could be the final leg before topping out in late 2025.
Let’s trade it with clarity, not emotions.
One Love,
The FXPROFESSOR 💙
Disclosure: I am happy to be part of the Trade Nation's Influencer program and receive a monthly fee for using their TradingView charts in my analysis. Awesome broker, where the trader really comes first! 🌟🤝📈
🚨 BITCOIN HAS BROKEN OUT but keep in mind: under 114900 be OUT!

TradeCityPro | Bitcoin Daily Analysis #179👋 Welcome to TradeCity Pro!
Let’s move on to Bitcoin analysis. After a few days, it’s time to resume our updates.
⌛️ 4-Hour Timeframe
After breaking the 116,960 zone, Bitcoin failed to hold above it and the upward move turned out to be a fake breakout.
⚡️ Following that, a corrective move began. After consolidating below 114,819, the price continued its correction down to 111,524.
✔️ So far, the reaction to this level has been positive, with several green candles forming off this support.
🔑 However, the key point is that volume hasn’t increased, which is not a good sign for buyers.
🔍 If 111,524 breaks, the downtrend could extend toward the main support floor below.
💥 On the other hand, if price manages to create higher highs and higher lows above 111,524 and volume starts to pick up, a confirmed close above 114,819 could offer a long entry setup.
📈 A breakout of 116,960 will remain the primary long trigger. A clean break above that level will confirm the start of a new bullish leg.
❌ Disclaimer ❌
Trading futures is highly risky and dangerous. If you're not an expert, these triggers may not be suitable for you. You should first learn risk and capital management. You can also use the educational content from this channel.
Finally, these triggers reflect my personal opinions on price action, and the market may move completely against this analysis. So, do your own research before opening any position.

BITCOIN DAILY CHARTTHE DAILY chart just broke a daily support and the close will be continues sell into current demand at 107.4336
if sellers continue to sell they will definitely come to 100-99k demand floor of the bullish flag pattern, it was our previous supply and could become our current demand on probability
shortly below that zone will be a clean BAR ( BREAK AND RETEST ZONE ) as illustrated on the chart for clarity and context.
my last demand which could be adjusted will be in the zone of 88k-90k before the rain.
note ;trading is 100% probability ,pls manage your risk.
GOODLUCK
#BITCOIN #BTCUSDT

BTCUSDT: Bearish Pressure Remains ? 👋Hello everyone, what do you think about the trend of BINANCE:BTCUSDT ?
Today, BTCUSDT is trading around 114,300 USDT, pulling back after once again being rejected near the strong resistance zone of 117,500 USDT and forming a descending price channel.
If selling pressure continues, BTC is likely to head toward the support zone of 108,000 – 110,000 USDT, or even lower, where new buying interest may emerge. As long as Bitcoin has not broken out above the channel limit, the short- to medium-term downtrend remains dominant.
What do you think about BTCUSDT? Share your thoughts in the comments!

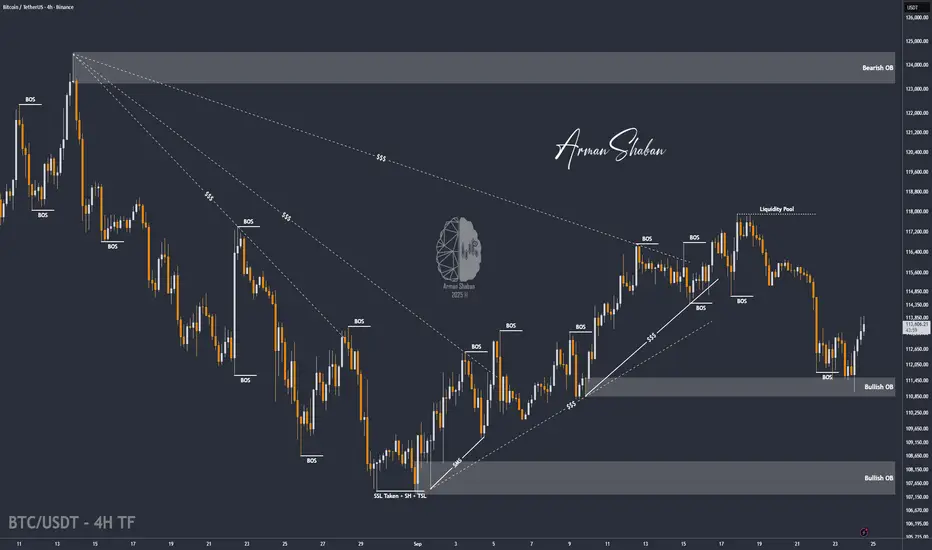
BTC/USDT | BTC Bounce After $111K Dip – Liquidity Gap in FocusBy analyzing the Bitcoin chart on the 4-hour timeframe, we can see that after a heavy correction down to $111,000, the price found demand again and is now trading around $113,600.
I expect Bitcoin to continue rising to fill the liquidity gap, with the first target at $114,150. Other targets and scenarios will be shared tomorrow!
Please support me with your likes and comments to motivate me to share more analysis with you and share your opinion about the possible trend of this chart with me !
Best Regards , Arman Shaban
Bitcoin I Daily Range Manipulated - chance for push upHello traders, as you know when range low is manipulated price goes to the opostin liuqditiy for the stop hunt. Order flow changed to the bullish. there is chance that we are in distribution phase.
🧪This concept is very easy to follow here are few examples of the recent trades.
✅ EURUSD - Stop hunt of the range
✅ USDCHF - Stop hunt of the range
✅ GBPUSD - stop hunt of the range
💊 Note: this is just a probability. Win rate of this method is above 70% if you trade it with the right market context.
“Adapt what is useful, reject what is useless, and add what is specifically your own.”
David Perk aka Dave FX Hunter ⚔

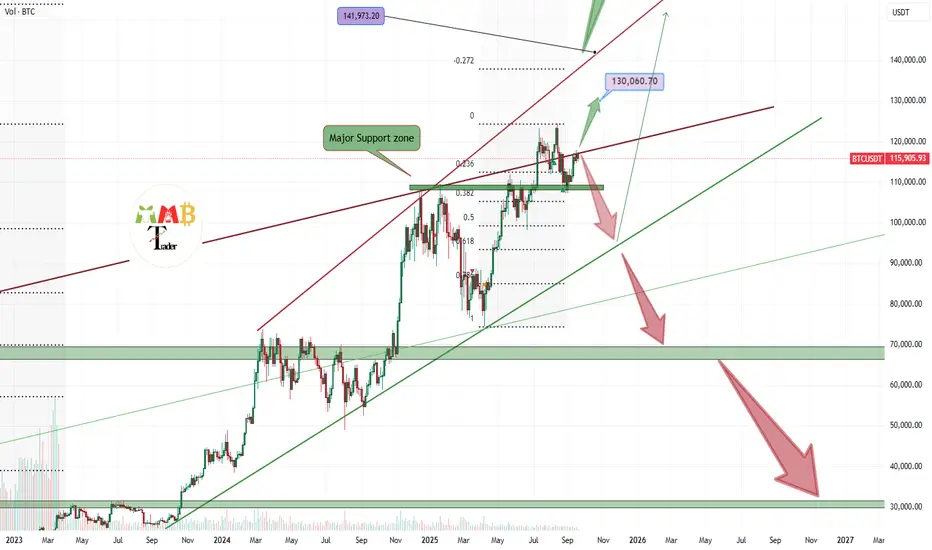
Bitcoin is struggling with 117K Resistance and may dumpAs we can see the chart is clear for the targets like 130K$ but only if the 117K$ resistance zone break to the upside else the market will see some boring range here or even short-term fall first and then near 100K$ support zone again pump will lead to new ATH.
DISCLAIMER: ((trade based on your own decision))
<<press like👍 if you enjoy💚
Bitcoin Defends $111,816 Fibonacci Support as Bulls Target PoinBitcoin is holding above $111,816, a high-confluence support region that includes Fibonacci retracements and the value area low. Bulls must defend this level to maintain momentum toward higher resistance levels.
Bitcoin’s price action remains stable above a critical support at $111,816, reinforced by the 0.618 Fibonacci retracement, the value area low, and a recent swing low. This confluence makes the level a key battleground for bulls. Holding above it keeps the door open for a bullish rotation back into the point of control, which remains the ultimate resistance on the intraday timeframe.
Key Technical Points:
- $111,816 Support Zone: Anchored by Fibonacci, value area low, and swing low.
- Bullish Requirement: Price must remain above 0.618 Fibonacci for upside continuation.
- Resistance Target: Point of control serves as the immediate upside objective.
The $111,816 region has emerged as a critical inflection point for Bitcoin. With multiple technical layers converging here, buyers have a clear line in the sand to defend. Past reactions from similar confluences have led to sharp upside rotations, adding conviction to this setup.
Remaining above this level keeps the bullish trend intact on the intraday timeframe. The path toward the point of control becomes increasingly likely if volume inflows support the defense. However, slipping below $111,816 would expose Bitcoin to deeper corrective structures, weakening the bullish case in the short term.
The point of control remains the next major objective, representing the area of highest traded volume and strong resistance. Successfully reclaiming it would mark a significant bullish milestone in BTC’s market structure.
What to Expect in the Coming Price Action
As long as Bitcoin holds $111,816 support, the probability of a bullish rotation toward the point of control remains high. A breakdown below this zone would shift momentum back to sellers and signal caution.

BTCUSD BUYBTCUSD H4 CHART
Hello Traders. If you find this analysis useful, please support me with your likes and comments.
If you have another analysis at this pair, please share in comments, I will be glad to discuss with you.

Bitcoin Reclaims Point of Control as Bulls Target New ATHBitcoin has confirmed a runaway gap on CME futures while reclaiming the point of control on Bybit. This shift turns resistance into support, setting the stage for a potential run to new highs.
Bitcoin began the week with powerful momentum, building on weekend lows to reclaim a major resistance level on futures charts. The confirmation of a runaway gap and strong close above the point of control have strengthened the bullish outlook, raising expectations for further expansion.
Key Technical Points:
- Bitcoin closed above the point of control (POC), turning it into support.
- Runaway gap on CME futures confirmed, boosting momentum.
- Dips below POC likely to be bought, indicating demand.
The CME futures chart highlighted a runaway gap that has now been confirmed, often signaling strong continuation in the dominant trend. On Bybit futures, Bitcoin followed through by closing above its long-time resistance at the POC, a decisive technical shift that suggests buyers are regaining control.
As long as the POC remains a support base, dips beneath are expected to find demand, reinforcing the bullish structure. This structural development provides a clear path for price to challenge and potentially surpass its all-time high.
What to Expect in the Coming Price Action:
Bitcoin remains highly bullish above its point of control. If support holds, momentum favors continuation toward a new all-time high, with market demand underpinning the move.

BTC Buy Plan - What do you think? Reasons I believe MEXC:BTCUSDT can pump:
1- Overall BTC trend is still bullish.
2- Price has already swept Monday low.
3- Bullish Harmonic Shark pattern’s D leg is completed.
4- Price is currently respecting Monday low.
What are your thoughts? Share them in comments!

BTC/USDTI think wave 2 of C has completed, I will open a short position for wave 3 of C with this setup.

New Bullish Trend Is About To Start 📈 Currently, Bitcoin is forming an ABCDE structure, and it seems that wave E has completed around the 108,500 level. I expect a new bullish trend to begin with a breakout above the 108,000 level toward a 127500 and 133k

Bitcoin (BTC): Strong Push From Buy Zone | BullishBTC showed a clean bullish break of structure from the $108K buy zone, where buyers stepped in aggressively and pushed the price back above key EMAs. Now, we are consolidating right under the first target zone around $118K, which is the area to watch closely.
If buyers can hold this momentum, the next step will be to reclaim the upper levels and push toward a new ATH. For now, this consolidation looks healthy after the strong recovery, and the game plan remains simple: hold the structure and wait for continuation higher.
Swallow Academy

BTC — Sunday Liquidity TrapAfter hitting the BIG resistance at $117,896 (0.618 Fib retracement), BTC rejected as anticipated and started its current downtrend. The anchored VWAP from the $117.9K high has been an excellent guide, acting as resistance → most recently at $113,800, where it provided a clean short entry.
Over the weekend, BTC has traded sideways. We just saw a small pump to clear the range highs and take out buy-side liquidity, a common setup before markets rotate lower to sweep sell-side liquidity.
Key Confluence Zone
The next level of interest sits around $108,250, where multiple factors align:
Monthly Open: $108,246.36
Daily Level: $108,246.35
0.618 Fib Retracement: $108,236.67
Liquidity cluster with many stop-losses residing here
If this zone fails to hold, the next downside interest lies at:
Key Low: $107,255 → possible SFP area
0.666 Fib Retracement: $106,975.52 → additional support
🟢 Long Trade Setup
Entry: Long around $108,250 (mOpen confluence zone)
Stop-Loss: Below 0.666 Fib retracement (~$106,975)
Take Profit: TP1 → $111K, if volume expands → trail stop for higher targets
R:R: ~1:2
Market Insight
Sunday pumps are notoriously unreliable, often designed to trap traders into late longs before a pullback wipes them out. This setup reflects exactly that dynamic.
Indicators used
DriftLine — Pivot Open Zones → For identifying key yearly/monthly/weekly/daily opens that act as major S/R reference points
➡️ Available for free. You can find it on my profile under “Scripts” and apply it directly to your charts for extra confluence when planning your trades.
_________________________________
💬 If you found this helpful, drop a like and comment!

Lingrid | BTCUSDT Pullback Provides Buying OpportunityBINANCE:BTCUSDT has broken down from its range after rejecting the 117k resistance and forming a clear lower high. The sharp selloff has brought price back toward the 111k support zone, which aligns with the Fibonacci golden pocket. Holding above this area could trigger a short-term rebound, but the structure remains fragile. If 111k fails, the next key support sits at 108k, pointing to deeper downside risk.
⚠️ Risks:
A breakdown under 110k confirms bearish continuation toward 108k.
Market sentiment around Fed policy could accelerate volatility.
Only a sustained break back above 116k would negate the bearish setup.
If this idea resonates with you or you have your own opinion, traders, hit the comments. I’m excited to read your thoughts!

BTC Game Plan – (LDMD Model)BTC Game Plan – (LDMD Model)
📊 Market Sentiment
FED has resumed its rate-cutting cycle, starting with a 0.25% cut in September, with two more expected. Institutional liquidity inflows have accelerated as the U.S. officially adopts crypto as part of its reserves. Despite elevated inflation, a weakening labor market is forcing the FED to ease, pushing more capital into risk-on assets.
📈 Technical Analysis
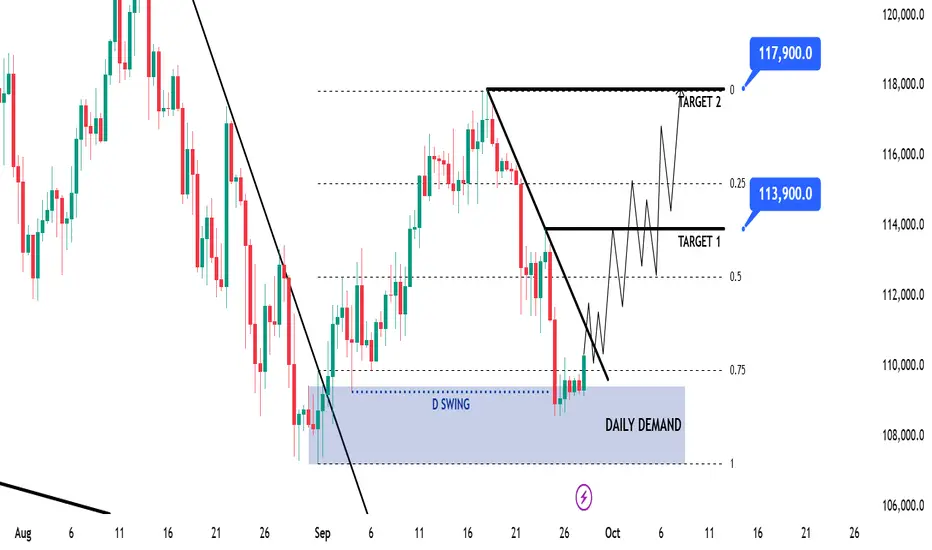
BTC is trending strongly bullish on the HTF, so long setups remain the priority. Recently, price broke the bearish trendline that had capped price action since August 13, signaling a shift in momentum. That breakout created a Daily Demand zone, which was tapped once before price moved higher — confirming liquidity inside the zone.
Currently, BTC ran the daily swing low (the first tap of that demand), revisited the Daily Demand, and repriced into the 0.75 Fibonacci max discount level. This strong confluence suggests accumulation and potential continuation higher.
📘 Model to be used – LDMD (Liquidity Run inside Daily Demand w/ Max Discount Zone)
In this model, I start by confirming the HTF trend to set directional bias. Then, I identify key Demand/Supply zones that carry significant liquidity. A sweep of HTF swing lows adds confluence by trapping liquidity. Finally, I align this with the 0.75 max discount retracement zone for a high-probability entry point.
📌 Game Plan
1-Wait for a daily close above the bearish trendline.
2-Enter long on confirmation.
🎯 Setup Trigger
Daily close above the bearish trendline.
📋 Trade Management
Stoploss: 108,500$
Targets:
TP1: 113,900$
TP2: 117,900$
After TP1, move SL to breakeven to secure profits.
💬 Like, follow, and comment if this breakdown supports your trading! More setups and insights coming soon — stay connected!
⚠️ Disclaimer: This content is for informational and educational purposes only and does not constitute financial, investment, or trading advice. Always DYOR before making any financial decisions.
Bitcoin Bounces Strongly from Key Support – What’s Next?🔎 Technical Outlook (BTC/USDT, 4H):
1. Key Support: Bitcoin held the 110K – 112K zone, a historically strong demand area that triggered a solid rebound.
2. Channel Breakout: Price has broken out of a short-term descending channel, shifting momentum in favor of the bulls.
3. Immediate Resistances:
• First resistance: 115.5K – 116K
• Next major resistance: 118K – 120K (upper channel boundary)
4. Scenarios:
• 🟢 A confirmed breakout above 115.5K opens the path toward 118K → 120K.
• 🔻 Failure to clear resistance could trigger another pullback toward 112K or even a retest of 110K.
📌 Summary: Bitcoin has defended its major support and is showing bullish momentum in the short term. However, the upcoming tests at 115K+ will decide whether this move evolves into a stronger rally or just a corrective bounce.
