BTCUSDT: Trend in 4-H time frameThe color levels are very accurate levels of support and resistance in different time frames.
A strong move requires a correction to major support and we have to wait for their reaction in these areas.
So, Please pay special attention to the very accurate trend, colored levels, and you must know that SETUP is very sensitive.
BEST,
MT
BTCUSDT.P trade ideas

Deep Learning Model for 24-Hour BTC Price PredictionHi everyone,
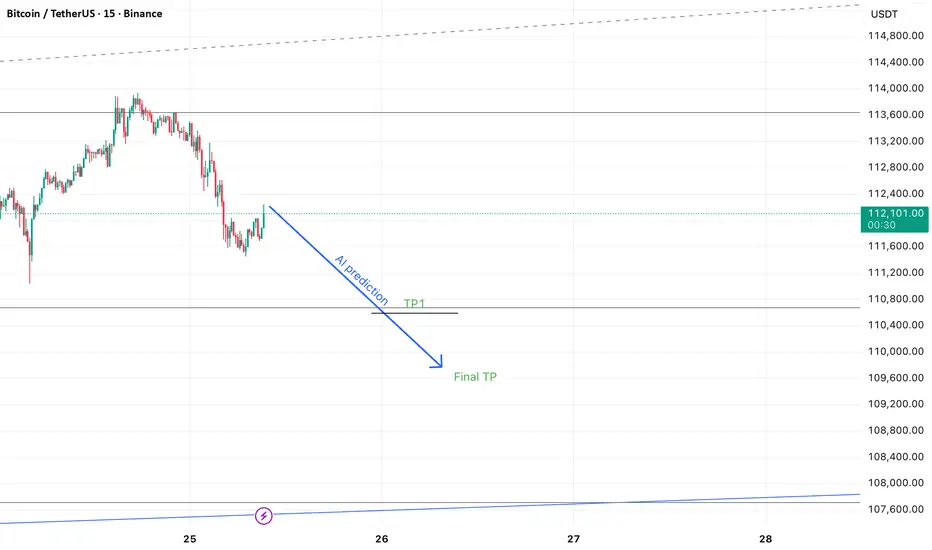
I’ve developed a deep learning AI model designed to predict BTC's price movement over the next 24 hours on the 15-minute timeframe.
It’s important to note that this model does not directly provide exact entry points for trades. Instead, it indicates the likely direction of the market, meaning you’ll still need basic trading knowledge to apply it effectively.
After testing it over the course of one month, I achieved a success rate of around 90% in my trades when using the model as part of my strategy.
The model was trained using the following features:
Time-related: Hour, DayOfWeek
Price & volume lags: Close_lag_1, Close_lag_2, Close_lag_4, Close_lag_8, Close_lag_12, Volume_lag_1, Volume_lag_2, Volume_lag_4, Volume_lag_8, Volume_lag_12
Moving averages & statistics: MA_4, Std_4, Dist_MA_4, MA_16, Std_16, Dist_MA_16, MA_48, Std_48, Dist_MA_48, MA_96, Std_96, Dist_MA_96
Technical indicators: Return_log, MACD, RSI
Hourly Forecast for the Next 24 Hours
2025-09-25 10:00:00+00:00 111550.165640
2025-09-25 11:00:00+00:00 111376.971911
2025-09-25 12:00:00+00:00 111228.010503
2025-09-25 13:00:00+00:00 111113.808253
2025-09-25 14:00:00+00:00 111015.461229
2025-09-25 15:00:00+00:00 110924.218881
2025-09-25 16:00:00+00:00 110836.693056
2025-09-25 17:00:00+00:00 110752.812431
2025-09-25 18:00:00+00:00 110671.121547
2025-09-25 19:00:00+00:00 110589.284377
2025-09-25 20:00:00+00:00 110507.299785
2025-09-25 21:00:00+00:00 110426.231097
2025-09-25 22:00:00+00:00 110347.648529
2025-09-25 23:00:00+00:00 110272.293736
2025-09-26 00:00:00+00:00 110200.252059
2025-09-26 01:00:00+00:00 110128.568457
2025-09-26 02:00:00+00:00 110076.551644
2025-09-26 03:00:00+00:00 110033.237232
2025-09-26 04:00:00+00:00 109989.062884
2025-09-26 05:00:00+00:00 109942.853975
2025-09-26 06:00:00+00:00 109895.090788
2025-09-26 07:00:00+00:00 109846.533566
2025-09-26 08:00:00+00:00 109797.842122
$BTC Bearish Short-Term (September 24, 2025)BINANCE:BTCUSDT
Summary of Price Action:
Recent Movement: In the last 24 hours, BTC has dropped by about 0.5% - 0.9%, reaching $112,479 this morning (UTC). This follows a slight recovery from $107,200 on September 23, but it's now retesting support at $112,000. In your 2H chart, we see a series of red candles (bearish) indicating selling pressure, with trading volume increasing during the decline, confirming seller interest.
Key Levels:Support: $112,000 (immediate level, tested today) and $110,000 - $107,200 as a stronger lower zone. If $112,000 breaks, we could see a drop toward $109,000.
Resistance: $115,000 - $117,000 (strong level with recent rejections). A break above $117,000 would signal recovery toward $120,000.
Volume and Liquidity: 24-hour volume is around $52 billion, with large liquidations ($1.7 billion in the last 24 hours), mostly long (bullish) positions. This shows smaller traders suffering from bearish pressure.
MACD Indicator Analysis :
In the chart you sent, the MACD line (blue) is slightly above the signal line (orange), but the histogram is turning negative (red bars growing). This indicates a bearish divergence – the price is weakening while momentum is losing strength. MACD is below the zero line, confirming a weak short-term trend. RSI (at similar levels) is around 44-55, signaling lightly oversold, but still without strong buy signals.
Overall Trend:
Bearish Short-Term, Bullish Long-Term
Short-Term (Today/Next Day): Bearish. The price is consolidating in a bearish channel, with predictions for further downside toward $110,000 - $107,000 today or tomorrow, due to fear sentiment (Fear & Greed Index at 43) and pressure from liquidations. This matches your chart, where we see a potential inverse "head and shoulders" pattern (but still uncertain). Avoid immediate buys – wait for confirmation below $112,000 for shorts or above $115,000 for longs.

Daily Bitcoin Signal: Watching the 110,500 Breakout, target 113KBitcoin Technical Signal
Bitcoin is currently showing signs of strength as it tests the key resistance level around 110,500. A confirmed breakout above this zone could trigger fresh bullish momentum, opening the door for higher targets in the short term.
Here’s my personal trade plan:
If the price breaks and closes a 1H candle above 110,500, I will enter a long position.
🎯 Target 1: 111,650
🎯 Target 2: 113,200
🛑 Stop-loss: 109,500
Please note:
This is not financial advice – I’m only sharing my personal trades.
Always do your own research before taking action.
👍 Don’t forget to boost my trading idea if you found this useful, and feel free to follow me for more analysis of this kind.
Best of luck 🌹

#BTCUSDT.P (15m Chart)#BTCUSDT.P
(15m Chart)
🔹️ Bitcoin Futures Analysis 🔹️
✅ Entry Zone: 109,800 – 109,500
❌ Stop Loss: 108,000
🎯 Targets:
🔰 Target 1: 111,000
🔰 Target 2: 111,800
🔰 Target 3: 112,400
🔰 Target 4: 113,600
🔰 Target 5: 114,500
📌 Based on the current conditions of Bitcoin and USDT dominance, I expect a bullish move in the market this week.
📍 This is the setup I expect to play out for Bitcoin.
⚠️ Important Notes:
Keep leverage below 10.
Follow risk management strictly.
Do not place pending orders. I’m monitoring the market myself, and if the entry zone is reached and conditions look good, I’ll announce the entry.
🆔 @Rasoolahmadi

BITCOIN BTCUSDT WE ARE DONE WITH BITCOIN. Now we announce a buy zone with triple confluence at 98k-100k zone .this zone i will be watching it from 15min chart for my POE.
BUT the sell down hinges on the break and close of 107,347k demand floor ,on technical you cant sell or buy now.
if you want to sell ,the best to sell with less loss is in the zone of 112,780 zone ,a 2hr break and retest level
the bullish flag breakout ROOF AND FLOOR WILL BE OUR NEXT DEMAND ZONE.
THE ROOF IS PROVIDING A BUY AT 98K-100K AND THE FLOOR AROUNDWAY BELOW .
CAUTION IS KEY .
DONT SELL OR BUY BITCOIN UNTIL CLOSE OF 107,347K.
SELL FROM HIGER ZONE.
#BITCOIN #BTC #BTCUSDT

BTC 1H Analysis - Key Triggers Ahead | Day 48❄️ Welcome to the cryptos winter , I hope you’ve started your day well.
⏰ We’re analyzing BINANCE:BTCUSDT on the 1-Hour timeframe .
👀 On the 1-hour timeframe, Bitcoin previously formed a consolidation box at a higher range. After breaking the bottom of that box, it moved down to its support area around $108,800. Since the start of the weekend, price has been ranging in this zone, forming a new consolidation structure. The bottom of this range overlaps with the Tether Dominance resistance, creating a key confluence level. Candle size has been shrinking, signaling an incoming decision point for the next move.
A break above the range high at $109,755 could trigger upward momentum. An important detail here is the fakeout at the top of the range, where buyers failed to push higher and sellers drove price back down.
🧮 The RSI oscillator shows two key levels:
52: Slightly above the 50 baseline, acting as momentum resistance.
30: At the oversold boundary, where a breakdown could start a stronger move.
The previous fakeout at the range high was aligned with a rejection from the RSI resistance around 52, which reinforces the validity of this level. A momentum breakout through this zone could support a long setup.
🕯 Candle size and volume have significantly decreased due to consolidation and the weekend lull. With increased volume at the start of the new week, we can expect stronger candles. It doesn't matter which direction initiates the move — the breakout from this range will likely occur through a whale candle that clears the orderbook in one direction.
💵 From earlier Tether Dominance analysis, a break below 4.46% could inject bullish volume into the market and allow Bitcoin to break its range high and begin a new upward leg. However, a break above 4.72% on Tether Dominance could trigger deeper correction in Bitcoin, pushing it toward lower supports.
🧠 Two main scenarios for Bitcoin positions are currently in play:
1️⃣ Long Setup :
Wait for multiple rejections to complete and for Tether Dominance to lose the 4.46% support. A small green indecision candle before the breakout on Bitcoin would offer a clean entry with a tight stop. As volume increases and confirmation appears, the long position can be held to a suitable reward target. This setup can be taken in inverse correlation to Tether Dominance, using bearish candles there as confirmation.
2️⃣ Short Setup :
If Tether Dominance breaks above resistance and Bitcoin loses its current range support — combined with RSI dropping below 30 and price stabilizing under current support, ideally with a red indecision candle — a short setup becomes valid. However, note that Bitcoin demand is currently rising, and upward movement could occur at any moment. Personally, you prefer not to take short positions here.
❤️ Disclaimer : This analysis is purely based on my personal opinion and I only trade if the stated triggers are activated .

Bitcoin Correction Still in Play – Waiting for a Higher LowIn the 4H timeframe, Bitcoin still hasn’t made the correction I was waiting for.
I see this whole move as a single wave, and I’ll remain patient until we get a higher low (or equal low) around 108,810.
🔹 If no correction happens, I’ll wait for the market to build a clearer structure.
🔹 I’m not opening any positions for now.
🔹 Don’t rush — patience is key. If you stay consistent and keep tracking the market, opportunities will always come.

Forecast for BTCUSDT 30th September 2026My projection / guess for BTC for the current week. Continuation to ~$115k followed by a retrace to ~$110k then continuation up to ~$117k followed by a huge dump.

[SeoVereign] BITCOIN BEARISH Outlook – September 30, 2025Today, as of September 30, I am writing to share my bearish perspective on Bitcoin with a short position.
In this idea as well, I am leaning toward a decline. There are two main reasons for this.
First, the 1.13 ALT BAT pattern. This harmonic pattern has already been confirmed, but since the detailed Fibonacci ranges do not fully match, we cannot rule out the possibility of one more upward wave. Therefore, I am first entering a short position with only a small portion, and then plan to flexibly increase the position depending on the price action. In other words, if the decline unfolds immediately, my analysis will be accurate; on the other hand, I also judge that there is a sufficient possibility of one more short-term wave forming before a reversal to the downside.
Second, the downward breakout of the trendline. Rather than analyzing the harmonic pattern independently, I prefer to combine it with trendline analysis. This is due to the flexible nature of harmonic theory, and through trendlines I can measure both the reference points for position sizing and the strength of momentum.
For these reasons, I entered the first short position, with an average target price set at 110,500 USDT.
Recently, not only the stock market but also the cryptocurrency market as a whole has been in poor condition. I hope that those who are experiencing losses will soon encounter better conditions, and I also hope that sharing my perspective can provide even a small help.
I will continue to update my ideas in line with the chart developments and transparently share my thoughts.
Thank you for reading.

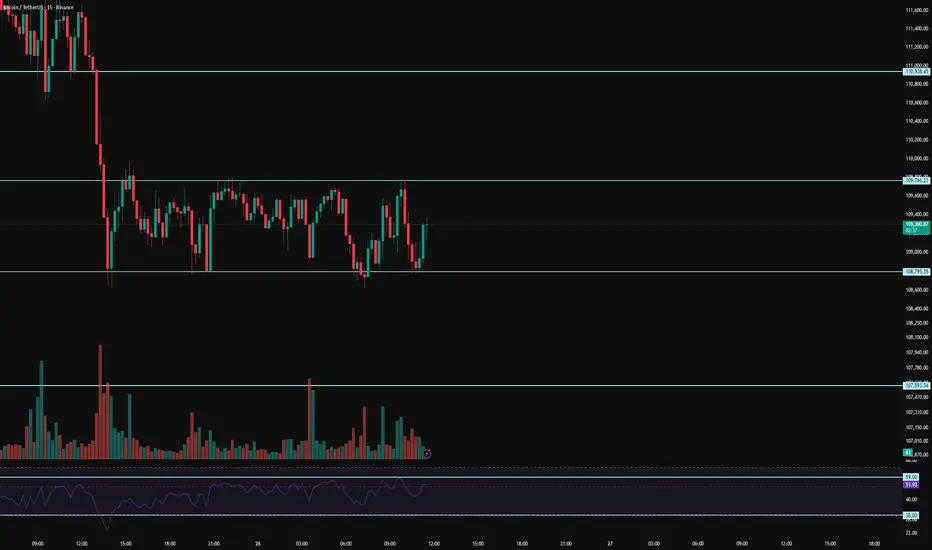
BTC 15M Analysis - Key Triggers Ahead | Day 47❄️ Welcome to the cryptos winter , I hope you’ve started your day well.
⏰ We’re analyzing BTC on the 15-Minutes timeframe .
👀 After several days of decline from the zones we previously identified, we are back to analyze Bitcoin for you. On the 15-minute timeframe, Bitcoin is consolidating above the $108,800 support level, with the upper boundary of this consolidation at $109,760. A breakout above this level could signal the beginning of a new structure and trend. A breakdown below support, however, seems less convincing for a short position, as many traders who feel they missed out are now stepping in to buy. Current support zones are acting as both maker and taker buy levels. Bitcoin requires increased volume to confirm either a breakout or breakdown. With the upcoming weekend, however, risks must be carefully managed due to typically lower market activity.
🧮 Looking at the RSI oscillator, it is currently holding above the 50 level but facing resistance around 59. A breakout above 59 could enable Bitcoin to break consolidation resistance and push higher. On the other hand, a key zone lies near the oversold boundary; if Bitcoin enters this area, selling pressure could intensify and trigger a deeper correction.
🕯 Candle size and volume on the 15-minute chart remain within a range. We must wait for significant volume inflow—either upward or downward—to confirm direction. Bitcoin is shaping a new structure for the upcoming week, so patience is required until a breakout with decisive green or red candles occurs.
🧠 Trading outlook: It is preferable to wait for market structure to mature, with multiple tests of both support and resistance. The candlestick type used for entry is crucial, along with momentum confirmation at key RSI levels. A breakout above $109,766 combined with RSI surpassing 59 could provide a long setup. A breakdown below $108,795 combined with RSI falling below 30 and stronger selling pressure could trigger a short setup. Keep in mind that weekend trading usually comes with lower volume, which may result in indecisive structures—unless an unexpected global event sparks volatility.
❤️ Disclaimer : This analysis is purely based on my personal opinion and I only trade if the stated triggers are activated .
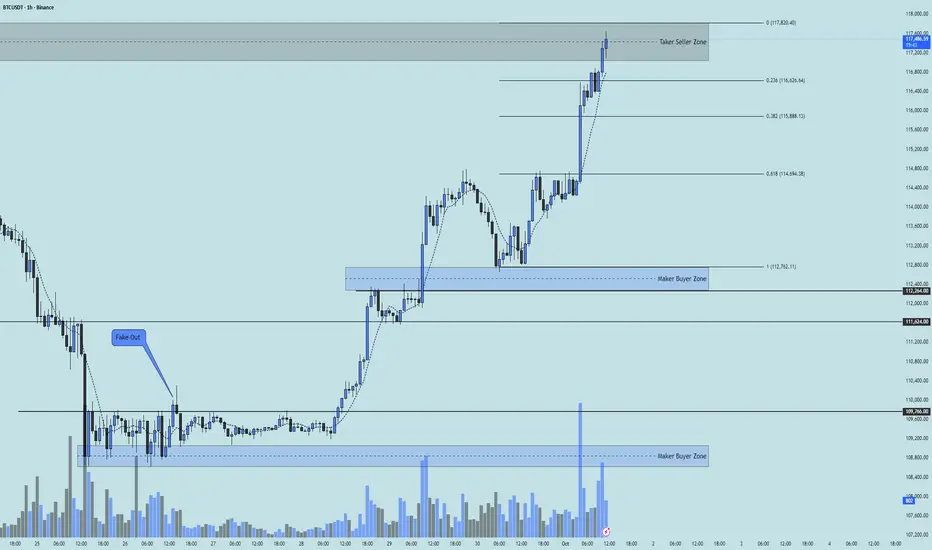
BTC 1H Analysis - Key Triggers Ahead | Day 49❄️ Welcome to the cryptos winter , I hope you’ve started your day well.
⏰ We’re analyzing BTC on the 1-Hour timeframe .
👀 On the 1-hour chart , After a strong bullish rally and breaking the $109,766 zone, BTC managed to move toward $117,000. This level is considered a multi–timeframe daily resistance, and personally I expect a correction here. The second bullish leg, which started after breaking the $111,624 resistance and buyers' micro support at $112,762, is now facing weakness. RSI is also showing reversal signals. The current BTC scenario is a correction toward the marked Fibonacci zones. The upcoming resistance is extremely important, and if it breaks, Bitcoin can continue upward.
🧮 Looking at the RSI oscillator, during both bullish legs it managed to stay firmly in overbought territory, and long-position volatility has significantly increased along with rising buy volume. On the 1H timeframe, RSI doesn’t have a specific key level right now because it has hit a significant swing resistance on the daily timeframe. Breaking out of the marked zone can push BTC higher. This key swing level on the daily RSI is around 61.
🕯 Volume, count, and size of bullish candles have sharply increased. Considering we are sitting at a resistance zone, traders are putting in maximum effort to break it, and volume is rising aggressively. Every sell candle that formed was engulfed by buyers immediately as BTC dipped, and buyers created new positions. Our trend is strongly bullish.
🎮 The Fibonacci is drawn from the start of the new bullish leg to the top of the previous 1H candle's wick. It has identified strong support zones in case BTC corrects, and these levels are considered highly reliable.
📊 The Bitcoin liquidation heatmap currently shows the distribution of short positions, and this spread continues up to $119,000. With upward movement and buyer support, these clusters can get absorbed and liquidated, leading to a short squeeze and a strong move up. Note that the cluster of short liquidations down to $113,000 could get triggered with maximum selling pressure, and this scenario isn’t far-fetched.
🧠 If you haven’t entered a BTC position based on previous analyses, you can wait for corrective support zones to form. Buyer tickers will place their orders below these support levels so we can gain full confirmation before making a BTC entry.
↗️ Long Position Scenario: A break above the seller ticker zone and grabbing accounts holding short positions is required to reduce short-position clusters. Then we need confirmation above our seller ticker zone at $117,820. With the start of a new bullish leg and an indecision candle plus a 7 SMA touch from below, we can open a low-risk long position.
📉 Short Position Scenario: If BTC forms a lower high and lower low with maximum selling pressure, negative economic news, and loses key Fibonacci zones — especially the 61% level — we can consider opening a short. However, as I mentioned in previous days, avoiding shorts and focusing on longs is currently much more in our favor.
❤️ Disclaimer : This analysis is purely based on my personal opinion and I only trade if the stated triggers are activated .
Forecast for BTCUSDT 1st October 2026 (Updated)Forecast for BTC for the next 4 weeks. Continuation to ~$115k-$117k followed by a retrace to ~$106k then continuation up to ~$115k-$117k retest followed by a huge dump to ~$98k-100k then up to new all time high, ~$150k-$170k

Forecast for BTCUSDT 30th September 2026 (Updated)My projection / guess for BTC for the current week. Continuation to ~$115k followed by a retrace to ~$106k then continuation up to ~$120k followed by a huge dump to ~$98k-100k then up to new all time high.

Bitcoin Liquidity GrabBitcoin came back into discount pricing (between the swing low and swing high), and it looks like it is still waiting for the next catalyst for the next leg up.
We are currently still in the weekly imbalance, which a lot of times will act as a demand zone. Before we can take a long position, we need to clear the "bump in the road" — or in this case, liquidity.
I will wait for price to take out the liquidity under the equal lows around 107.2k, and then I’ll wait for a CHoCH on the 1H–4H before looking for a long trade.
Happy trading,

BTC Daily Flow 📊 Current Setup
Bitcoin’s been ridin’ a correction wave after the last push, now chillin’ around the 0.618 fib zone — first pit stop where bulls might grab the board. If that doesn’t hold, no stress — the 0.786 box near 105K is the next heavy support, where the real tide could roll in 🌊.
🚦 Scenarios
🟢 Bounce off 0.618 → short setups for quick plays.
🟦 Deeper dip to 0.786 (~105K) → still bullish long-term, just a fatter correction wave.
🧭 My Take
This drop ain’t no trend flip — it’s not the end of the bull run, just a healthy correction before the next set of waves comes in. Those zones on the chart? That’s where the market could reload for the paddle back up 🏄♂️.
💬 What do you think about this scenario? Only share your idea if you’ve got another opinion — otherwise just hit that button 👍

BTC Trade Plan 27/09/2025-Where to Buy BTC !!!! Dear Traders,
📊 Bitcoin (BTC) Technical Analysis
BTC is currently trading around 109,000 and remains under bearish pressure within a corrective channel. Price is approaching the major support zone (103,000–101,000), which also aligns with the long-term ascending trendline.
🔻 If the price reaches this area and holds, we could see a strong bullish rebound and continuation of the long-term uptrend.
⚠️ But if Bitcoin breaks down with a daily close below this support, further decline toward 95,000–92,000 would be likely.
🟢 Key Support: 101,000 – 103,000
🔴 Key Resistance: 112,000 – 115,000
💡 The upcoming move into the support zone will be crucial in shaping Bitcoin’s mid-term trend.
Regards,
Alireza!

BTC 25.09.25I'm looking for an accumulation in this area to turn the distribution from last week into a bigger one that takes out the extreme liquidity. BTC already had an accumulation here that hit it's target, distributed and deviated the low again. If this is intended to be a bigger accumulation it will need more time to develop. I'm waiting for model 2 POI's to get created and confirmation/invalidations of this idea. Confluence via USDT.D would be nice.

BTCUSD NEXT POSSIBLE MOVEBitcoin has shown a strong bullish push recently and is now facing resistance at the top. From here, one of the key possible scenarios is a rejection leading to a corrective move toward the lower support zone.
If sellers gain momentum at this level, the market could shift into a downward move, testing important demand areas. However, if buyers continue to hold strength, the uptrend could sustain longer before any major pullback.
Market is currently at a crucial point — watch closely for confirmation before entering. Both directions hold potential, but probability favors a short-term correction unless strong bullish pressure breaks through resistance.

BTC/USDT Update
📊 BTC/USDT Update
⚔️ This level is the battle line between Bulls 🐂 and Bears 🐻.
✅ Bullish as long as price holds above support.
❌ If this support breaks, expect BTC to dive below $90K 📉.
🔎 Stay alert — this zone will decide the next big move 🚀.

btc shortWe had a 4H buy-side sweep above 118.1k followed by rejection. This confirmed the short idea from earlier.
What Happened:
Price ran external liquidity above the 4H high (118.1k).
Immediate rejection → confirmed it was a liquidity grab, not continuation.
A Fair Value Gap (FVG) formed on the 15m during the rejection. Price traded back into it and respected it, offering optimal short entry.
Now we’re breaking lower, with sell-side liquidity levels in sight.
Current View:
Structure: Bearish on 15m after sweep + BOS (Break of Structure).
Order Flow: Premium short entry confirmed with FVG mitigation.
Bias: Looking for price to seek lower inefficiencies and equal lows.
Targets Ahead:
🥇 116.8k → first liquidity pool (just got tagged).
🥈 115.8k → inefficiency fill.
🥉 115.5k → deeper liquidity run.
Invalidation:
If BTC reclaims 118.2k, the bearish thesis is invalid.
⚡This is textbook ICT: 4H BSL sweep → M15 market structure shift → FVG entry → downside targets.

[SeoVereign] BITCOIN BEARISH Outlook – October, 03 2025The core basis for presenting a bearish perspective in this idea consists of two main points.
First, within the Double Zigzag pattern, each zigzag forms a 1:1 length ratio.
WAVE.Y1=WAVE.Z1
For easier identification, I have illustrated this section in the chart below.
The second is ZIF.
ZIF (Zone of Interpretive Freedom) is a concept I devised myself, and it refers to the price range between the 1.0 ratio and the 1.414 ratio when Fibonacci retracement is drawn.
This range serves as a critical zone for determining the validity of the idea, and as long as the range is not breached, the strategy is considered to remain valid. Also, the closing basis of ZIF is the daily candle’s closing price.
Simply moving outside of ZIF does not immediately invalidate the perspective.
Although the high of September 18 has been broken upward as of the current point in time, I regard this upward breakout as a false breakout (whipsaw).
The reason is that leading altcoins are moving sideways, failing to follow Bitcoin’s movement, and are showing declining momentum.
Accordingly, the average target price is set around 112.970 USDT.
Additional briefings will be continuously updated to this idea as the chart develops.

BtcusdtThey just trapped the last late greedy bulls . Haven’t seen the OBV this bad last time it was this bad btc couldn’t keep going up and crashed 17% I will bought sbit the btc inverse down 5% already I would probably close it at 118k but I doubt it will go that high . just my thoughts
