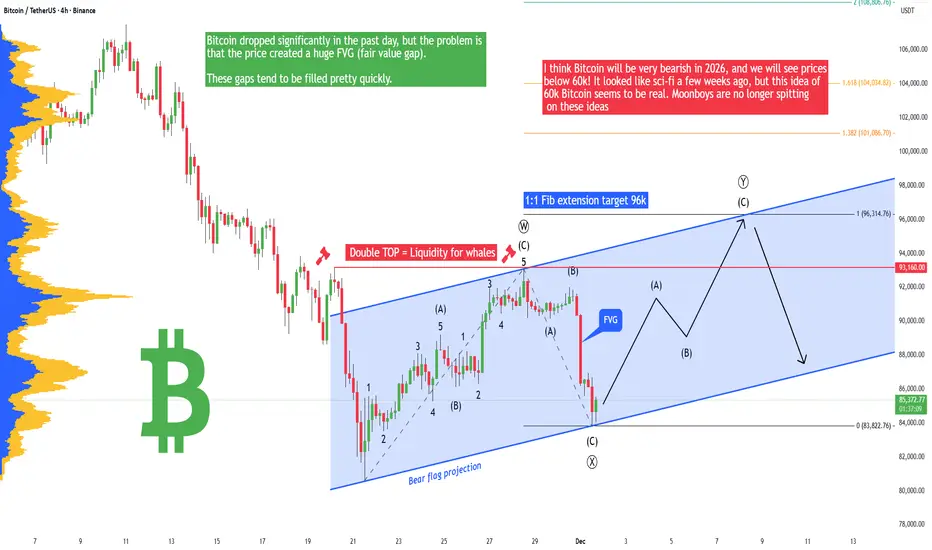
Bitcoin - Fake drop! Soon return to 96k (December PUMP!)Bitcoin has dropped like crazy in the past day because we are in a strong bear market, but I think we should see a December rally! I have been warning you against these big crashes pretty much since Summer 2025. I knew it was going to happen - the question was not if but when.
The price created a huge FVG, and this gap is very unfilled. Pretty much it looks like a huge manipulation from big players (they sent the price down significantly to liquidate high-leverage traders on futures). You know that the Bitcoin market is completely manipulated by the Fed, banks, and huge institutions. They even have a roadmap, and they know what the price of Bitcoin will be in 2030 and 2040. I know everyone hates the Fed and banks, but this is how it is. We trade it, so you have to be able to predict their movements and trade with their plan.
I think Bitcoin will be very bearish in 2026, and we will see prices below 60k! It looked like sci-fi a few weeks ago, but this idea of 60k Bitcoin seems to be real. Moonboys are no longer spitting on these ideas, and some people are calling for 30k or 40k Bitcoin. Let me know in the comment section your prediction. I am curious! You have to understand that there is a lot of manipulation going on in this world. We live in a physical world that has been created recently. The original astral world is where the magic happens. And yes, the physical world is a scam and fraud. The sooner you understand that after you're dead, you wake up in the original astral world, the better for you.
Currently, I am pretty bullish, I think we will see a bullish rally sooner rather than later!
Write a comment with your altcoin + hit the like button, and I will make an analysis for you in response. Trading is not hard if you have a good coach! This is not a trade setup, as there is no stop-loss or profit target. I share my trades privately. Thank you, and I wish you successful trades!
Trade ideas
Bitcoin - Sell this upcoming pump! New Bear Flag - Target 74k!I am currently bullish on Bitcoin in the short term, and I believe Bitcoin will hit 96k, probably this week. The current price is around 91k, so this is definitely a good opportunity to sell or open a short position at 96k on futures because later this month/in January Bitcoin will most likely continue in a downtrend and hit 74k!
74k (74,508) is a significant swing low from April 2024. There is no doubt that a lot of retail traders have their stop losses placed exactly below this swing low. This acts like a strong magnet for huge institutions, hedge funds, and big banks (market makers). It's no longer a secret that Bitcoin's development and Bitcoin's price are completely controlled by these lizards. But let's take a look at the short-term prediction.
What we can see on the daily chart or on the 12h chart is a bear flag formation. This bear flag is so nice and almost textbook perfect! Inside the bear flag we have a WXY corrective pattern (3x ABC or 3x WXY). I think that this is a strong indication that the downtrend we see from the all-time high (126k) will likely continue in the next weeks.
Write a comment with your altcoin + hit the like button, and I will make an analysis for you in response. Trading is not hard if you have a good coach! This is not a trade setup, as there is no stop-loss or profit target. I share my trades privately. Thank you, and I wish you successful trades!

When Alt Season. Is it even happening ever again?This will be very short. Forget Alts season, it's not happening again here is why. No Lambo.
Social media Crypto gurus calling and hypes random coins every day. People are still hoping their precious alt coin will pump and make them a fortune. this is how looks all influencers accounts.
They are Calling Alt seasons every day since 2023. Did they even held some BTC ?
Back in the days in the bull run you could buy any Alt, next day it was 30% up than 100% and 300% and more in few weeks. You could literally buy anything and it went up.
But these times are gone. Game has changed and played changed.
📌 Number of coins
2017: ~1,300 coins → altseason
2021: ~9,800 coins → altseason
2025: 25,000+ coins + thousands of memes → NO ALTSEASON, only isolated pumps
When there are 25x more coins than in 2017, the same amount of liquidity gets diluted.
Altseason today = micro-seasons inside specific narratives, not a giant synchronized run.
Which is difficult to predict and you will not make it just by making technical analysis, you must pick the right one in the sea of coins. It's literally like buying a lottery ticket.
📌 The players has changed
Altseason used to be simple: money flowed into Bitcoin → profits rotated into large caps → then mid caps → then low caps → and everything exploded together. That era is gone.
📌 No more big money Rotations
Bitcoin buyers are now institutional- Blackrock , Fidelity, Vanguard and other ETFs...
Their clients are not here to sell at some point to rotate to some other Sh...coin.
Saylor is not gonna rotate in to some Sh...coins.
Yes, many people will run this playbook and influencers calling for this even every day since 2023. While it was one bitcoin show. Nothing else. Some promises of the future technology, new financial systems, faster than BTC... Its all BS...It's all small money spread to the sea of thousands and thousands of new coins created daily on Solana. It will not be enough to create such a parabolic moves as Alt season used to be.
📌 Individual pumps
It will be some individual coins pumping out of nowhere which you dont have a chance to predict Like ZEC recently. Of course some of you could argue that you been in this trade. I congratulate you if you did. But you will nor repeat this consistently on next 10 coins and most of people didn't catch this rather they did FOMO buy on the top and they are now 60% down, their investment will not turn in to hope and pray, While this was clean pump and dump and it will slowly die.
📌 Whats gonna happen next?
Lets have a look to the history top 10 coins in 2017. As you can see most of coins are not here anymore or they are simply not performing. They been just used for pump and dump and then slowly died. This is how most of the coins will end. and we can see it already here.Most coins never went above 2021 highs. Imagine holding Cardano
It has never seen ATH since 2021. Whats the chances it will pump when there is new better coins narratives again? This is basically how all alt coins looks like and they will end like most of them in 2017.
📌 Are we in bear markets?
is the BTC top in ? I think so and we will might see 45K as I predicted if you are in the alts is bad news for you, they will go much deeper and most of them will never recover after this shock. If you are Bitcoiner this is godsend. You can accumulate more sats. Because at some point BTC will see a new ATH again and again.
📌 Purpose of the Alts
VC are creating the coins, keeping the 70% of the supply. Makes a story around the coin launch it, advertise via big X influencers to pump by naive investors and then they are dumping it to them. It still repeats over and over.
Dont play this game anymore. New alts, narratives comes every-time, they come and disappear. I got you , your plan is to buy BTC, but first you want to make more money on Alts or meme so you got more BTC , but NO it's not gonna happen. You will only loose money and have less BTC in the end.
Wouldn't you be doing better if you just buying BTC and hold?
I wish you all success in the Crypto investing.
David Perk

Get Funded and make $20 000 Monthly. Complete plan for 2026.Hey traders let's have a look at prop trading again. It's a great opportunity for the skilled traders who has good strategy, discipline and mastered risk management. Let's start with the numbers which many traders and misunderstood.
📌 Prop firm facts
- $100K account with 10% max drawdown means you got $10K account, not $100K
- Goal of 10% to pass phase 1 while you can risk 10% means 100% gain
- Goal of 5% to pass Phase 2 while you can risk 10% adds another 50% gain.
- You will literally be funded after making 150% not 10% and 5%
⁉️ Does it mean it's impossible to get funded ?
Yes it's possible, next to good strategy you need, discipline and mainly you just need to adjust your risk management. If you make 150% in year as a Hedge fund manager you will be a superstar trader. Yet people still want to pass prop challenge in a less than week or in a few trades which means not sticking to the risk management.
🔗 Click to the picture below to Learn more about Prop Risk management 📌 How to make $20 000 a month ? Magic of 3%
Yes, you actually need to make only a 3% a month. Is it difficult ? No, It's not. You need 3 wins with 1:2 RR while risking 0.5% Risk.
1️⃣Your Ultimate goal - -$100K Funded account - 3% Gain - 80% Profit split = $2400 Payout
2️⃣Let's take it to $20 000 a Month
Don't try to increase your % gains per month, increase your capital under management
- Get another 4 x $ 100K Challenges pass them - You will have $500K AUM:
- $ 500 000 - 3% Gain - 80% Profit split = $12 000
3️⃣Reinvest buy another 3 - 5 challenges aim for $ 1000 000 funded across few solid props firms. 🎯 $ 1000 000 - 3% gain - 80% Profit Split = $24 000 Payout
📌 Have a long term plan
this is not gonna happen in few months. It's a year plan - But you got this... 💪
With approximate cost of $500 - $600 per $100K challenge you will need to spend apron. $5500 to get $1000 000 funding. You will fail some, its unavoidable, so let's count with more might $10K. But still , you can start with first $100K an then reinvest to another challenges. You dont need $10K investment right now. But later this $10K and 3% gain and 80% profit split is $24 000, even more then $20K.
📌 Difficulty is not technical, but in patience
I speak from experiences that my biggest mistakes was trying to pass quickly or when I was in drawdown I started to gamble. Be patient and stick to the rules. If we stick to 3% a month without progressive risk management it would be 4 months to get funded. If you do progressive risk management you can do it faster, and once you are confident you can run multiple challenges at the same time.
📌 Long term plan requires perfect planning
Find 60 minutes just for yourself and this about these questions below, write the answers to to the paper, think about the execution of your project. I know you didn't do it now, but come back to this and do it again. You need to visualize your future successful yourself and remind that visualization every day. I recommend a book - Psycho-cybernetics from Maxwell Maltz it will help you define your self-image of successful trader in the fact this book will change your life.
📌 Essential Rules for Prop Trading
-Its not a straight forward game
-Reduce number of trades - Only A+ Setups
- Grow Your Capital Under management in multiple firms not % gains
- 3% is a golden profit in prop space to live from trading
❌ Dont do this
If you don't trade well on small account, getting prop firm will not change it.
Don't expect it to be a solution to bad financial situation. It's extension. 🧪 Trading is not hard we often overcomplicate it
I believe you already few great trades in a month, but you also have many unnecessary ones, look at your last few month results and check if would be able to make 3% if you excluded those unnecessary trades. I sure you could ant thats what you have to do
Switch from machine gunner to a Sniper.
Write this on a paper and put it somewhere so you see it every day.
🎯 $ 1000 000 - 3% gain - 80% Profit Split = $24 000 Payout
🎯 $ 1000 000 - 3% gain - 80% Profit Split = $24 000 Payout
🎯 $ 1000 000 - 3% gain - 80% Profit Split = $24 000 Payout
$1000 000 Funding !! - Your ultimate goal for 2026 💪
I promised myself I’d become the person I once needed the most as a beginner. Below are links to a powerful lessons I shared on Tradingview. Hope it can help you avoid years of trial and error I went thru.
📊 Sharpen your trading Strategy
⚙️ 100% Mechanical System - Complete Strategy
🔁 Daily Bias – Continuation
🔄 Daily Bias – Reversal
🧱 Key Level – Order Block
📉 How to Buy Lows and Sell Highs
🎯 Dealing Range – Enter on pullbacks
💧 Liquidity – Basics to understand
🕒 Timeframe Alignments
🚫 Market Narratives – Avoid traps
🐢 Turtle Soup Master – High reward method
🧘 How to stop overcomplicating trading
🕰️ Day Trading Cheat Code – Sessions
🇬🇧 London Session Trading
🔍 SMT Divergence – Secret Smart Money signal
📐 Standard Deviations – Predict future targets
🎣 Stop Hunt Trading
🧠 Level Up your Mindset
🛕 Monk Mode – Transition from 9–5 to full-time trading
⚠️ Trading Enemies – Habits that destroy success
🔄 Trader’s Routine – Build discipline daily
🛡️ Risk Management
🏦 Risk Management for Prop Trading
📏 Risk in % or Fixed Position Size
🔐 Risk Per Trade – Keep consistency
The One Pattern Every Trader Misses!Most traders focus on flags, wedges, double tops, fibs…
But there’s a pattern far more powerful, and almost no one talks about it:
-- The Behavior Pattern. --
📈It’s not drawn on your chart. You can’t code it into an indicator.
But it determines your success more than any formation.
Here’s the pattern professionals watch, and beginners ignore:
1️⃣ Impulsive Behavior
When price moves fast, traders move even faster.
FOMO kicks in. Chasing begins. Risk is forgotten.
Professional interpretation:
➡️ If emotions are impulsive, structure won’t be respected.
Avoid trading in emotional markets unless you already have a plan.
2️⃣ Hesitation Behavior
Price reaches your level. Your alert triggers.
Everything lines up… and you still don’t enter.
Why?
Because hesitation is a sign your risk is unclear.
Professional interpretation:
➡️ If hesitation appears, your plan isn’t ready.
The chart is never the problem, the plan is.
3️⃣ Revenge Behavior
One loss turns into five.
You stop trading the chart and start trading your frustration.
Professional interpretation:
➡️ If frustration is present, you’re trading without structure.
Step away. Market will be here tomorrow.
Why This Matters ⁉️
The market doesn’t punish bad trades. It punishes bad behavior.
Your biggest losing streaks didn’t come from your strategy.
They came from emotional patterns you didn’t recognize in real time.
Once you learn to see these behavior patterns, your charts become clearer, your decisions simpler, and your risk finally makes sense.
🧠Final Thought
Chart patterns tell you where the market might go.
Behavior patterns tell you whether you’ll survive long enough to get there.
Master both; and you’ll trade with the clarity most people never reach.
⚠️ Disclaimer: This is not financial advice. Always do your own research and manage risk properly.
📚 Stick to your trading plan regarding entries, risk, and management.
Good luck! 🍀
All Strategies Are Good; If Managed Properly!
~Richard Nasr
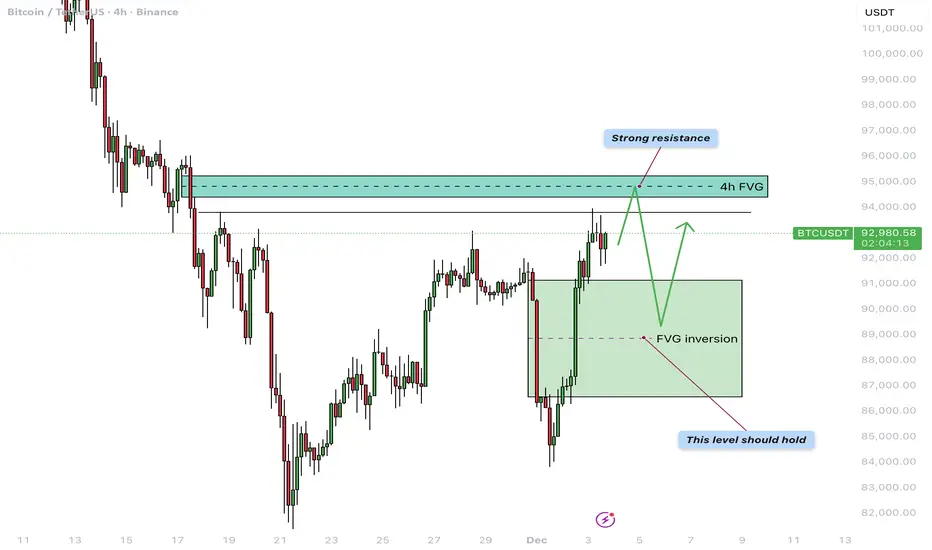
Bitcoin - $95.000 before a correction?Bitcoin finds itself at an important turning point once again after a sharp decline followed by a strong recovery. In this update, we will cover the reaction to the previous 4H bearish FVG, the newly formed 4H FVG inversion acting as support, the next resistance level around 95,000 dollars, and the recent liquidity sweep.
4H Bearish FVG Inversion
Two days ago, BTC made a strong downward move that reversed a large part of the earlier rally and collected deep liquidity beneath local lows. During this drop, a clear 4H bearish FVG was formed, acting as a supply zone. Yesterday, however, BTC reclaimed this entire FVG with conviction: the price broke through it and closed multiple candles above the zone. This shift flips the area from supply into demand, meaning the former bearish FVG has now transformed into a 4H FVG inversion. The green box on the chart now represents the primary support zone, ideally holding during any pullback.
4H Bearish FVG Around $95,000
Above the current price lies the next 4H bearish FVG around roughly 95,000 dollars, aligning with a previous consolidation and distribution phase. This region acts as strong resistance and is the next logical magnet for the ongoing recovery move. As long as the FVG inversion beneath price holds, it is reasonable to expect BTC to gradually move toward the 95k area. A clear reaction is likely once this zone is reached—ranging from a brief rejection and sideways consolidation to a potentially larger reversal if sellers become aggressive again.
Liquidity Sweep
Recently, BTC briefly pushed above a local high and pulled back immediately afterward, creating a clear liquidity sweep on the chart. This move wiped out the stops of late shorts as well as breakout longs but did not yet lead to immediate continuation to the upside. After such a sweep, the question becomes whether the market can gather enough buyers to fuel the next impulse toward the higher FVG, or whether price will first drop back toward the inversion support to gather liquidity there. The reaction at current levels will therefore provide important insight into short-term direction.
Conclusion
Because of today’s liquidity sweep, a direct correction from the current price is very possible, especially if short-term traders take profit after the strong bounce. However, the base scenario remains that BTC could still make one more push upward toward the 4H bearish FVG around 95,000 dollars, where a more significant reaction is expected. Such a move would fit perfectly within a structure where resistance is tested first, followed by a pullback to retest the new inversion support—confirming whether the recent reversal has real strength behind it.
-------------------------
Thanks for your support. If you enjoyed this analysis, make sure to follow me so you don't miss the next one. And if you found it helpful, feel free to drop a like 👍 and leave a comment 💬, I’d love to hear your thoughts!
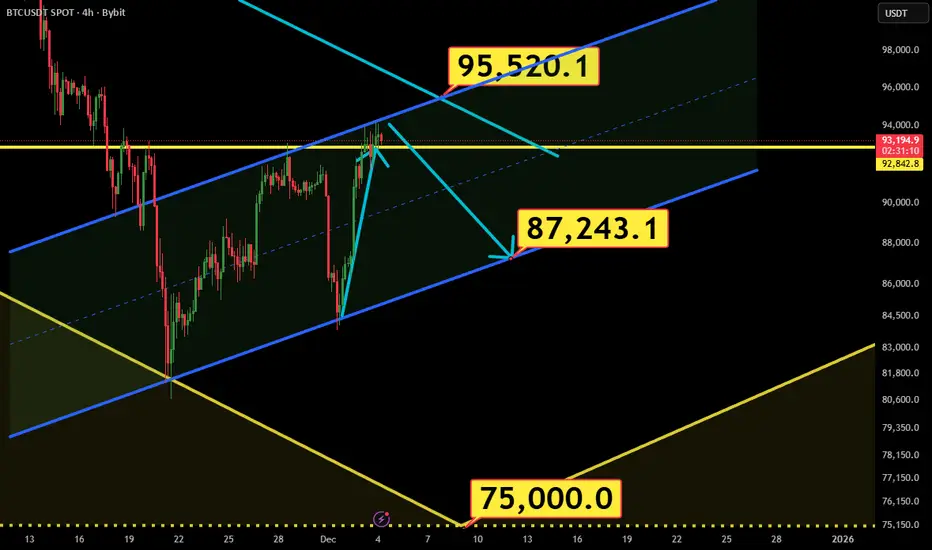
Not ready yet!If Bitcoin fails to secure a 12-hour close above 95,000, a corrective move toward 87,000 and even 75,000 remains on the table. However, one way or another, the market structure is ultimately poised to break upward toward 108,000.
The Trade You Don’t Take!Most traders focus on entries, strategies, indicators, patterns…
But the truth is: your biggest edge is avoiding low-quality trades.
The market rewards patience far more than prediction.
Here’s the framework professional traders use to filter noise from opportunity, something 90% of traders overlook:
1. The Market Must Be Aligned
Before placing any trade, ask one question:
“Is the market trending, ranging, or correcting?”
Your strategy only works in the right environment.
A breakout strategy fails in a choppy range. A mean-reversion setup dies in a strong trend.
Identify the environment first, then choose the setup.
2. Your Levels Must Be Significant
True opportunity comes from reaction points, not random prices.
Look for:
- Major swing highs and lows
- Weekly or monthly levels
- Clean trendlines with multiple touches
- Areas where price previously paused, reversed, or consolidated
If the market isn’t near one of these levels, you’re trading in the middle, where noise lives.
3. Your Risk Must Make Sense
A good setup with a bad risk-to-reward is a bad trade.
Professionals only act when:
- The stop-loss is logical (protected behind structure)
- The target is realistic
- The reward outweighs the risk
If the math doesn’t work, the trade doesn’t happen.
🧠 The Hidden Lesson
Great traders don’t trade more, they filter more.
Your account grows not by finding better entries,
but by avoiding the trades that drain your capital, energy, and confidence.
Master the art of waiting, and your strategy will finally start working the way it was designed to.
⚠️ Disclaimer: This is not financial advice. Always do your own research and manage risk properly.
📚 Stick to your trading plan regarding entries, risk, and management.
Good luck! 🍀
All Strategies Are Good; If Managed Properly!
~Richard Nasr

BTC : REVERSAL or FAKEOUT ?? Hello Bitcoin Watchers 📈
BTC is looking promising with a price recovery towards the upside, currently trading just over $90k.
📢But let's not forget, a higher high was observed here as well.
A further -30% drop followed after this pullback to the upside:
If we have to follow a similar trend, over the next two months we could end up at around $65K:
Conclusion - I'm leaning towards more drop to follow after a period of sideways trading here. We could see this zone hold for two or three weeks up until after Xmas, at which point longs could be liquidated again if the optimism goes too high.
If you've been following my previous BTC updates, you would have seen that it's not uncommon for the price to recover to the basis of the Bollinger bands, or mid-level moving average. And the only way that can be considered a reversal, is if the WEEKLY starts closing above the 50day moving average, which we are no where near close to seeing.
BINANCE:BTCUSDT

When to Trade — When to Stay OutWhen to Trade — When to Stay Out: A Deep, Practical Guide for Traders
Timing is a core edge. Not every hour, session, or chart condition is trade-worthy. The difference between a profitable trader and an active losing trader is not how many trades they take — it’s which trades they take and when. This article gives you a detailed, systematic framework to decide when to trade and when to stay out, with concrete rules, time windows, checklists and worked examples.
Big-picture logic
Markets are driven by liquidity (where orders sit), volatility (how fast price moves) and participants (who is trading). Good timing aligns these three:
Liquidity concentration (institutions, marketmakers) produces cleaner, higher-probability moves.
Right volatility means enough movement to reach targets but not so much that stop losses are random.
Recognizable market structure (trends, ranges, breaks) allows rules to be applied consistently.
If any of the three is missing, edge declines and risk of random losses rises.
Session windows — when the market is most tradable
Below are standard session definitions in UTC+00:00. Adjust for daylight savings if required (noted where relevant).
Tokyo / Asian Session
⏵ UTC+00:00: 23:00 – 08:00 ( main liquidity often 23:00–02:00 UTC )
⏵ Characteristic: lower liquidity for major FX pairs, choppier price action. Exceptions: JPY crosses, pairs with Asia-led liquidity, and crypto (24/7).
London Session
⏵ UTC+00:00: 07:00 – 16:00 (most active 08:00–11:00 UTC)
⏵ Characteristic: heavy institutional flow, high liquidity. Many clear directional moves begin here.
New York Session
⏵ UTC+00:00: 12:00 – 21:00 (most active 13:00–16:00 UTC)
⏵ Characteristic: continuation or reversal of London moves; major news releases occur here.
Key overlap (best single window)
⏵ London–New York overlap: UTC+00:00 ~12:00–16:00. Highest combined liquidity and volatility; most “clean” trends and reliable breakouts occur here.
Rule of thumb: Prefer intraday trades during the London session and the London–New York overlap. Be selective in Asia unless trading JPY pairs or range-break strategies designed for low liquidity.
Concrete: Best times to trade (prioritized)
Session open impulse — first 60–120 minutes of London or New York sessions.
Overlap window — London + New York overlap (UTC+00:00 ~12:00–16:00).
Post-news verified moves — 10–30 minutes after high-impact macro prints, if market structure becomes clear and isn’t just noise.
Clear breakouts after consolidation during active sessions (volume confirmation, sweep of liquidity, not just a one-bar spike).
When to avoid trading (and why)
Low-volume Asian hours for majors — price tends to chop and give false signals.
Right before major macro releases (NFP, CPI, FOMC) — price can gap or spike unpredictably. Exceptions: defined volatility playbook with strict hedges.
Midday lulls after initial session impulse — often flat ranges and low edge.
On unclear structure / messy price action — wide, overlapping candles, no clear swing highs/lows.
During market holidays or early close days — liquidity is thin; spreads widen.
Pre-trade checklist
Time window OK? (London / NY open or high liquidity event)
Major news? (No significant release within ±30 mins)
Higher timeframe structure clear? (H4 or Daily trend / range)
Trade idea defined (entry, stop, target) — use price levels, not indicators only.
Risk per trade ≤ planned % of account (see position sizing).
Reward : Risk ≥ your minimum (e.g., 1.5–3:1 depending on edge).
Catastrophic stop capability confirmed (can you absorb worst-case slippage?)
Exit rules set (profit-taking scale or full exit)
Trade logged in journal immediately after (reason, setup, time, bias)
Position sizing — exact worked example (step-by-step)
Use a fixed % of equity for risk per trade (commonly 0.5%–2%). Example uses 1% risk.
Assume:
Account size = $10,000.
Risk per trade = 1% of account = $10,000 × 0.01.
We compute digit-by-digit: 10,000 × 0.01 = 100. So maximum $100 risk on this trade.
Generic position-size formula:
Position size (units) = (Account Size × Risk%) ÷ (Stop Distance in price units × Value per price unit per 1 unit)
Always recalc pip/value for cross rates and for instruments (stocks, futures, crypto) — adapt the “value per price unit” accordingly.
Money Management is much more important than a strategy. You should learn Money Management before trying any strategy.
Order types & execution rules
Limit entries at confluence levels (support/resistance + liquidity sweep zone) — better price and less slippage.
Stop orders for breakout entries — use when you want to enter only after momentum confirms.
OCO (One Cancels Other) for scaling / invalidation management — reduces manual errors.
Avoid market entries during major news due to slippage/gap risk, unless your plan accounts for it.
Trade management & exits
Initial target: defined by structure (previous swing, ATR multiples, measured moves).
Scale out: consider taking partial profits at the first reasonable target, let the rest run with a trailing stop.
Stop relocation: only move stop to breakeven after a predefined profit multiple reached (e.g., after +1R or after price clears a new structure). Don’t move stops based on emotion.
If price returns and breaks your entry zone invalidating the setup, exit — the market changed.
Strategy-specific timing tweaks
Trend-following: prefer strong sessions (London/NY) and avoid Asian low-liquidity hours. Enter on retracements that align with higher timeframe trend.
Range / mean-reversion: worst during session opens; best during mid-session lulls, but only if volatility is low and boundaries are clear.
Breakout strategies: require confirmation — e.g., breakout during overlap or accompanied by increased volume / volatility. Avoid breakouts in thin Asian hours.
News scalping: high risk; only for experienced traders with defined entry, strict spread/latency controls, and capital to absorb spikes.
Common mistakes (and how to fix them)
Trading outside your chosen time windows — fix: enforce a trading clock.
Overtrading in chop — fix: increase minimum R:R and wait for clear structure.
Ignoring spreads and liquidity — fix: include spread in stop/target math and avoid thin sessions.
Moving stops prematurely — fix: use rules (e.g., only move after +1R).
Trading news impulsively — fix: have a news plan: either avoid or have a predefined volatility playbook.
Emotional trading (e.g. not closing the position when the price hits stop-loss)
Psychological & routine rules
Trade only when rested and focused.
Limit screen time to your pre-set sessions.
Keep a journal: reason for trade, outcome, lessons. Review weekly.
Daily routine: pre-market scan 30–60 minutes before your active session, post-session journal entry.
FAQ
Q: Can I trade during Asian hours?
A: Yes — but selectively. Prefer JPY pairs, Asia-centric instruments, or strategies built for low volatility.
Q: What if my timeframe and session disagree?
A: Give priority to higher timeframe structure. If H4 / Daily shows trend, trade during active sessions for better fills.
Q: How much should I risk per trade?
A: Conservative traders use 0.5%–1% per trade. More aggressive ones use up to 2%. The key is consistency and drawdown planning.
Focus your trading during high-liquidity windows (London, New York, and their overlap), avoid low-volume and pre-news periods, always validate trades with liquidity + volatility + clear market structure, use strict risk management (e.g., 1% per trade with position sizing), and follow a pre-trade checklist to avoid low-quality setups. Better timing = better edge.
Enjoy!
Bitcoin Head & Shoulders on 1H is pumping it above 100K$ soonFirst lets take a look at that Attractive Reversal pattern which is now obvious in all tokens:
#Head_Shoulders :
The recent downward movement successfully triggered a significant number of long-position stop losses, effectively executing a 'long squeeze' and absorbing substantial sell-side liquidity. This classic market-clearing event often removes weak hands and over-leveraged positions, thereby reducing immediate overhead resistance.
With this liquidation event concluded, the market structure has notably cleared a key obstacle. The path upward now encounters less selling pressure from previously vulnerable positions. This development supports a bullish technical outlook, with the next primary targets residing at the $100,000 psychological level and beyond, as the new market structure allows for a more sustained advance.
DISCLAIMER: ((trade based on your own decision))
<<press like👍 if you enjoy💚

BTCUSDT: Failed Recovery Opens Path to 87,000 SupportHello everyone, here is my breakdown of the current BTCUSDT setup.
Market Analysis
BTCUSDT is trading inside a broader ascending channel, but the recent price action shows clear signs of weakness near the upper structure. Price previously attempted a breakout above the 90,000 Resistance Zone, however this move turned into a fake breakout, confirming strong seller pressure in that area. After the rejection, the market shifted into a corrective phase and formed a descending triangle structure, defined by the Triangle Support Line and repeated failures near resistance.
Currently, price is consolidating just below the 90,000 resistance, while gradually sliding along the descending support of the triangle. The 87,000 Support Zone remains the key downside buffer where buyers previously stepped in. The overall structure now suggests that bullish momentum is weakening, and sellers are gaining short-term control as long as price remains below the 90,000 resistance level.
My Scenario & Strategy
My scenario is bearish, as long as BTCUSDT stays below the 90,000 Resistance Zone and continues to respect the descending triangle structure. I expect price to attempt another breakdown toward the 87,000 Support Zone, which aligns with the lower channel support and previously active demand area. A clean break below 87,000 would confirm bearish continuation and open the path toward deeper downside targets.
However, if price once again reclaims the 90,000 resistance with strong volume and holding strength, the bearish scenario would be invalidated and a renewed push toward the upper channel could follow. For now, the market supports a short bias, with the main focus on a potential move toward the 87,000 support area.
That’s the setup I’m tracking. Thank you for your attention, and always manage your risk.

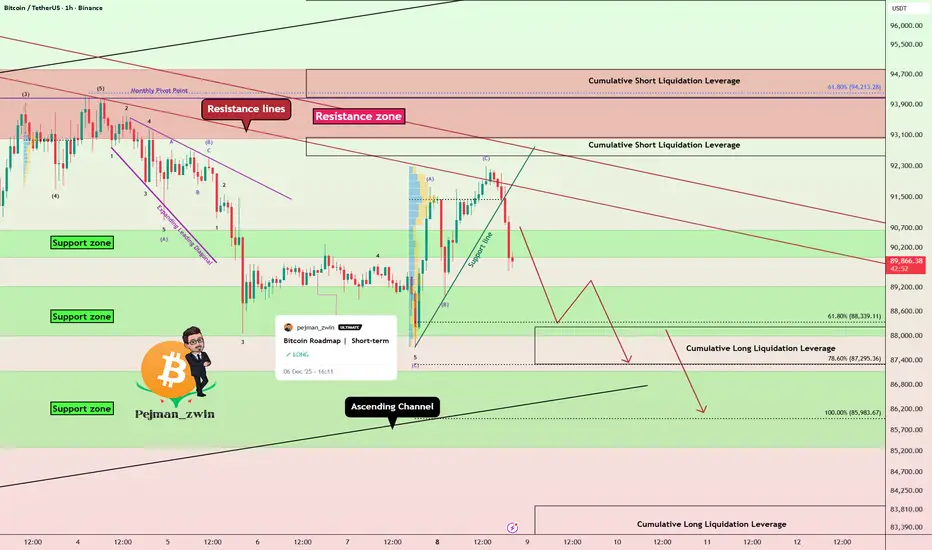
Bitcoin Roadmap | Short-termBitcoin( BINANCE:BTCUSDT ) began to decline from the resistance zone($95,020-$94,840) exactly as expected in my previous idea , successfully reaching all targets.
At the moment, Bitcoin was able to break the support zone($90,650-$90,000). It seems that the pullback to the broken support zone($90,650-$90,000) could be completed with a symmetrical triangle pattern, although given the low trading volume on Saturday and Sunday, this triangle may not function properly.
In terms of Elliott Wave theory, Bitcoin appears to be completing the microwave C of the main wave B, and I expect at least one more impulsive 5-wave move to the upside.
I expect Bitcoin to start rising from the support zone($89,230-$88,000) or the Potential Reversal Zone(PRZ) maximum. A break of the resistance lines could be a good sign for Bitcoin to rise again.
What do you think? Do you believe Bitcoin will dip below $75,000, or will it bounce back?
Cumulative Short Liquidation Leverage: $98,260-$96,690
Cumulative Short Liquidation Leverage: $90,560-$89,990
Cumulative Long Liquidation Leverage: $87,820-$87,290
Cumulative Long Liquidation Leverage: $83,900-$82,400
First Target: $89,911
Second Target: $92,119
Stop Loss(SL): $86,120(Worst)
Points may shift as the market evolves
💡 Please respect each other's opinions and express agreement or disagreement politely.
📌Bitcoin Analysis (BTCUSDT), 1-hour time frame.
🛑 Always set a Stop Loss(SL) for every position you open.
✅ This is just my idea; I’d love to see your thoughts too!
🔥 If you find it helpful, please BOOST this post and share it with your friends.

The F1 Mindset Every Trader Needs!!!Most traders behave like they’re trying to win the race on the first lap.
Full throttle. No patience. And then they wonder why they spin out before the finish line.
🏎 But in Formula 1, especially under the lights of Abu Dhabi, the winners don’t drive the fastest…
They manage the race the smartest.
And trading is no different.
Here are the three F1 lessons every trader should master:
1️⃣You Don’t Win by Being Fast => You Win by Being Controlled
F1 drivers don’t go maximum speed all the time.
They manage tyres, fuel, engine temperature, and track conditions.
In trading, your “tyres” are your capital.
Burn them early with emotional trades, and your race is over.
Consistency beats speed.
Control beats excitement.
2️⃣ Your Strategy Is Your Pit Crew
No F1 driver wins alone, they rely on a team that’s fast, disciplined, and precise.
For traders, your “pit crew” is your:
- trading plan
- risk management
- journaling
- strategy rules
- routines
When your system is aligned, your performance becomes predictable.
When it's sloppy, you get undercut by the market every time.
3️⃣ The Race Is Won on Corners, Not Straights
Every driver can accelerate on the straights.
Champions gain their advantage in the corners — the difficult, technical parts of the track.
In trading, the “corners” are:
- drawdowns
- losing streaks
- choppy markets
- hesitation
- volatility spikes
Anyone can trade a trending market.
True professionals shine in difficult conditions.
🏁 Final Lap Insight
The Abu Dhabi Grand Prix doesn’t reward the loudest driver, it rewards the most disciplined.
Trading is exactly the same.
✔ The market is your circuit.
✔ Your account is your car.
✔ Your rules are your race line.
✔ And your mindset determines whether you finish… or crash out on turn one.
Trade like an F1 driver:
calm, calculated, consistent, and always thinking about the full race, not a single lap.
⚠️ Disclaimer: This is not financial advice. Always do your own research and manage risk properly.
📚 Stick to your trading plan regarding entries, risk, and management.
Good luck! 🍀
All Strategies Are Good; If Managed Properly!
~Richard Nasr

Bitcoin Pumps +10% — Bull Trap or Trend Reversal?Bitcoin( BINANCE:BTCUSDT ) has experienced over a +10% increase in the past two days, which came as a surprise to many analysts considering the previous bearish momentum. In other words, Bitcoin is on something of a roller coaster lately😂.
The question now is whether Bitcoin has started a new bullish trend or if it’s likely to see another decline.
Let’s dive into the 4-hour chart of Bitcoin. Currently, Bitcoin is approaching a resistance zone($94,850-$93,000), a Cumulative Short Liquidation Leverage($94,710-$94,063), and the monthly pivot point. This cluster of resistances, combined with the recent upward momentum, might make it challenging for Bitcoin to break through.
It’s also worth noting that the trading volume during this recent rally hasn’t been particularly high, so Bitcoin could still surprise us. This recent behavior shows that Bitcoin can move sharply both up and down, so it’s crucial to maintain proper risk management.
From an Elliott Wave perspective, considering Bitcoin’s recent decline, I initially expected that Bitcoin might at least test the low of its main wave 3 again. However, the recent rebound suggests that the main wave 5 may be truncated, and the corrective waves could still push Bitcoin lower, potentially even below $75,000.
From a classical technical analysis perspective, Bitcoin might be forming a bearish flag pattern, with the ascending channel acting as the flag’s pole.
In addition, the USDT.D%( CRYPTOCAP:USDT.D ) is still on an upward trend, which indicates that the cryptocurrency market might still face downward pressure.
Moreover, geopolitical tensions, such as those between the U.S. and Venezuela, could also act as a trigger for further Bitcoin declines if they escalate.
Lastly, the S&P 500 index( SP:SPX ), despite its recent bullish trend, doesn’t show the same positive correlation with Bitcoin. In fact, a decline in the S&P 500 could amplify Bitcoin’s downward movement.
Considering all these factors, I expect Bitcoin to continue its bearish trend and potentially test the heavy support zone. If these support levels break, we could see even more significant declines in the crypto market.
Based on the above explanation, I expect Bitcoin to have at least a correction to the targets I specified on the chart, and then depending on the momentum, we can expect a continuation of the decline or a resurgence.
Note: In general, with the opening of the US markets, financial market movements have become more intense these days than before, and it is better to be prepared for any scenario at that time.
What do you think? Do you believe Bitcoin will dip below $75,000, or will it bounce back?
Cumulative Short Liquidation Leverage: $98,591-$96,688
Cumulative Long Liquidation Leverage: $91,860-$90,960
Stop Loss(SL): $96,200
Points may shift as the market evolves
💡 Please respect each other's opinions and express agreement or disagreement politely.
📌Bitcoin Analysis (BTCUSDT), 4-hour time frame.
🛑 Always set a Stop Loss(SL) for every position you open.
✅ This is just my idea; I’d love to see your thoughts too!
🔥 If you find it helpful, please BOOST this post and share it with your friends.

BTC/USDT | $BTC Smashes Back to 94K but The Real Test Is Ahead!CRYPTOCAP:BTC pulled a full reversal after the heavy crash and pushed all the way back to 94K. Right now price is trading around 93K and this entire move basically filled the liquidity void created during the violent dump. For short term traders this is where I prefer staying on the sidelines because premium entries will show up again at lower levels once the market cools down.
For long term traders and holders nothing has changed. The bullish structure is still alive and if Bitcoin can break above 97K the next upside leg can easily extend toward 105K and even 106K. I will update the view again once we see how price behaves around the 97K zone.
Please support me with your likes and comments to motivate me to share more analysis with you and share your opinion about the possible trend of this chart with me !
Best Regards , Arman Shaban

BTCUSDT Long: Demand Line Holds — Path Toward 96,500 Opens UpHello, traders! BTCUSDT is respecting the Triangle Demand Line after completing a full bearish cycle inside the descending channel earlier. Sellers maintained control for an extended period, pushing price steadily lower until it reached the pivot point near 88,800, where buyers finally stepped in and broke the bearish structure. This pivot zone became the foundation for a new bullish sequence, with price forming higher lows along the Triangle Demand Line. After the breakout from the descending channel, BTCUSDT entered a consolidation Range, where multiple fake breakouts occurred on both sides. This range acted as a transition phase before buyers regained momentum. Following the range, price made another bullish attempt, but faced resistance near the 96,500 Supply Zone — an area where sellers have shown strong activity in the past.
Currently, BTCUSDT is moving toward the Triangle Demand Line once again, retesting it as support. As long as buyers defend this trendline and price remains above the Demand Zone at 88,800, the bullish structure stays intact.
My scenario: if the trendline holds, BTCUSDT may bounce and continue moving toward the 96,500 resistance, which remains the main upside target for the current bullish leg. A clean breakout above 96,500 would open the path for stronger continuation. However, if price fails to hold the demand line, a corrective pullback toward the lower demand region becomes possible. For now, the market structure remains bullish while price respects the Triangle Demand Line. Manage your risk!

Premium vs Discount Zones: Where Smart Money PositionsPrice doesn’t move in a straight line. It oscillates within swings, creating areas where buying or selling becomes more favourable.
Understanding premium and discount zones is how professionals identify where the market offers opportunity and where it carries unnecessary risk. It is a simple framework, but it shifts your mindset from chasing movement to positioning with intention.
Every significant swing in price has two halves. The upper half of a swing is the premium zone; the lower half is the discount zone. Premium is where smart money distributes or looks for short exposure. Discount is where accumulation and long positioning become attractive.
These zones reflect nothing more than logic: buy lower than average, sell higher than average.
To identify these areas, start by marking a clear swing high and swing low. The midpoint between them creates an equilibrium.
Above that midpoint, the market trades at premium; below it, at discount. This doesn’t guarantee reversal points, but it provides structure for understanding where traders with size can enter with reduced risk.
In an uptrend, the goal is to position within discount zones.
Buying in premium exposes you to deeper retracements, failed impulses, and weaker continuation. Discount buying aligns you with the dominant direction while keeping your risk defined.
In downtrends, the logic reverses: premium becomes the ideal zone to sell into, not chase.
What elevates this concept is combining it with liquidity and structure. A discount zone with a strong higher low carries far more weight than discount alone. A premium zone paired with equal highs or a liquidity sweep becomes a cleaner short.
These layers create clarity on where the market is likely to react, rather than relying on individual candles.
Premium and discount zones also prevent emotional trading. When price is in premium during an uptrend, the temptation to chase a breakout is high. The framework reminds you that continuation is less probable and patience often pays.
When price enters discount, the market offers a logical window to build positions without relying on prediction.

5 Key Trading Tips for BeginnersWelcome back everyone to another post! In this article we will be explaining 5 key pointers (tips) for new individuals entering the trading space.
When it comes to trading first there is “ understanding ” before we begin the 5 keys steps. Let me assist you in understanding what will happen when you take on trading.
Trading is a challenge. Not a video game challenge, not a math test challenge – a * Challenge * One that will break you. Trading will break you mentally, physically, spiritually and financially. It is an eye-opening journey.
Trading will teach you a lot about yourself, and it will teach you a lot about discipline, patience and how you can analyze markets.
I saw a quote somewhere, it said trading: “ Trading is the hardest way, to make easy money ” and they are right.
You will be learning how to manage risk, control your emotions, understand your own decision-making patterns. These are all invaluable lessons for life, as well as trading.
Sounds great! But then there are the losses, what you lose to gain all this. Trading isn’t something that you can learn overnight – all those posts you see about a young 17-year-old “ cracking the code ” is rubbish. Why? Because they haven’t learnt life lessons.
You can make money fast, but you will lose it faster if you don’t know how to manage it.
Trading will drain every bit of energy out of you. You will feel like you’re falling behind, you will eventually collapse at every loss and become frustrated. The market will test you; the market doesn’t give a damn about you – you accept the risk when you take on trading and since you’re the one making the trades, it’s you VS you.
You’re testing yourself. You agree to test your patience, your confidence, your mindset. Doing so will make progress feel nonexistent or slow.
Every day, and every trade you will question yourself, wondering if “trading” is even for you. Sometimes it will feel like you’re going in circles. You will continue to make mistakes repeatedly. It will become exhausting but remember – only experience and your own strengths will allow you to succeed. Only those who can endure the grind without giving up will make it.
So, let’s start off the 5 key pointers that will prepare you.
1) Prioritize Risk Management Over Profits:
Most newbies focus first on “ making money ” rather than safeguarding capital. The reality is that surviving in the market is way more important than winning every trade you see or come across.
Key Points:
Determine risk per trade: A common rule is risking no more than 1-2% of your trading account on a single trade. This way even a string of losses will not wipe you out.
Always use stoploss: A defined maximum loss per trade enforces discipline and emotions to stay in check.
Position sizing: Your sizing should be proportional to what you’re willing to lose on each trade. Bigger trades amplify the losses, but they also amplify the profits.
Why it matters:
Without strong risk management, even a high win-rate strategy can fail. Protecting capital ensures you’re still in the game when opportunities arise.
2) Develop a trading plan and stick to it .
Random reactive trading is the best way to lose money. Build your plan overtime.
Key points:
Define your strategy: Building your strategy is the longest part, constant back testing and forward testing, refining and rebuilding. You’re not “switching” your strategy if you’re adding something small to it, you’re changing it if you eliminate the whole thing.
Identify your form of trades, short, mid, long term or swing trades.
Set clear rules: Don’t leave anything to chance, for example “I only enter trades if price closes above the 50ema and RSI is above 50”
Journalling trades: Ensure to journal all your trades, “How do I journal” Easy. Record the time, date, symbol, pair, what model/system you used, images, your entry, tp and exit, why and for how long you’ll have it open.
Why it matters:
Consistency is a key, it pairs with discipline, psychology and lingers with risk management. Traders who follow a disciplined system perform better than those to trade off an impulsive feeling. Other words “Gamble”
3) Master one market and one system first:
Beginners usually spread themselves too thin, trying forex, crypto, stocks and commodities all at once – Unfortunately for me I made this mistake at the start which made it very difficult! – Don’t do this. Stick to one market.
Key points:
Pick one market: Each market has its own rhythm, volatility, and liquidity. Teaching one thoroughly allows you to understand everything about it.
Focus on one system: Instead of trying every new system from you tubes or forums, master one approach and refine it onwards e.g. – you trade FVGs, Win rate is 50% once you add Fibonacci it might be e.g. 65%
Avoid information overload: Social media and trading forums are filled with conflicting advice, stick to your chosen approach and refine it. People say you need to have 12-hour trading days. If you do this, you will FAIL. You will grind yourself into the ground and face burnout making it very difficult to get back up again. Limit yourself to how much trading and trading study you do a day. Eg 10 back test trades, 3 real trades, 3 journaled trades, 1 hour of studying and researching the market.
Without strong risk management, even a high win-rate strategy can fail. Protecting capital ensures you’re still in the game when opportunities arise.
Why it matters
Depth beats breadth early on. Mastering a single market and system will allow you to build confidence and improve your edge.
4) Understand the Psychology of trading.
Trading isn’t just numbers: as mentioned in “understanding” it’s a test of emotional control, fear, greed and impatience.
Key points:
Emotions vs logic: ensure you recognize emotional reactions like FOMO (Fear of missing out) or revenge trading. Pause before reacting to a trade that will go against you.
Set realistic expectations : Markets move slowly. Sometimes for months, don’t expect huge gains overnight. Just like DCA focus on compounding. Compound your knowledge and skill set.
Mindset training: Techniques like medication and journaling as well as visualization can help reduce stress and maintain discipline.
Why it matters:
Even a diamond system can still fail if emotions drive your actions. Psychology often determines long term success, more than technical skill.
5) Prioritize learning. Then earning.
Beginners fall into the trap of trading being a “get rich quick” scheme. But the real investment is learning how the market works.
Key points:
Paper and demo trade first: Practice on demo accounts before you use real money – you will be surprised how many times you will fail. It’s better to fail with simulation money than your McDonalds weekly wage.
Review every trade: Analyze your losing trades, but also your winning trades. Find patterns and areas to improve.
Continuously educate yourself: Read books about the mind, about habits, watch market analysis but critically, apply what you learn and don’t just collect information and not use it.
Why it matters:
Earnings are just the byproduct trading. The faster you learn and adapt, the sooner your profits will appear. Treat early losses as tuition. Not failure.
Thank you all so much for reading.
I hope this benefits all those who are starting off their trading journey. If you have any questions, let me know in the comments below!

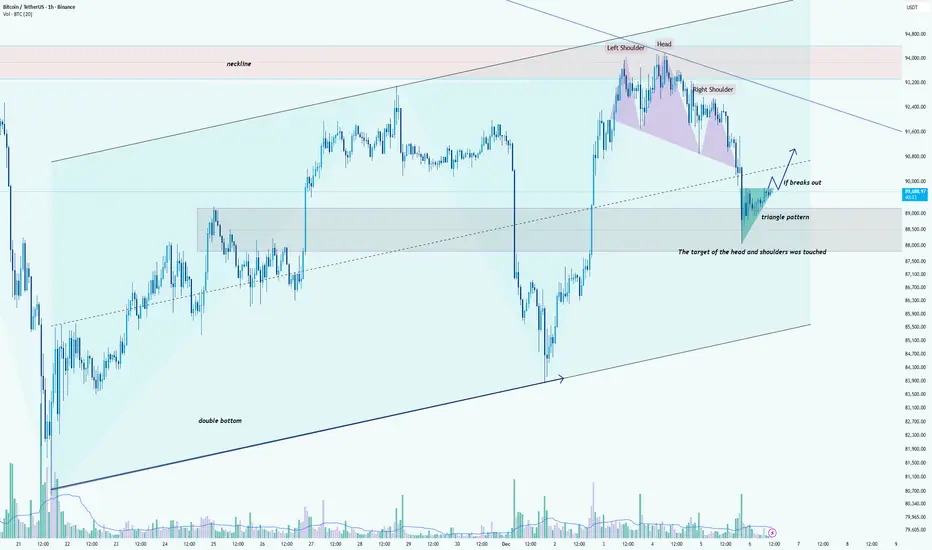
Bitcoin (BTCUSDT) – Intraday Trend & Pattern AnalysisHi!
Bitcoin continues to trade within a broader ascending structure, supported by an established rising trendline that has guided price higher over the past weeks. After forming a double bottom near the lower boundary of this channel, BTC initiated a strong rally toward the major resistance zone around 95,000 USDT, where a clear head-and-shoulders reversal pattern appeared. The neckline later broke, and its measured target has already been fully achieved, confirming the pattern’s validity.
Following the completion of this decline, the price stabilized inside the previous consolidation zone and began forming a triangle pattern, signaling compression and potential trend continuation. BTC is now testing the upper boundary of this triangle. A confirmed breakout above the pattern could trigger a bullish continuation toward 90,500–91,200 USDT, aligning with the dashed trendline and short-term resistance levels.
Failure to break upward may lead to a retest of the triangle’s lower boundary or even the broader demand area around 88,000–88,500 USDT, which previously acted as a reaction zone.
Overall, as long as the price remains above the ascending channel’s main support, the medium-term structure favors buyers. A breakout from the triangle will be the key signal for renewed bullish momentum.
BTCUSDT – Major Distribution Zone Detected! Potential Drop Ahead📉 BTCUSDT – Distribution Completed, Correction Likely
1️⃣ Previous Range Accumulation (Left Zone)
Price moved sideways in a tight consolidation box.
After holding for some time, BTC broke down sharply, showing clear supply pressure.
---
2️⃣ Strong Recovery Rally (Middle Zone)
After the breakdown, price created a bullish accumulation zone.
A strong impulsive move up followed — this is a classic liquidity grab + reversal.
The diagonal trendline shows the momentum slope of the recovery.
---
3️⃣ Current Market Structure (Right Zone)
Price is currently inside another consolidation box, similar to the first range.
This suggests distribution, not accumulation.
Momentum is weakening near 93,000–94,000, with repeated rejections.
---
4️⃣ Expected Move (Bearish)
Your drawn projection is correct:
After sideways movement, BTC is likely to break down from this range.
Target region shown (~91,000 zone) makes sense because it aligns with:
Previous support
Unfilled imbalance
Ichimoku lower cloud support
---
5️⃣ Key Levels
Resistance: 93,800 – 94,200
Support: 92,000 → 91,000
Break Confirmation: Closing below 92,200
Bearish target: 91,000 – 90,800
---
🔍 Summary
BTC is forming a distribution zone after an overextended move. Market shows signs of exhaustion.
Unless BTC breaks above 94,200, the probability favors a move down toward 91,000.

Bitcoin Breakdown After Perfect Bounce — Short Setup LoadingAs I expected , Bitcoin bounced from the support zone and reached its targets.
Right now, Bitcoin has rejected from resistance lines and successfully broke both the support line and the support zone($90,650-$90,000).
From an Elliott Wave perspective, it appears that Bitcoin has completed a ZigZag structure, and we should now anticipate the start of a bearish wave sequence.
The S&P 500 index( SP:SPX ) also shows a bearish outlook, and given Bitcoin’s correlation with SPX, further downside in BTC is not surprising.
At the same time, USDT.D%( CRYPTOCAP:USDT.D ) has turned bullish again—at least in the short term—which can add additional pressure on Bitcoin.
I expect Bitcoin to continue its downward movement, at least toward the next support zone($87,140-$85,290) and the lower line of the ascending channel.
Note: It’s better to wait for a bullish correction before entering, and then take a short position according to your own strategy.
Cumulative Short Liquidation Leverage: $98,260-$96,690
Cumulative Short Liquidation Leverage: $93,040-$92,560
Cumulative Long Liquidation Leverage: $94,840-$94,100
Cumulative Long Liquidation Leverage: $83,900-$82,400
Target: $87,733
Stop Loss(SL): $92,723(Worst)
Points may shift as the market evolves
💡 Please respect each other's opinions and express agreement or disagreement politely.
📌Bitcoin Analysis (BTCUSDT), 1-hour time frame.
🛑 Always set a Stop Loss(SL) for every position you open.
✅ This is just my idea; I’d love to see your thoughts too!
🔥 If you find it helpful, please BOOST this post and share it with your friends.
Lingrid | BTCUSDT Potential Bullish Trend Continuation SetupBINANCE:BTCUSDT is holding above the trendline after defending the higher-low zone, keeping the broader bullish structure intact. The recent pullback swept short-term liquidity before price stabilized near the 89,000 support band, where buyers stepped back in. This behavior suggests the move lower was corrective rather than the start of a reversal.
As long as price remains supported above 89,000 and respects the ascending structure, CRYPTOCAP:BTC has room to grind higher toward the upper resistance cluster around the weekly high near 96,000. A successful push through that zone would signal trend continuation, while short-term consolidations along the trendline remain constructive for further upside.
➡️ Primary scenario: higher lows hold → continuation toward 96,000 resistance area.
⚠️ Risk scenario: loss of 89,000 support invalidates the bullish setup and shifts focus back toward deeper support.
If this idea resonates with you or you have your own opinion, traders, hit the comments. I’m excited to read your thoughts!
