BTCUSDT: Trend in 1-H time frameThe color levels are very accurate levels of support and resistance in different time frames.
A strong move requires a correction to major support and we have to wait for their reaction in these areas.
So, Please pay special attention to the three accurate trend, colored levels, and you must know that SETUP is very sensitive.
BEST,
MT
Trade ideas

My Bitcoin plan for next 1 - 2 weeks My Bitcoin plan for next 1 - 2 weeks
I think we are in a bear trend. but it doesnt mean u must take trades in a vad place.
Alwasy better to take trade after a trap into opposite direction
Best sell zone 95 - 100k
with a target 73k

TradeCityPro | Bitcoin Daily Analysis #232👋 Welcome to TradeCityPro!
Let’s dive into the Bitcoin analysis. This week has been a range-bound week for Bitcoin, and this range still continues.
⏳ 1-Hour Timeframe
The market conditions haven’t changed much compared to yesterday. Bitcoin has simply continued its range-bound movement.
⚡️ We had a resistance zone at 89,000, which the price had previously touched. In the subsequent move, the price has not been able to reach this level again, indicating a lack of buying strength.
🧩 Considering the decrease in volume and the weakening of the red candles, the chances of reaching 89,000 in this leg are quite low.
💥 The RSI oscillator has reached the momentum support zone for the price at 41.31.
🎲 If this level is broken, we can say that the bullish momentum will completely disappear, and the market will need to form a new structure.
✅ The loss of bullish momentum does not necessarily mean the end of the uptrend or the beginning of a downtrend. It simply means that the market’s momentum has faded, and we will need to wait and see what happens in the new structure.
💡 If the RSI stabilizes below this level, we can open a short position after breaking 85,770 and a long position after breaking the 89,000 level.
📊 However, if the RSI maintains its momentum and gets supported, we can enter a position earlier with the trigger at 87,942.
✨ The 87,942 trigger is considered risky, so I recommend paying attention to the volume. If the volume confirms the move, you can open the position after the breakout.
❌ Disclaimer ❌
Trading futures is highly risky and dangerous. If you're not an expert, these triggers may not be suitable for you. You should first learn risk and capital management. You can also use the educational content from this channel.
Finally, these triggers reflect my personal opinions on price action, and the market may move completely against this analysis. So, do your own research before opening any position.

How to build Discipline & Structured Trading HabitsDiscipline is not something you rely on in the moment; it is something you build through habits that remove emotional decision-making from your trading process.
1. Define Rules Before You Trade
Traders without predefined rules rely on emotion. Traders with rules rely on structure.
Clearly define your entry criteria, risk per trade, maximum daily loss, and exit strategy.
When these rules exist before the session starts, you eliminate most impulsive behaviors.
2. Limit Your Daily Decisions
Every decision drains mental energy. The more choices you make, the weaker your discipline becomes.
Reduce the number of markets you watch, the number of setups you take, and the amount of chart time you expose yourself to.
Fewer decisions lead to higher-quality decisions.
3. Use a Pre-Session Checklist
A checklist forces you into a disciplined routine. It can include:
• Reviewing your trading plan
• Checking upcoming news releases
• Confirming your bias or market conditions
• Ensuring your risk settings are correct
The act of going through the checklist prepares your mind to follow structure.
4. Implement a Hard Stop for the Day
One of the fastest ways to lose discipline is to trade while emotional.
Set a maximum daily drawdown. Once it is hit, the session ends. No exceptions.
This protects both your capital and your psychology.
5. Track Your Rule Breaks
Most traders only track wins and losses. Disciplined traders also track deviations.
Write down every time you break a rule, why it happened, and how you plan to prevent it next time.
Over time, this builds awareness and accountability.
6. Delay Impulsive Actions
If you feel the urge to jump into a trade that does not fit your plan, delay the action by 30 to 60 seconds.
Impulses lose power quickly. By introducing a pause, you give your rational mind time to regain control.
7. Keep Your Environment Clean
Distractions destroy discipline.
Silence notifications, close irrelevant tabs, and avoid multitasking.
A clean trading environment supports clean decisions.
8. End Each Session With a Routine
A consistent end-of-day routine reinforces discipline. Examples:
• Rating your discipline on a scale from 1 to 10
• Reviewing whether you followed your rules
• Logging emotional triggers
Ending the day with structure makes it easier to begin the next one with structure.
Conclusion
Discipline is not built through motivation but through habits that create consistent behavior. A structured trading routine removes uncertainty, minimizes emotional influence, and helps you operate like a professional rather than a reactive participant.
Final 2025 Forecast for BTCUSDT 28th November 2025 (Updated)Same idea as previous post, just zoomed in to see the potential gyrations towards to move towards ~$128k and hopefully beyond ✌️
1. Friday session dip to around ~$81k
2. Pump to around ~$87k over the weekend
3. Dump down to ~$80k for Monday Trap
4. Black Friday Pump to ~$89k
5. Max Pain Dump to ~$75k-$79k
6. Final pump to ~$128k to end the cycle
If we are lucky and price pullbacks from ~$128k and then exceeds it. Here are the targets I would be looking at;
Target #1 $140k-$145k,
Target #2 $170k-$175k
Target #3 $200k-$205k
This of course could be 100% wrong so remember (as always) to ruthlessly ✂️ cut your losers when wrong, and hold ✊ onto your winners when right.
--
I might also add, come early December 1st - 5th the following celestial events will take place which support the run up to $128k (and possibly beyond);
1. Super Full Moon (“Cold Moon”) 🌖
• On December 4, 2025, there’s a nearly full moon (~98% illuminated). 
• This will be a supermoon, meaning the Moon appears slightly larger and brighter than average. 
• The Moon is in Taurus, and near the Pleiades (M45) — Taurus is represented no other than the Bull.
Supermoons correlate with:
• spikes in emotion
• increased speculative behavior
• temporary liquidity expansions
• bigger candles (up OR down)
A near-super full moon tends to:
• mark volatility apexes
• precede relief rallies
• create short-term “energy reversals”
2. Moon–Jupiter conjunction (Dec 7) — traditionally expansive 🌖
Jupiter is symbolically linked with:
• expansion
• optimism
• big moves
• risk-on thinking
• growth
• speculation
When the Moon (sentiment) aligns with Jupiter (expansion), it often coincides with:
• higher risk appetite
• FOMO
• bullish short-term flows
In Summary;
1. Moon–Jupiter conjunction (Dec 7) → Expansive, optimistic, risk-on symbolism
2. Super Full Moon (Dec 4) → Volatility peak → Reversal → Upward burst
4 days ago

Bitcoin Eyes Technical Pullback Before Next Upward MoveHello everyone,
Bitcoin is pausing after a rebound from the 86,000 USD area, but upward momentum faces resistance around 92,000 USD—where a red FVG, old supply zones, and heavy volume converge. Every approach to this area triggers downward pressure, producing red candles near supply zones, showing that selling pressure remains significant.
Nonetheless, the macro backdrop supports buyers: a weaker USD, declining US bond yields, and expectations of Fed rate cuts in 2025–2026 help Bitcoin hold higher levels. ETF inflows are returning, institutions are buying on dips, while the broader market remains neutral without FOMO.
Technically, lower FVGs at 89,500–90,000, 88,000–88,500, and 86,500–87,000 USD provide reasonable retracement areas before the next breakout. The structure has yet to form a new high, upward momentum is weak, and selling pressure has slightly recovered; this technical correction is an opportunity for the market to gather liquidity.
Forecast: BTC may retrace to 89,500 USD, and if selling remains strong, it could test 88,000–88,500 USD. Subsequently, buying pressure should return, pushing BTC back toward the 92,000–93,000 USD resistance, continuing the long-term uptrend.

BITCOIN SIGNAL: ONE MORE DUMP BEFORE PUMP??? (warning)Yello Paradisers! Enjoy the video!
And Paradisers! Keep in mind to trade only with a proper professional trading strategy. Wait for confirmations. Play with tactics. This is the only way you can be long-term profitable.
Remember, don’t trade without confirmations. Wait for them before creating a trade. Be disciplined, patient, and emotionally controlled. Only trade the highest probability setups with the greatest risk to reward ratio. This will ensure that you become a long-term profitable professional trader.
Don't be a gambler. Don't try to get rich quick. Make sure that your trading is professionally based on proper strategies and trade tactics.

BTC. End of correction long.Only if we can take the 94.6 level the true long confirmed. Otherway it flat between 85 -95 +/-

Bitcoin: The ATH Was a Trap. Here's the Real Roadmap.Since mid-July, Bitcoin has been in a global range. The "breakout" to a new ATH on Oct 5-6, which the majority expected to continue, was actually a liquidity sweep . This has confirmed the global range and a high probability of a high-timeframe correction.
After the sharp drop on the Oct 10 news, a local range has formed. I expect a breakdown from this local range, with the minimum target being a sweep of the Previous Month's Low (PML) .
After that, the plan is to look for long-term long setups at three key global support levels.
SCENARIO 1: 50% Monthly Fib Level
The first major support is the 50% Monthly Fibonacci retracement level . If price reaches this level and also performs a liquidity sweep of the June 22 low , the probability of a long setup will be much higher.
Confirmation: Price must find acceptance above this level, confirmed by Daily or Weekly candle bodies .
Target: Mitigation of the global and local ranges.
SCENARIO 2: 78.6% Monthly Fib + Weekly OB
If the 50% level is broken, the next major support is the 78.6% Monthly Fib level in conjunction with a Weekly Order Block .
Confirmation: The interaction must be analyzed with D1/W1 candles. Acceptance above this level confirms the long setup.
SCENARIO 3: The "Make-or-Break" Level
A break of the 78.6% level opens the door to the April 7 low at $74,500 . The market's reaction to this final level will determine whether the bull cycle has a chance to continue, or if a new bear cycle will begin.
~~~~~~~~~~~~~~~~~~~~~~~~~~~~~~~~~~~~~~~~~~~~~~~~~~~~~~~~~~~~~~~~~
The principles and conditions for forming the manipulation zones I show in this trade idea are detailed in my educational publication, which was chosen by TradingView for the "Editor's Picks" category and received a huge amount of positive feedback from this insightful trading community. To better understand the logic I've used here and the general principles of price movement in most markets from the perspective of institutional capital, I highly recommend checking out this guide if you haven't already. 👇
P.S. This is not a prediction of the exact price direction. It is a description of high-probability setups that become valid only if specific conditions are met when the price reaches the marked POI. If the conditions are not met, the setups are invalid. No setup has a 100% success rate, so if you decide to use this trade idea, always apply a stop-loss and proper risk management. Trade smart.
~~~~~~~~~~~~~~~~~~~~~~~~~~~~~~~~~~~~~~~~~~~~~~~~~~~~~~~~~~~~~~~~~
If you found this analysis helpful, support it with a Boost! 🚀
Have a question or your own view on this idea? Share it in the comments. 💬
► Follow me on TradingView for timely updates on THIS idea (entry, targets & live trade management) and not to miss my next detailed breakdown.
~~~~~~~~~~~~~~~~~~~~~~~~~~~~~~~~~~~~~~~~~~~~~~~~~~~~~~~~~~~~~~~~~

BTCUSDT.P - December 1, 2025The chart shows Bitcoin breaking down sharply from a rising wedge‑type structure after failing to sustain prices above the 91,000–91,500 resistance band, confirming short‑term bearish momentum on the 15‑minute timeframe. Immediate support sits around 86,000–85,500 where price is currently reacting, but the highlighted lower zone near 82,000–81,500 represents the next downside target if this local support gives way, aligning with the projected stop level for any counter‑trend long attempt. The higher‑probability play is to wait for either a clear bullish reversal pattern and strong candles off the 85,500–86,000 area to target a corrective bounce back toward 91,000, or a weak consolidation followed by continuation selling into the lower support box to consider fresh shorts with stops above the broken intraday resistance.

Correction CompleteBTC should now hit our targets of 65.9k next
Other noteable supports are 59k and 57.1k
and finally, 48.2k (but I don't think this will happen for a few months)

BTCUSDT – Bullish Reversal Setup at Key SupportBitcoin has made a sharp impulsive drop into a key higher-timeframe support zone (highlighted in yellow). This area has previously acted as strong demand, producing a significant bounce on Nov 27.
Price has now tapped back into this zone with a long lower wick, showing early signs of buyer absorption. If the support continues to hold, this area offers a potential long (buy) entry, as marked on the chart.
🔹 Key Points
Support Zone: 86,800 – 87,400
Entry Area: After confirmation within support (marked “ENTER”)
Market Reaction: Strong sell-off into support followed by initial rejection (blue circle)
Bias: Bullish as long as support holds
🎯 Target
Upside continuation toward 90,500 – 92,000 (target zone on chart)
⚠️ Invalidation
A clean break and candle close below the support zone would invalidate the long setup.

BTCUSDT: Bullish Push to 98500?BINANCE:BTCUSDT is eyeing a bullish reversal on the 4-hour chart , with price rebounding from a broken level near cumulative long liquidation, converging with a potential entry zone that could trigger upside momentum if buyers defend against further dips. This setup suggests a recovery opportunity after recent pullback, targeting higher resistance levels with excellent risk-reward.🔥
Entry between 87500–88500 for a long position (entry at current levels with proper risk management is recommended). Targets at 95000 (first), 98500 (second). Set a stop loss at a close below 85000 , yielding a risk-reward ratio up to 1:3 overall. Monitor for confirmation via a bullish candle close above entry with rising volume, leveraging Bitcoin's resilience post-correction.🌟
Fundamentally , Bitcoin is consolidating around $89,000 in late November 2025 after a sharp retreat from its all-time high of $126,000, driven by fading momentum and institutional caution amid a 15%(from top) October decline contrary to historical patterns. Despite dipping below $85,000 recently (trough at ~$80,553), fundamentals remain strong with institutional investors holding steady, reduced Fed rate cut expectations supporting USD strength, and long-term forecasts eyeing upside to $240,000 driven by macro asset behavior and cycle highs. Bitcoin correlates with the S&P 500 , and recently we've seen growth in the S&P 500. 💡
📝 Trade Setup
🎯 Entry (Long):
87,500 – 88,500
(Entry at current levels with proper risk management is also valid)
🎯 Targets:
• 95,000 (first)
• 98,500 (second)
❌ Stop Loss:
• 4H close below 85,000
⚖️ Risk-to-Reward:
• Up to 1:3 on full run
👇 Share your thoughts below! 👇

• BTCUSDT: Liquidity Sweep Reversal — Watching $88,000 and $91,5BTCUSDT has just swept liquidity below the demand zone and printed a clean bullish hammer, signaling a potential reversal from our marked buying zone. If this reaction holds, price could push toward the upside targets at $88,000 and $91,500 as highlighted on the chart.
This demand zone remains crucial for confirming whether BTC is ready for a recovery or if sellers will attempt to drive it back below $86,500. Always manage your risk properly when trading volatile market conditions.
For further analysis, please like and comment.

BTC Next JourneyBTC must maintain 82,550 $ to survive from worse scenario, details in the attached monthly chart

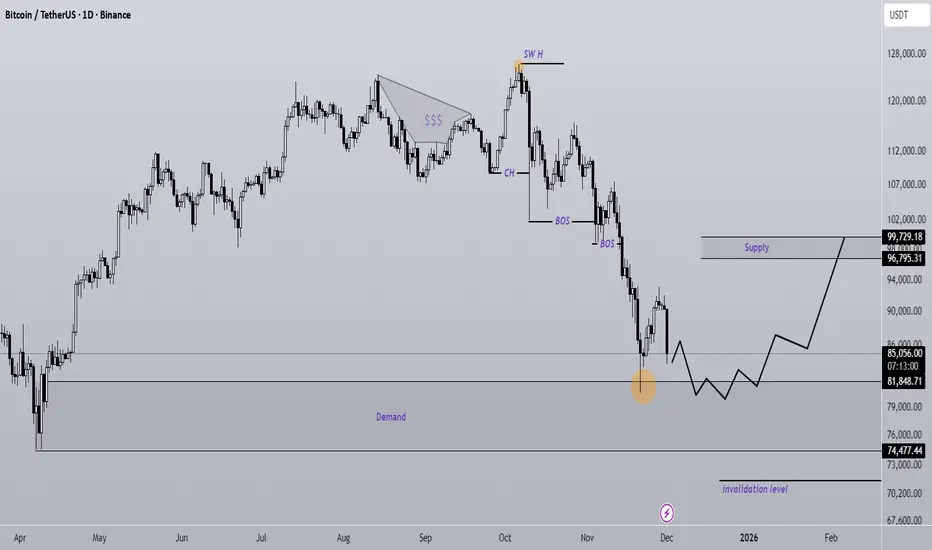
Bitcoin new update (1D)Bitcoin has not yet fully absorbed the buy orders in the marked support zone. This time, upon tapping the support area again, we can expect the price to form a stronger bullish move, at least toward the identified supply zone.
A daily candle closing below the invalidation level will invalidate this outlook.
Do not enter the position without capital management and stop setting
Comment if you have any questions
thank you
Bitcoin recovers rise again moveBitcoin is showing signs of bullish consolidation after a prolonged decline into key support. Based on the current range structure, the market may be preparing for an upward move.
The recovery aligns with broader market sentiment, as U.S. stock indices recorded their fourth consecutive session of gains, driven by expectations of potential Federal Reserve interest-rate cuts.
From a technical perspective, if Bitcoin can hold bullish momentum and secure a 4H candle close above the 90,000 level, it would strengthen the case for continuation to the upside. After the recent long fall, price may look to retest overhead resistance in the 98,000 – 105,000 zone.
You may find more details in the chart.
Trade wisely best of Luck buddies.
Ps; support with like and comments for better analysis thanks for supporting.

BTC SHORT SETUP – Multiple Bearish Confluences!Price at Decision Zone – Bears Preparing for the Next Move
After the recent downside move, Bitcoin printing Lower Highs (LHs) — a classic sign of fading bullish strength. #BTC is now testing the upper descending trendline, an area where price has consistently faced rejection.
Bearish Confluences Building Up
1️⃣ Lower High Structure
Market structure is shifting bearish as #BTC keeps forming LHs.
2️⃣ Trendline Retest
Price is touching the upper trendline, a key rejection zone in this downtrend.
3️⃣ 30-Min Bearish Divergence
Momentum is slowing down while price pushes up — a reliable early signal of weakness.
4️⃣ No Strong Bull Confirmation Yet
For a real trend reversal, #BTC must reclaim 80,000 and show bullish divergence, which is currently absent.
Trade Plan
I will look for a short entry once #BTC breaks the minor intraday support level.
✔ Stop-loss: Above the most recent LH
✔ Targets: Local liquidity zones below
✔ Strict risk management—no chasing
Bias
With structure, divergence, and trendline all aligned, probability favors a bearish continuation unless bulls reclaim major levels.
What’s your view?
Will #BTC break lower or surprise with an unexpected bounce?
👍 LIKE for more setups
💬 COMMENT your bias
⭐ FOLLOW for premium BTC, GOLD & FX ideas
#Bitcoin #BTCUSD #Crypto #TradingView #PriceAction #CryptoAnalysis #BTC #ShortSetup #BearishDivergence #TrendlineTrading #TechnicalAnalysis

December BTC overviewBTC closed November sweeping and reclaiming the weekly 100 EMA, and although the daily chart printed a strong reversal candle, it is still too early to call a bottom.
The broader bearish structure on both the weekly and daily remains intact, and volume aligns with the downtrend. On the daily, we also have the 100 and 200 EMA bearish crossover, which confirms a strong HTF bearish trend.
In bearish markets, it is uncommon to leave an FVG unfilled unless the trend is very strong. Even though November closed above the 100 EMA, it was still a heavy bearish close that broke the monthly bullish trendline.
If we hit 100K, it would imply a 20K rally after a 40K drop with no real consolidation or accumulation. That would be wild. It is possible but very unlikely. This currently looks like the unwind of a multi-day distribution that likely started in July. The market needs a proper multi-day accumulation.
We also need to consider that we are fading the high return season, which adds more weight to the distribution thesis.
My expectation for December is range-bound price action and a close near the yearly open.
On low timeframes, there is a clean short opportunity at the bearish order block around 95K to 97K, sitting above yearly-open liquidity.
If price returns to the lows, we also have a potential monthly double-bottom setup targeting the yearly open.
There is a daily bullish MSB waiting at 97K. If price reaches it, we may start holding above the yearly open and squeeze toward the daily 200 EMA. From there, the monthly and weekly trendline could act as resistance and push price back to the lows, which is a common retest pattern after a strong trendline break.

TradeCityPro | Bitcoin Daily Analysis #231👋 Welcome to TradeCity Pro!
Let’s dive into the Bitcoin analysis. The market is currently in an upward correction phase.
⏳ 1-Hour Timeframe
Yesterday, Bitcoin was supported at the 85,770 level and made another upward move.
✨ Currently, the price has reached the 89,000 level and has been rejected from there. This zone is a very strong PRZ (Potential Reversal Zone).
✔️ As long as the price doesn’t break below the 85,770 support, the possibility of breaking the 89,000 resistance still exists. Breaking this level, as mentioned in previous analyses, will be the first sign of a trend reversal for Bitcoin.
📊 The selling volume in the red candles has decreased a bit. Now, if the buying volume increases with the green candles, the likelihood of breaking the resistance increases.
⭐ However, if the price moves downward and breaks the 85,770 support, we can expect Bitcoin to move back toward the 82,214 level.
🧮 Therefore, we can use the break of 85,770 as a trigger for opening a short position.
🎲 For confirmation on higher cycles, the confirmation for a bullish reversal will come after stabilizing above 93,555, and the confirmation for a bearish trend will come after stabilizing below 82,214.
❌ Disclaimer ❌
Trading futures is highly risky and dangerous. If you're not an expert, these triggers may not be suitable for you. You should first learn risk and capital management. You can also use the educational content from this channel.
Finally, these triggers reflect my personal opinions on price action, and the market may move completely against this analysis. So, do your own research before opening any position.

BITCOIN: A TALE OF EXHAUSTED BULLSmart money tends to accumulate heavily when sentiment is at extreme fear, signaling belief in a rebound. It is often correct, though not consistently.
Much of the pessimism appears to be fully priced in at this point. Thus, a bullish scenario remains technically possible, although broader conditions still align with a bear-market environment.
Let's see.

BTC/USDT: Potential Uptrend and Buying OpportunityBitcoin is creating a buying opportunity as it continues to follow a clear uptrend channel. With support from macroeconomic factors and positive momentum from the cryptocurrency market, BTC/USDT has the potential to move upward strongly.
The chart shows that BTC is currently moving within an uptrend channel, supported by the EMA lines. The recovery from the recent bottom around 86,700 USD and the price moving closer to 91,000 USD indicates that the market is starting to regain upward momentum.
Looking at the current price levels, BTC is approaching an important resistance level at 95,500 USD. If this level is broken, the uptrend could extend, pushing the price to higher levels, potentially reaching 100,000 USD. However, if BTC fails to break through the 95,600 USD level and pulls back to test the 86,700 USD support, this would provide a good buying opportunity before continuing the uptrend.
In summary , BTC/USDT is currently on a strong uptrend, and the buying opportunity remains as the price adjusts back to key support levels. Watch the 86,700 USD level as an ideal entry point to take advantage of the upcoming strong rally.

BTC Adam & Eve PatternLooks like on the 12 hour BTC has an Adam & Eve pattern. The height of the arch is the potential downside. So if it plays out, it looks like 74k is possible.
