What is bitcoin CME Gap? How to use BTC gap IndicatorWhat is bitcoin CME Gap? How to use BTC gap Indicator
The 'Gap' in the CME (Chicago Mercantile Exchange) futures market, which offers a glimpse into the movements of institutional investors, is one of the key indicators many professional traders watch closely.
1️⃣ What is the Bitcoin CME Gap?
CME is one of the primary avenues for institutional investors to access Bitcoin. However, the CME Bitcoin futures market closes over the weekend (from Friday afternoon to Sunday afternoon, Chicago time, USA). Additionally, there is a one-hour trading break after market close on weekdays.
Conversely, spot exchanges like Binance and OKX, which we commonly see, operate 24 hours a day.
This difference is where a 'Gap' occurs. Especially during weekends, when the break is longer, gaps tend to be larger.
Bearish Gap: Occurs when the opening price after the CME market closes is lower than the closing price. This means that the Bitcoin price fell in the spot market during the off-hours.
Bullish Gap: Occurs when the opening price after the CME market closes is higher than the closing price. This means that the Bitcoin price rose significantly in the spot market during the off-hours.
Abrupt Psychological Shift: This implies that investor sentiment leaned heavily towards one side during the weekend.
Unfilled Order Blocks: The gap area is interpreted as a region where potential unfilled orders (buy/sell pressure) may exist.
Gap Fill Phenomenon: Many traders believe in the adage "gaps get filled" and use it as a trading strategy. This suggests a tendency for the price to move in the opposite direction of the gap, eventually attempting to cover the gap area. However, this phenomenon is not 'mandatory', and whether a gap will be filled immediately or much later must be judged through various analyses.
2️⃣ Easily Find CME Gaps
The Bitcoin CME gaps multi-timeframe auto finder indicator automates CME candle analysis and displays it intuitively on the chart.
⚡Indicator Features and Usage
Multi-Timeframe Gap Detection: 5-minute, 15-minute, 30-minute, 1-hour, 4-hour, and even 1-day candles! It simultaneously detects and displays CME gaps occurring across various timeframes. Whether you're a short-term trader or a long-term investor, you can check gaps according to your trading style.
Automatic Box and Label Display: The detected gap areas are drawn as rectangular boxes on the chart. Bullish gaps are displayed in green tones, and bearish gaps in red tones, making them easy to identify at a glance. The size of each gap (%) is displayed as a label above its respective box.
Highlight Function: Large gaps above a set threshold (e.g., 0.5%) are highlighted with an emphasized color. 'Big gaps' can have a greater impact on the market, so they should be noted.
Chart Price Synchronization: The price of spot charts from other exchanges may differ from the CME futures price. This indicator adjusts the price of the gap boxes to the price level of the chart you are currently viewing via the "Chart_price" mode. By using the "Chart_price" mode, you can more intuitively grasp the price level of the gap box on the spot chart and make direct trading plans on the chart of another exchange you are viewing.
Real-time Alerts: You can receive real-time alerts when a new CME gap is detected. You can also set alerts to notify you only about gaps from a specific timeframe. This is extremely useful when you can't continuously watch the chart during weekends or specific times on weekdays.
3️⃣ Trading Strategies
💡Gap Fill Strategy:
When a Bullish Gap Occurs: If the price breaks above a bullish gap but then falls back into the gap area attempting to fill it, one might consider a long position near the bottom of the gap, or a short position if the price fails to rebound from the top of the gap. Alternatively, a strategy of considering a short position in a resistance zone before the gap is filled is also possible.
When a Bearish Gap Occurs: If the price breaks below a bearish gap but then rises back into the gap area attempting to fill it, one might consider a short position near the top of the gap, or a long position if the price fails to fall from the bottom of the gap. Alternatively, a strategy of considering a long position in a lower support zone before the gap is filled is also possible.
💡Utilizing as Support/Resistance Areas:
Old CME gap areas can act as strong support or resistance lines when the price retests those levels in the future.
Observe whether the price encounters resistance and falls again when it reaches the top of a bearish gap, or if it finds support and rises again when it reaches the bottom of a bullish gap. Gaps that overlap across multiple timeframes can hold even stronger significance.
💡Trend Confirmation and Reversal Signals:
If a strong bearish gap occurs and is not immediately filled, but the price continues to fall, this could indicate the start or continuation of a strong downtrend.
If a strong bullish gap occurs and is not immediately filled, but the price continues to rise, this could indicate the start or continuation of a strong uptrend.
You can use the price movement after a gap occurs to gauge market momentum and apply trend-following or trend-reversal strategies.
For example, if a bearish gap occurs but is quickly filled within a few days and breaks above the top of the gap, this could be interpreted as an early sign that the bearish market has ended.
💡Multi-Timeframe Analysis:
When looking for key support/resistance levels, check not only the gaps of the current timeframe you are viewing but also gaps from higher timeframes (e.g., 4-hour or daily gaps on a 1-hour chart).
Gaps from larger timeframes are areas of stronger market interest. When making trading decisions in smaller timeframes, consider the location of important gaps from higher timeframes for risk management or to set entry/exit targets.
Short-term Gaps (5m, 15m): Most gaps occur within 1% and can be utilized for short-term volatility, high-leverage scalping, or day trading. They are suitable for quick entry/exit strategies, with caution against whipsaws. They tend to be filled before the 4-hour candle closes after the market opens.
Medium-term Gaps (1h, 4h): Can be referenced for swing trading or position trading. They can become significant support/resistance areas depending on price movement after the gap occurs.
Long-term Gaps (1d): Can act as major turning points in market trends or as important support/resistance levels from a long-term perspective. If a 'big gap' occurs, the possibility of a shift in the market's overall direction should also be considered. They usually occur during the weekend off-hours, and sometimes large gaps of over 3% occur.
A weekday short-term gap that was filled 4 hours ago.
A weekend long-term gap that saw a trend increase after a 4% big gap occurred.
4️⃣ Conclusion
The 'Bitcoin CME Gap Multi-Timeframe Auto Detector' indicator is a powerful tool that helps you not miss crucial price fluctuation points in the market.
However, no indicator should be blindly trusted. Gaps may not be fully filled, or the price may immediately break out in the opposite direction after surpassing a gap. Instead of relying solely on gap filling, it is crucial to analyze it in conjunction with other indicators to increase your win rate.
We hope you utilize the information gained from this indicator and combine it with your existing analysis methods (chart patterns, auxiliary indicators, macroeconomic analysis, etc.) to build more sophisticated trading strategies.
📌If this content was useful, please support us with a boost and comments. Your small encouragement is a great strength for creating better analyses and content. By following, you can also receive notifications about our postings
Trade ideas

DeGRAM | BTCUSD BTCUSD is aiming to reach a key support level.📊 Technical Analysis
● BTC is approaching a major confluence zone where the long-term support line meets the key demand area near 94k–92k. This level previously triggered strong reversals.
● Price remains inside a broad falling structure, and a bounce from the lower boundary would confirm trend exhaustion and open room for recovery toward 102k–108k.
💡 Fundamental Analysis
● FXStreet reports renewed inflows into BTC ETPs and improving risk sentiment as markets expect milder Fed policy, supporting medium-term bullish pressure.
✨ Summary
BTC nearing 94k–92k demand; bounce may target 102k–108k. Key support: 92k. Break above falling trend = continuation.
-------------------
Share your opinion in the comments and support the idea with a like. Thanks for your support!

Mastering Trading Psychology; Why Mindset is the toughest skillWelcome all to another post.
In this article we will dive into the process of Mastering Trading Psychology.
1) What is Trading Psychology:
Trading Psychology, it is your mindset. It is what you think, how you feel, what you need to do, what you want to do. It is a mixture of thoughts, future actions, emotions and past, present or future behaviors that influences your present self in making good, or bad decisions in the market.
It can be considered a “strategy” but leans more to a “skill” It’s about what your thought process is when you are under pressure.
Everybody, investor, gambler, trader, swing trader, day trader, scalper and holders, bring their own personalities & habits into the trading space. Whether it’s impatience, or patience, fear or greed, confidence or impulsiveness, or discipline. These mental sets determine how frequently you can follow your edge and how well you can manage wins, losses and uncertainty.
Trading psychology is the framework of the mind. It works for you or goes against you. Both are under your control to choose from. A strong, stable, clear mind keeps you going. A weak, broken, cluttered mind keeps you falling.
Ultimately, to master trading in psychology, you need to master yourself.
2) Pros and Cons of Trading Psychology:
Pros:
The pros/benefits of Trading Psychology, once it is mastered, is simple.
You understand the game. You understand the process. You understand why you lose, why you win, why manipulation takes place and why you trade it.
It is a skill that is developed through patience and perseverance along with constant practice.
Like every other skill, it demands TIME, ENERGY, and constant Trial and Error of failures, wins, adjustments and so on. It isn’t something that can be taught or learned once, except for those who learn to recognize and leverage their mental strengths & weaknesses can truly master it over time.
Cons:
Trying to master Trading Psychology means you need to LOSE. You need to experience loss after loss after loss after loss. You need to fail many times. Every time you fail, you understand how to take control of your emotions, you learn where things went wrong, you learn how to build your edge.
But it’s not always about losses, it’s about gains (wins )too. You need to maintain a stable status of emotions whether you win or lose. You can’t show anger, you can’t show excitement. Because both will come back at you with another loss.
This means you cannot allow yourself to be ruled by any emotion, positive or negative. It can be a long uncomfortable process that can take years to master. Sometimes even decades.
What makes it more challenging is that trading psychology does not exist in isolation.
Psychology outside of trading must be mastered too. How you think, act, live, every single day.
- We will explore this topic further down the article.
3) Why it is important in the trading space:
Psychology is an essential topic that must be taught and considered. Because without it, you will not succeed. Without self-control, or a strong mind, trading will become nothing more than just gambling like a slot machine.
It's a skill that many overlook. With it, you are aware of what works and what fails. It allows you to step back and re-assess the next trade instead of forcing it.
The end goal is to make money, but to even do that you first have to protect your capital. Only take A++ Set ups (High confluence/probability set ups) and avoid any traps involving emotions like: Fear of Missing Out (FOMO) or the “I just need 1 good pump” (One Big Win) Mindset.
With it being in the trading space, it gives users the ability to pause, re-assess and question your decisions on the trade you are about to take.
It helps to mention, “Is this an A++ Setup?” “Does it align with my strat, my edge, my goals?” If it does not and you decide not to take it, you save yourself a loss of capital and have made a win of improved trading psychology.
It assists you in distinguishing the difference between good/bad trades. Not on the result but the process. It keeps you grounded.
4) How to Master Trading Psychology:
Just because it is difficult & challenging, does not mean it is impossible.
First step – building discipline through consistency and structure.
Ensure you have a clear trading plan set up. One that defines your edge or can be adjusted to find your edge. Commit to following it no matter what the market is doing. Pumping, Dumping or consolidating.
Consistency in action will build mental strength.
Secondly, you must work on emotional control. Understand and be focused on how you feel when you experience fear, greed, or overconfidence. These emotions push you off your plan if you let them take over.
Each time this happens, you must log it. That way you can accumulate data and self-awareness.
With that, everyone says this. BackTEST or at least forward test you strategies extensively.
Keep a detailed journal that has a good list of questions that you must answer after each trade. Be brutally honest with yourself. Don’t hide losses because you have already hit 10 in a row. Log them all down. This way you will then be able to recognize emotional triggers and recurring patterns appearing that are holding you back.
Being able to recognise them is the first step to controlling them. OBSERVE YOURSELF.
While this takes place, you must begin to build trust in your system (strategy) and in yourself. You will see how your actions and choices line up with your plan. That way your confidence will shift from emotions to process driven.
Last one is patience. The hardest yet most critical psychological skills. Take ONLY A++ set ups, for example a set up that has 4 confluences or 5 lining up. Doing this trains your mind into avoiding impulsive behavior or falling into FOMO based environments.
To see another deep dive into mastering trading psychology, review the post below to determine which mindset you currently have. Are you a trader? Or are you a gambler.
5) How Psychology in our daily lives affects our ability to trade:
Trading Psychology is an interesting concept, but so is psychology in general.
The human mind is weak and for it to be strengthened, it takes time & self-awareness.
A weak mind won’t get you anywhere.
Psychology is not a simple one sentence definition. It can mean many things, or many situations.
It is a critical role in our life, it shapes our emotions, reactions and choices. It can lead us to self-sabotage or it can lead us to success.
If you cannot control your psychology outside of trading, you won’t be able to control it inside of trading. By this I mean daily emotions.
For example:
Imagine an individual experiences a breakout, they are sad, they are angry, they are emotionally drained and hurt. Then they go off to trade. They will LOSE.
This is because when the mind is in an uncomfortable state, it seeks a dopamine hit, and when they associate a win in trading = dopamine hit, they naturally turn towards trading. They want to feel that dopamine hit, so they can feel good again. But then they are no longer following their edge.
This destroys discipline, objectivity and focus.
This is not just tied to relationship breakups, but everything in our day to day lives. If you experience a bad day at work, failed an exam, argued with family, or facing a stressful time. If you bring unresolved emotions, thoughts and feelings into the trading space, trading just becomes a big emotional outlet.
Psychology appears in every action we do, EVERY day. “I need to drink water” I will get water. I see soda, “I now want soda.”
The mind now as switched completely from the main objective “Water” to soda. If you cannot control your mind to stick to what is right, then you will not master trading psychology.
The better control you have over yourself, & your mind, the more consistent and rational your trading decisions will become.
KEY POINTS:
1) What is Trading Psychology:
- Trading psychology is the foundation of every mental action. You must master yourself before mastering the market.
2) Pros & Cons of Trading Psychology:
- Trading Psychology cannot be mastered without failure, each loss has a lesson, that lesson is based around strengthening your mind with emotional control.
3) Why it is important in the Trading Space:
- Without a strong mind, trading turns into gambling, you must become disciplined and maintain self-control. This splits pros from the gamblers.
4) How to Master Trading Psychology:
- Right to the point: Consistency & discipline, emotional awareness, journaling, and most importantly, being patient. These are core aspects of mastering your mindset and obtaining the right psychological discipline.
5) How daily psychology affects trading:
- The way you manage your everyday emotions outside of trading mirrors the way you will end up reacting to the markets.
Control your life, then control your trades.
Psychology is a great skill, but it’s only part of 3 keys that will lead you to success. Find out the 2 other keys below:
Thank you all so much for reading - I hope this post brings a lesson into everyone's trading journey.
I am aware that this is a big long article, however Trading psychology goes even deeper - I have summarized my knowledge and research that I have obtained over time and summarized it.
Please let me know if any of you would like an a post on a specific topic.
I'd love to provide more for the community!

Easy Method to Spot and Trade ReversalHey whats up trader, in the last post we determined Daily Bias in the Trending conditions.
Now let's have a look to the reversal conditions.
We will look at the Daily bias, but as I mentioned this many times in my posts - price is fractal so you can use this at any timeframe. But, If I can give you recommendations look for Higher timeframe bias on Daily and Weekly and H4 / H1 Structure and M15 entries.
⁉️ Where is the liquidity ? Always follow the Daily / Weekly candle close.
Before I will show you my reversal pattern lets look first at how price stays in a trend.
📈 Continuation
If todays daily candle closed above previous days high and its still not reaching the key level, then liquidity is above todays high. Why ? Because people have intentions to sell highs to early, so and price will most likely go there. So we are bullish. Bullish Close 📈 Reversal
If todays candle wicked above previous day high, but closed below , then we can expect liquidity is below Previous days low. Why? Because mostl likely traders entered fake high break out they put SL below days low. It's signs of reversal. Every significant reversal wicked above / below Previous days high/ low and closed inside, if not seen on PDH then its on weekly. 🧩 Liquidity theory
Its always good to thing about the markets in terms of what others are doing. Back in 2014 when I worked in broker I had a chance to watch the order book. I have been able to see how traders are entering the markets where they put they stop losses. In the fact many people are chasing the price and they always buy highs and sell lows and most of the time they hide stop losses bellow / above the lows / highs of broken candle.
So if that is true, it can look like on the picture below. We can see price moving up. Focus on candles with the wick. It's what we see now. But at specific moment that candle was looking bullish and most likely traders entered with hope for the continuation. And they have put stop loss below the previous days lows. as that candle closed with the wick below the previous days high traders are now trapped in the longs and stop run against them starts now. It's our opportunity its our range - Our new bias.
Same it will be for the bullish case, traders sell the break out of the lows and put their stop loss above previous days highs. This behaviors creates a stop loss cluster there - which is liquidity and its high chance market will go there soon. Its our opportunity - our new bias So based on the candle closes we are able to defined a candle which was manipulated and its your range. I always markup range high / low and its 50% because its always a first target or partial profit when trading these ranges.
I have explained more about Range trading in this post 🔗Click the picture to learn more 👇https://www.tradingview.com/chart/BTCUSDT.P/PkQJvVm4-Complete-system-for-Day-Swing-Traders/ if you have read the linked post above you must understand that candle close are just a pattern.
‼️ We don't want to be just pattern traders, we need to understand the market context to filter out only high probability setups. Every setup must have following
1️⃣Key Level
our pattern without a key level is nothing. You dont want to be pattern trader, we need to add market context so every trade must go from a key level. Key levels occurs above / Below the ranges 2️⃣ Liquidity
Every range or range manipulation has to go above old highs / lows. Its increase the probability that traders entered break out so we can trade against them 3️⃣ Range definition
Skip small ranges. Not only that they will not give you proper risk to reward ratio, but they didnt created fomo or panic. We want see violent big range candles. Again go thru the charts you will see that big volatility always occurs before the reversal. 4️⃣Multiple timeframe ranges
for higher probability and biggest risk to reward setups mix HTF range with LTF ranges as for example on the chart below we can see Monthly, Weekly ranges, and even Daily range on the lows. There was H1 entry on the daily. And we closed above previous day = Daily order block on the edge of the Monthly and Weekly range = It will most likely go higher
✍️ Homework
its not point to show you how many times these ranges works or not. You can look to my profile and you will see many successful trades and also unsuccessful ones. Yes there is also losses. We are humans and we make mistakes. So forget about holy grail, but if you want to learn something there is no better way to learn than on live examples.
Here are charts with current ranges im seeing. With my Bias for the next week.
Go to your charts, find them and observe how the price action will develop. Might you find something to your trading arsenal.
🧪 DOLLAR- Monthly CLS range I Weekly CLS Range 🧪 GBPUSD - Monthly CLS range & Weekly CLS range 🧪 EURUSD - Monthly CLS range & Weekly CLS range 🧪 USDCHF - Monthly CLS range & Weekly CLS range Adapt useful, rejects useless ...
Thanks for readying. Have a great trading week.
David Perk aka Dave FX Hunter
BTC 30% Pullback: Local Floor is inBTC now at "Golden Pocket" Retracement Level:
The fact that a 30% pullback is coinciding with a Golden Pocket Fib Retracement paired with the current Macro conditions makes Long BTC at this level an asymmetrical bet.
Math / structure of the move
0.618 is the golden ratio, and 0.786 is roughly its square root – both come directly from the Fibonacci sequence. A pullback into 61.8–78.6% is deep enough to shake out weak hands and run liquidity, but not so deep that it fully invalidates the prior impulse. That makes it a natural “last chance” zone for trend continuation.
Orderflow & crowd psychology
A lot of traders, bots, and educational content focus on 0.618 / 0.786 as “golden pocket / OTE” style zones, so limit orders, stop orders and algorithms cluster there. In crypto, where retail TA is everywhere, this becomes self-fulfilling: price often spikes into 0.618–0.786, sweeps stops, then reverses.
Sneak Peak of the HTF Indicator I am developing for the upcoming launch of Glitch Capital . A multi-timeframe breakout- and trend-following Indicator Suite I will be launching soon.
Here you can see the Glitch Sniper Algo firing the first Buy Signals since this latest pullback. This is a sneak peak of another Indicator from the Glitch Suite I will launch soon:
30% drawdowns are normal in Bitcoin bull markets, not rare “black swans.”
A near perfect 30% pullback from ATH during a Bull Market is a known Phenomena during Crypto Bull Markets
Here’s how it looks historically:
2013 bull market: At least two 30–40% corrections on the way up.
2015–2017 bull market: Study of this cycle shows “at least nine large drawdowns” with an average correction of about 37% from peak to trough. Community analysis of the 2017 leg alone often highlights ~6 separate ~30% dips between 2016–2017 before the final top.
2011–2021 overall: About 13 drawdowns of more than 30% across that decade (bull + bear), underlining how routine deep pullbacks are in BTC.
Glassnode / market analysts: Repeatedly describe 30–40% corrections as “typical” in BTC bull markets, i.e. part of a healthy uptrend rather than a trend-break by default.
If you compress that into a rule of thumb:
In a strong Bitcoin bull cycle you can easily see several pullbacks of ~30%+, roughly every few months. So when you see a ~30% dip in a confirmed bull market, historically it’s been common and often buyable, not an automatic end-of-cycle signal.

BTC CURRENT DECODED ANALYSIS DECODED CURRENT ANALYSIS
Below $93,576 it has entered the danger zone ⚠️
An uptrend is only possible above $112,000 for the current year.
It is too early to test its quarterly support.
Quarterly support is noted to be tested in Q4 2026 at $62,772.02. If it tests this quarterly support before time, it will return to test it again in Q4 2026. If it declines further, then $48,000.
All above supports at 85K and 78K are weekly supports.
This message is for educational purposes only.
Always DYOR.

BTC DECODED ANALYSIS REMINDER UPDATES BTC decoded analysis next support, Monthly support is noted at $68,021.7 before BTC tests the quarterly support at $62,772.02.
These supports were updated on Binance on May 27th, 2025, with a brief detailed reminder updated again on October 29th, 2025.
These decoded analysis details are also mentioned in my pinned post.
All my analysis is based on actual fact based skip supports with no predictions.
This message is for educational purposes only, Always DYOR.

Bitcoin Daily Analysis – 1H Timeframe Breakout Watch!
Hello dear traders! Hope you’re having a great week so far and starting it strong! 🌟
Let’s break down today’s 1-hour Bitcoin analysis.
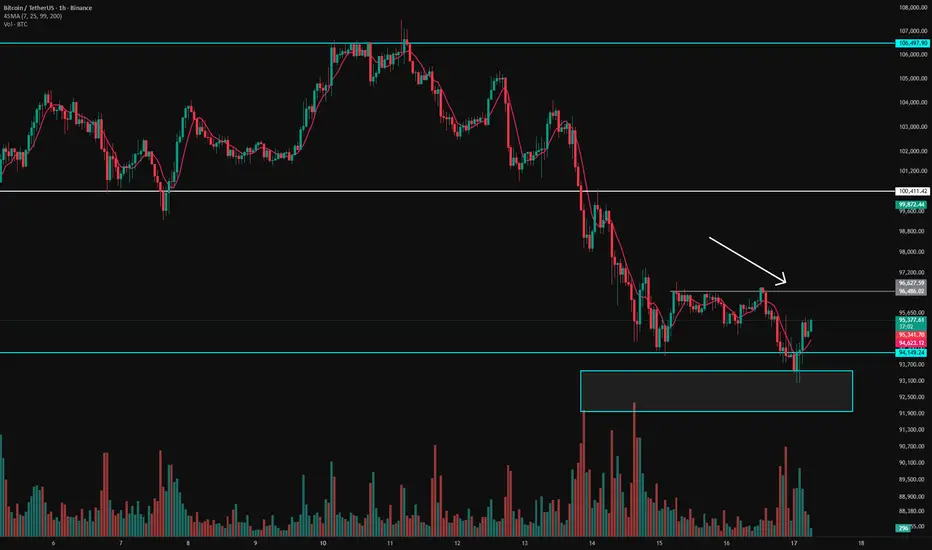
As you can see on the chart, BTC made a fakeout below the $94K level, and just like I mentioned in the previous analysis, this level is unbelievably important. If you haven’t checked that one yet, I strongly recommend taking a look — the conclusion was based on weekly support, resistance, and Fibonacci confluence. 📊✨
🔥 What Happened Today?
Even though sellers showed strong momentum with sharp-volume candles during the breakdown attempt,
they failed to reclaim $94K — buyers stepped back in and protected the level! 💪🟢
This is a positive sign for a potential short-term correction against the strong weekly downtrend we’ve been seeing.
BUT… higher timeframes still don’t give us a clean trend direction, so buyers must prove their strength once more.
That’s why I’ve marked a key level on the 1H chart:
➡️ $96,500
A break and 1-hour candle close above $96.5K could be the first real sign of a shift in structure — the first higher high + higher low setup on this timeframe. This level is important enough to justify a controlled, small-risk position.
⚠️ However… Be Cautious!
Short-term momentum still favors sellers, so it’s not a spot to take heavy risks.
I personally will use minimum risk if I take a position here.
📉 BTC Dominance (BTC.D) – Critical Factor
BTC dominance is super important right now.
Historically:
When BTC rises → Dominance drops → Altcoins pump harder 🚀
When BTC dumps → Dominance rises → Altcoins crash harder 💀
So it’s worth keeping an eye on alts during these moves.
🧠 My Personal Plan
I currently have one position on altcoins, and I will open another position on Bitcoin ONLY IF
➡️ 1H candle closes above $96,500
Why?
Because BTC dominance’s long-term direction is still unclear.
By splitting my risk between an alt and BTC, I increase my exposure without overleveraging or over-risking.
💡 My Recommendations for You
✅ First — NEVER trade without risk management.
✅ Second — This is NOT the time to take big risks.
Right now:
Monthly → buyers in control
Weekly → unclear
Daily → sellers in control
No side has a strong enough confirmation yet, so trade with caution.
Thanks for reading this analysis! 🌙
Always remember: the market has zero certainty. Your goal is to stay long enough in the game to build experience — that’s how you become consistently profitable.
I’d love to hear your thoughts in the comments below! 😊💬📊
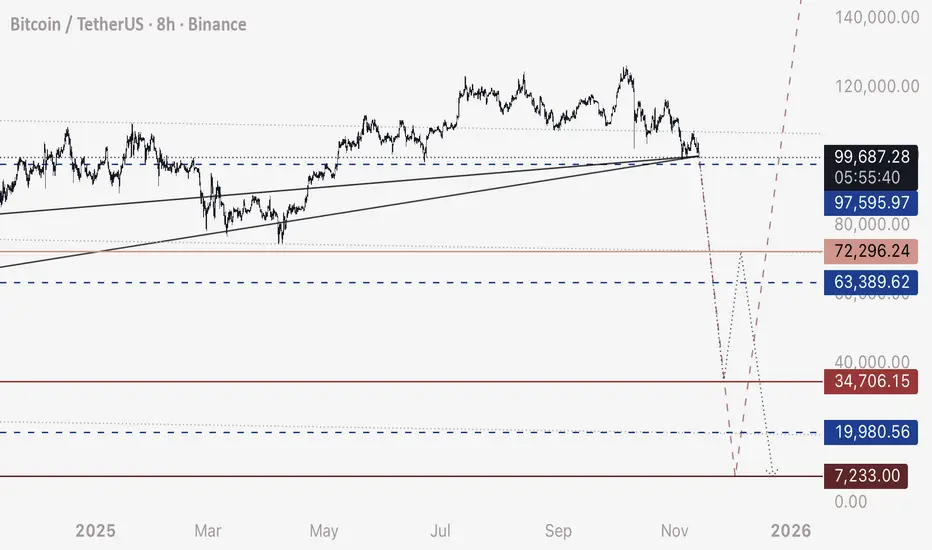
BTC - Ultimate Swing Short Update - Ready to Continue FreefallAs an update to my linked related signal post on “Ultimate Swing Short” - We are ready to freefall
Last major support has broken down.
Look for this 3 wave corrective drop:
100,000 to 35,000
35,000 retrace up to 72,000
72,000 to 8,000
Alternatively, it’s entirely possible we just freefall straight to 8,000 as all the long stop loss orders trigger one into the next.
Happy trading.
- DD
Bitcoin $BTC price analysis we need your vote !💥 Final “dip” of November?
💰 Will CRYPTOCAP:BTC drop to $91,600
to close that old GAP on the chart? 🤔
🟢 Bullish case: $100K holds → next rally begins.
🔴 Bearish case: gap fills near $91,600 → possible reversal after.
What do you think — final washout or just a pause before the next move?, vote at comments
______________
◆ Follow us ❤️ for daily crypto insights & updates!
🚀 Don’t miss out on important market moves
🧠 DYOR | This is not financial advice, just thinking out loud.

How much will Bitcoin fall?Bitcoin's future scenarios
Which scenario do you think is more likely?
Pay attention to levels and pricing
They can be decision points

BITCOIN → Flagship within the trading range BINANCE:BTCUSDT.P is trading within a wide trading range of 99K - 105K, with the market attempting to form an intermediate bottom at 101K. However, the trend is downward...
Bitcoin, within the downward trend, is rebounding from support at 101K and, against the backdrop of locally positive news, is striving towards resistance at 105300. However, the downward trend and the opening of the session far from the key zone of interest are negative prerequisites for the current situation. Within the daily rally, the potential for continued growth may be exhausted. There is a hunt for liquidity within the trading range. A retest of resistance may end in a false breakout and a decline in the trend...
Resistance levels: 105300, 107300
Support levels: 103000, 101130, 98900
The price is within the trading range, and there are no clear prerequisites for the price to break out of the current flat. Accordingly, I expect trading within these limits to continue. A false breakout of resistance (lack of momentum and potential for continued growth) could trigger a reversal of the local movement and a decline in price.
Best regards, R. Linda!

Bitcoin’s Drop From $125K: A Healthy Correction?The recent decline is largely a correction after BTC’s massive rally from $17K (Oct 2023).
Based on Fibonacci levels, the next key supports sit at $85K, $70K, and $60K — with $70K looking especially strong to me.
And yes… Bitcoin is officially 4-digit again.
#Bitcoin #BTC #CryptoAnalysis #Fibonacci #CryptoMarket

Bitcoin Analysis – November 21 | We Ride the Winner!Good morning everyone! Let’s jump straight into today’s BTC analysis.
But first… a quick lesson I’ve learned recently:
📌 We don’t predict the market — we prepare for scenarios and react.
Trying to guess the future only puts us behind. Our job isn’t to fight buyers or sellers…
We simply wait for them to finish their battle — then ride with the winner. 🚀⚔️
With that mindset, let’s break down the main possible scenarios:
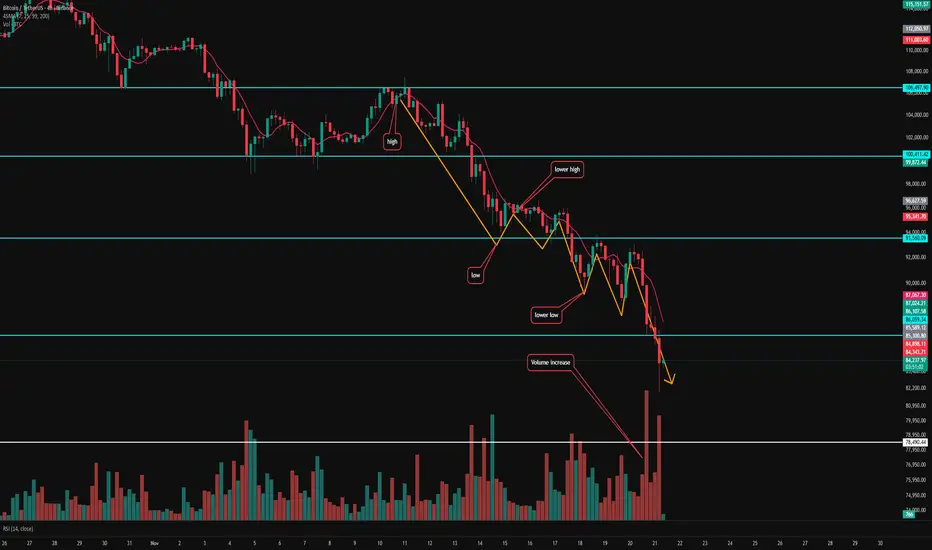
🟥 Scenario 1: Market Continues Under Sellers’ Control
On the daily and 4h timeframe, the trend is clearly bearish:
Lower highs & lower lows
Increasing selling volume
As long as the structure keeps printing lower highs/lows, the logical play is to follow sellers — waiting only for a clean trigger.
We’ve recently tapped into the $85K zone, but my line is outdated (drawn months ago).
I need a fresh reaction from this support area to validate it.
⏳ So I’m not shorting yet.
I’m waiting for a reaction — likely sometime this weekend when global markets are quiet — and then I’ll look for a short trigger.
⚠️ Right now is NOT a short entry for me.
Patience first. Trigger next.
🟩 Scenario 2: What if BTC jumps straight to $93,500?
Nothing changes for me.
As long as sellers dominate, I’m not opening any long on Btc.
Before considering a long position, I need:
At least one equal high + equal low (neutral structure)
And ideally a break into higher highs and higher lows
Until that happens — no longs for me.
🟦 Scenario 3: Range Formation
If the market ranges inside this zone, my short may get stopped out.
But honestly… that’s fine.
A range often builds a strong structural base — and once the direction becomes clear, I’ll simply follow the confirmed trend.
📌 Final Note
Please don’t underestimate risk management and capital preservation.
These scenarios help us stay objective — but discipline is what keeps us alive in the long run.
Thanks for reading my analysis!
Wish you all a great and profitable day. 🚀✨
I came back stronger and more powerful than ever.
Prepare yourself for big drops as the uptrend is weaker and the weakness in the trend is quite evident.

BTCUSDT - Daily
We can clearly see that Bitcoin’s bullish impulses have been losing strength over time. Each upward wave is forming with a smaller angle, showing a gradual reduction in momentum.
Such behavior often signals that the market is entering a mid-term or even long-term correction/consolidation phase, where price needs time to rest and regain energy before any potential continuation of the larger trend.
Bitcoin is testing the lower boundary of its ascending channel. If this support doesn’t hold, the probability of an extended sideways or corrective structure becomes higher.

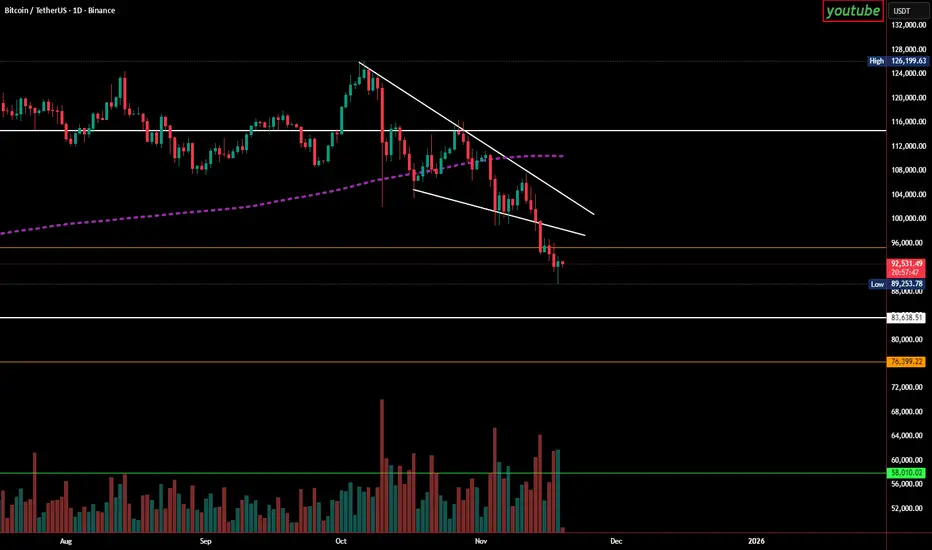
Bitcoin Hit $126,199 I Warned It Was the Top While Others Call..When Bitcoin surged to $126,199, nearly every major voice on social media was calling for the next leg up toward $200,000. I wasn’t one of them. While the hype machine kept pushing bullish narratives, I publicly warned that the move looked exhausted and that we were likely witnessing the cycle top.
Now, the chart is proving that call right.
Key Levels Are Breaking
Since topping out, Bitcoin has fallen below several major support levels — including the critical $95,000 zone. The technical structure has shifted decisively:
Trend has turned downward
Momentum has weakened
Sellers are dominating volume
Price continues to make lower lows
This is not what a path to $200K looks like — this is what a post-top correction looks like.
How Low I Believe Bitcoin Can Drop
Based on the current trend, market structure, and historical behavior after previous peaks, these are the realistic targets I’m watching:
$89,000 – initial support already under pressure
$83,000 – a major demand zone
$76,000 – deeper correction range
$58,000 – full cycle flush if panic accelerates
These levels aren’t guesses. They’re grounded in technical analysis and the same signals that helped me call the top at $126K.
I Went Against the Crowd — And It Paid Off
While most influencers kept telling their followers to buy, I warned that the upside was limited and that a sharp reversal was coming. The market is now validating that call.
My Outlook
Bitcoin is still the dominant asset in the crypto market, but the current pattern suggests more downward pressure before any meaningful recovery. For the trend to flip bullish again, price would need to reclaim key levels and break out of the descending structure.
Until then, the chart continues to follow exactly what I warned about:
The top was in at $126,199 — and Bitcoin was never going straight to $200K.
#BTC – Isn’t it time to buy?#BTC – Isn’t it time to buy? 🚀
By analyzing market structure and outside news, BTC is approaching the zone where I’d seriously consider entering .
📍 88k–76k is the key range I’m watching for potential buys, aiming for 15–40%+ profit with a 15% stop los s.
⚡️ Important: Wait for LTF entry sign – don’t jump in blindly . Always do your own research before making a move.
#CryptoTrading #Bitcoin #BTC #ScalpTrading #CryptoAnalysis #BTCScalp #CryptoStrategy #TradeSmart #HODL #BitcoinAnalysis

BTCUSDTP. - November 18, 2025Price is pulling back toward a clear support zone around 93,000, with a deeper support level near 92,000, while the nearest resistance sits around 96,200 along a descending trendline. The chart suggests a possible bounce from support toward resistance, but a break below 93,000 could open the way toward 92,000.
If trading this setup, the long scenario is higher-risk, as price is currently trending downward into support and could continue lower before reversing.


BTCUSDT.P - November 20, 2025The chart shows a clear downtrend marked by descending highs and lows, with price currently heading near a key horizontal support around the 88,000 level. A descending trendline acts as overhead resistance, while the shaded area near 92,000 represents a notable resistance zone. Price action suggests two possible outcomes: a bearish breakdown below support could extend the decline toward 85,000, while a successful breakout above the trendline may trigger a reversal toward 92,000 resistance. Momentum currently favors the bears as the market retests support after sustained selling pressure.

Bitcoin | 3 Hrs | Long | Target: 107kThis technical analysis is for informational and educational purposes only. It does not constitute financial advice. Remember to always research and consult with a professional before making investment decisions. Good luck! 📈💼🚀

Bitcoin viewThe chart shared illustrates as per Elliott Wave analysis setup combined with supply and demand (selling/buying) zones. Here’s a breakdown of what’s shown:
🧩 Elliott Wave Count
The labeling (A (a-b-c)–B (a-b-c)–C (1-2-3-4-5) (1–5) now we are in C(1-2-3-4-5) where we have completed C-3 Wave heading too C-4 Wave
🔹 Key Components:
Wave (a)-(b)-(c):
Indicates a corrective pattern (ABC Zigzag) where (c) is likely completing or nearing completion.
Waves 1–5 (in yellow):
Represent a downward impulse, possibly forming Wave (c).
Currently, it seems price is in Wave 4, with Wave 5 expected to follow downward toward the “Buying Zone.”
💰 Trading Zones:
Selling Zone:
Marked around the Wave 4 retracement area — typically a good place for short entries if price rejects this region.
Buying Zone:
Below, where Wave 5 (and (c)) is expected to complete.
A potential reversal area where buyers could step in.
Always follow Price-Action
⚠️ Disclaimer
This analysis is published here is for educational and informational purposes only. It does not constitute financial advice, investment recommendation, or a solicitation to buy or sell any financial instrument. All ideas and analyses shared here reflect the author’s personal opinions and are not endorsed by TradingView. Trading and investing carry significant risk of loss and may not be suitable for all investors. Always do your own research and consult a licensed financial advisor before making any trading decisions. The author and TradingView are not responsible for any losses arising from the use of this information.
