BTC 4H Breaking Downtrend, Push Toward $117K and $124K? Bitcoin has broken through downtrend resistance after weeks of lower highs, now testing the $110K demand zone for confirmation. Holding above this area sets the stage for continuation toward $117.5K, with extended upside potential at $124.5K.
Liquidity sits lower at $107.5K, which could be swept before the move higher. Meanwhile, the Stoch RSI is in overbought territory, signaling possible short-term pullback, while the MACD Liquidity Tracker is showing momentum recovery from oversold conditions.
Key levels:
– Demand Zone: $110K
– Liquidity: $107.5K
– Targets: $117.5K and $124.5K
BTCUST.P trade ideas

LETS GIVE BTC A LITTLE BREAK SHALL WE, LET IT BOUCE A BIT, YEAH Expect a bit of bounce from this point !! Retailers have sold all their coins and now MM is gona buy back from these poor souls. BUT the end is inevitable for the ALGOS have spoken (Sorry about the messy chart guys, didn't get the time to clean it up!)

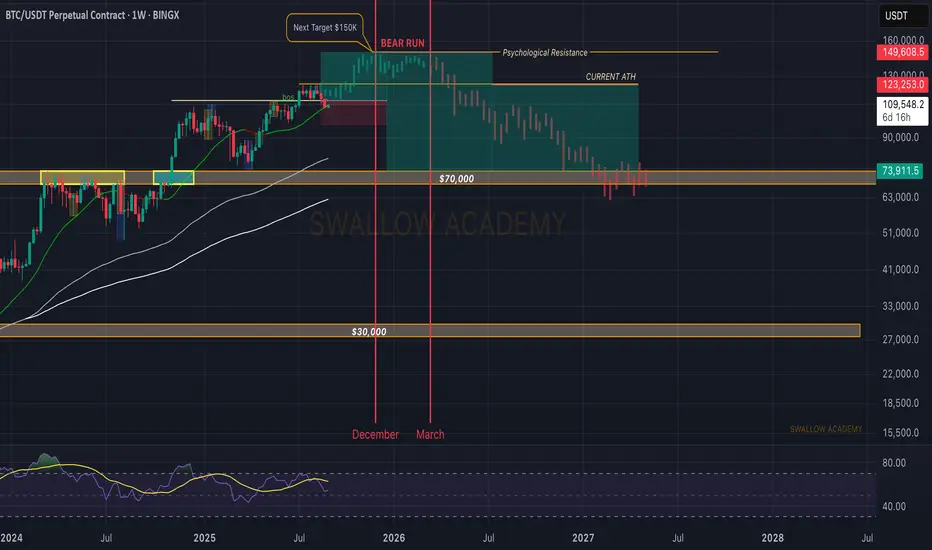
Bitcoin (BTC): Entering Q4 | Targeting $150K On the weekly timeframe, Bitcoin continues to respect the 100EMA and 200EMA, with market price steadily dragging both indicators higher.
This week opened with a retest of the Bollinger Bands middle line, which acted as dynamic support and provided a solid bounce — an early sign that buyers are still in control (though the week is just getting started).
As we move into Q4, we expect liquidity to rotate from BTC into ETH, reducing Bitcoin’s dominance. That doesn’t mean BTC won’t print fresh ATHs — we’re still looking for a push into higher zones — but ETH will deliver bigger gains in this phase.
Our upside target for BTC remains at $150K before the next bear market cycle begins.
Swallow Academy
03-09-2025 BTCUSDT As shown in the figure: 30M Bearish Shark
The market is not always chaotic and disorderly, and there is a precise geometric beauty hidden in price fluctuations. The harmonic form long strategy is a powerful tool for accurately identifying potential market reversal points based on the Fibonacci ratio. When the form forms perfectly at the key support level, it often indicates the depletion of bearish momentum and the initiation of bullish trends.

BTC TO 62K!!! AWARE !In this special global conditions BTC is overvalued, institutional inducing FOMO, BTC fake out to 120k, real value is 62k.
Do your own work.


For Intrday trader's #bitcoinHello Trader's
Can you tell which side market will move from this candle..
Only for Intrday trader's
Only for learning purposes..

BTC 1H Analysis - Key Triggers Ahead | Day 31💀 Hey , how's it going ? Come over here — Satoshi got something for you !
⏰ We’re analyzing BTC on the 1-hour timeframe timeframe .
👀 On the 1-hour timeframe of Bitcoin, we can see that after activating the alarm zones we had mentioned in previous analyses, Bitcoin moved upward and is now in a range and compression in its multi-timeframe structure, which with the New York session open could break out of this compression.
⚙️ The key RSI zones are 64 and 50. Once the oscillation limit crosses these zones, Bitcoin could break out of this compression. Preferably, follow long trades when the oscillation limit is crossed.
🕯 The size of green candles on the 1-hour timeframe is almost getting bigger with increasing volume. We are in a relatively important zone where, with the increase of candle size and volume, Bitcoin could move upward.
📊 On the 1-hour timeframe of USDT.D , we can see that after losing the 4.44% zone and the buyers’ money running out, it has faced a temporary trend weakness. With the New York session open, it could continue its decline. Notice that Tether dominance is also in a compression state both in terms of volatility and the RSI oscillator, in a decision-making mode. Confirmation of breaking the 4.44% zone could mean the loss of the 38 support level.
🔔 The trading alarm zones for Bitcoin are at $111,664 for long and $110,666 for short. Preferably, I’m not considering short trades these days, but I do think about opening a long position on a pullback or breakout of $111,664, and if the price action behavior suits such a trade, I will take action.
❤️ Disclaimer : This analysis is purely based on my personal opinion and I only trade if the stated triggers are activated .

BTCUSDT 4H Update The last dip triggered massive long liquidations and tapped into parts of the green demand zone. Currently, a potential **W-pattern / double bottom** is forming while price is holding above **110K** – an initial bullish signal.
🔑 **Key Levels**
* **Resistance:** 113.465 – 114.416 \$ (Breakout Zone) | 116.834 \$ (CME Gap) | 118 – 120K (Major Short-Liq Zone)
* **Support:** 107.2K | 104 – 102K (200 EMA Daily + CPR S1)
📊 **Conclusion:**
As long as BTC holds above **110K**, the chance of a sustainable breakout remains. A confirmed trend reversal would only be validated above **113.5K**, opening the way towards **116–118K**. Below **107K**, the risk increases for a retest of the **104–102K** support range.

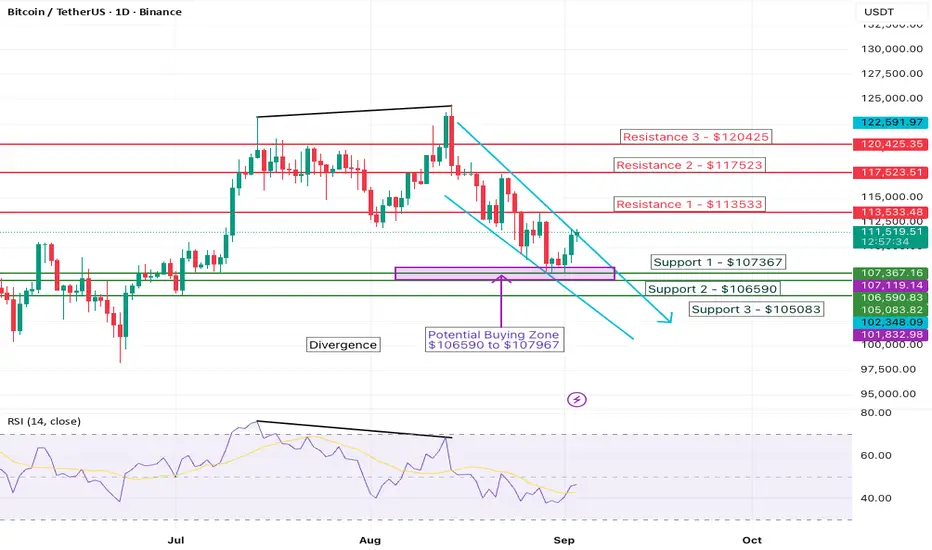
Bitcoin Breakout: Bull Run Starting or Just a Fakeout?Bitcoin (BTCUSDT) has been locked inside a bearish channel since the RSI divergence played out earlier this summer, dragging price into correction. But now things are heating up — BTC has broken the upper channel trendline, showing the first real signs of bullish momentum. RSI is still sitting below 50, signaling caution, yet leaving space for buyers to step in. The big question: is this the start of a new bullish wave, or will Bitcoin stall at resistance and retest support?
Technical Analysis:
📉 Previous Divergence: The bearish divergence marked earlier worked perfectly, sending BTC lower.
📊 Current Setup: BTC has now broken out of the channel — a bullish sign, but confirmation comes only if price holds above $113,533 (Resistance 1).
🔑 Support Levels: $107,367 → $106,590 → $105,083
🔑 Resistance Levels: $113,533 → $117,523 → $120,425
🎯 Potential Buy Zone: $106,590 – $107,967 (if support holds).
📈 RSI (14): ~46 — below 50 but turning upward, hinting at possible accumulation.
Fundamentals Supporting the Bullish Case:
✅ ETF Demand: Spot Bitcoin ETFs continue to attract billions in inflows, with BlackRock and Fidelity leading. A single day recently saw $1.18B of inflows, pushing BTC higher and squeezing shorts.
✅ Post-Halving Scarcity: The 2024 halving cut miner rewards by 50%, reducing new supply. With 70% of BTC held by long-term holders, supply on exchanges is extremely tight.
✅ Macro Tailwinds: Softer U.S. economic data and potential Fed rate cuts have lifted risk assets, fueling demand for BTC as a hedge.
✅ Institutional Recognition: Bitcoin is increasingly treated as digital gold. Even the U.S. has announced a $120B Strategic Bitcoin Reserve, boosting credibility and long-term confidence.
Do you think Bitcoin’s breakout is the start of a true bullish reversal 🚀 — or will bears push it back to support before the next big move?
#BTC #BTCUSDT #Bitcoin #Crypto #Cryptocurrency #CryptoTrading #CryptoAnalysis #BitcoinPrice #BTCPrice #BitcoinChart #CryptoCharts #TechnicalAnalysis #TA #RSI #Trading #TradingView #ChartAnalysis #PriceAction #CryptoSignals #CryptoTraders #CryptoNews #CryptoCommunity #CryptoWorld #BTCAnalysis #BTCUpdate #CryptoInvesting #CryptoMarket #BitcoinUpdate #CryptoBullish #CryptoBearish #BTCResistance #BTCBreakout #BTCBullish #BTCBearish #SupportResistance #CryptoTrend #CryptoSetup #CryptoTradingSignals #BTCSetup #DigitalGold
⚠️ Disclaimer
This analysis is for educational purposes only and does not constitute financial advice. Trading cryptocurrencies involves high risk; always do your own research and manage your risk accordingly.

BTC 1h long trade based on Dow theoryBTC 1H
Trend Up
Divergence NO
Reasons : closed above the trend line
BPR formed at fib 0.50 level
buy limit : 110072
SL : 108250
TP : 112340

Will September be a good month to buy more BTC?As I look at the chart today, I see BTC price trying to break from the descending channel I drew on the 13th of August. I know that everyone calls September the worst month for trading and they advise to stay put and wait for next month, but I see September 2025 as its starting in green as the opportunity to increase my exposure in BTC and buy the coin as it dips.
We had a new ATH in August and after two weeks we did see how the price of Bitcoin went through a brief correction and now it looks like it reached the resistance level at 107K and it's going through phase of consolidation. The price is bouncing now between 109K and 111K in the short term and 107K and 114K in the medium term. Why? Because there is no narrative powerful enough to push the needle one way or another. Remember - crypto market is all about emotions and narratives.
So from my point of view the next powerful narrative which will push the market will be FED's chairman announcement on 17th of September. And the common consensus is that the speech will be a positive for the markets. Thid means continuation of the bull run in October and it will set up solid fundament for new ATH in Q4 as the money will start flowing into the global markets.
So now I am planning to spent small sums of my cash to buy the dips and to wait for the moment when the greed will return and with it the price of BTC will start rising again

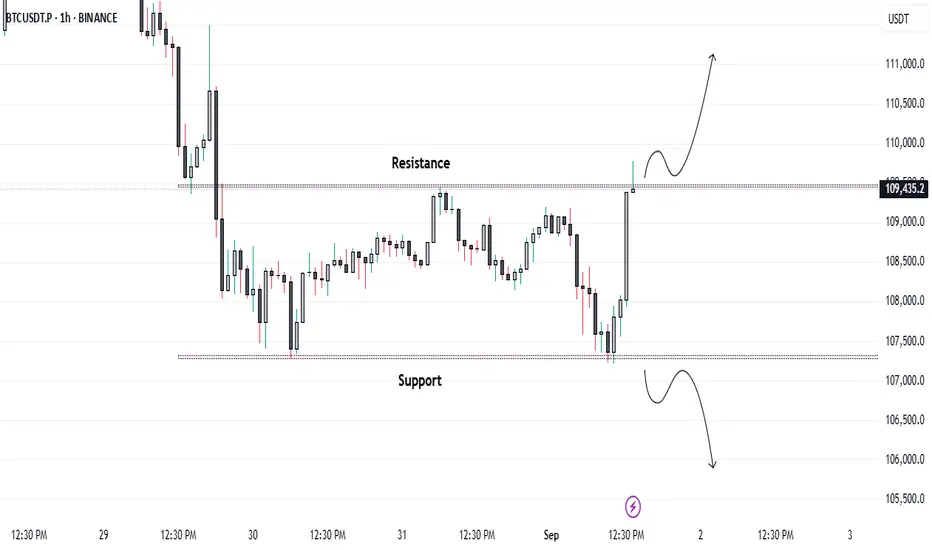
Bitcoin Breakout Watch: Key Levels Ahead...Bitcoin is consolidating in a tight range on the 1-hour timeframe and is showing strong momentum as it tests the $109,500 resistance zone. A decisive breakout and sustained close above this level could trigger a move toward the $112,000 mark, signaling bullish momentum building in the market.
Keep a close watch on volume confirmation for a stronger breakout signal. 📈
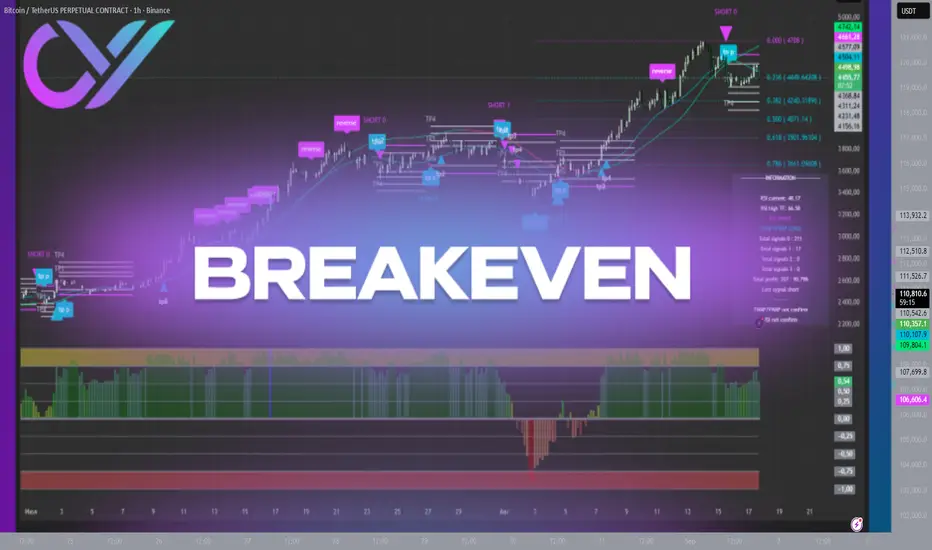
What is Breakeven"In trading, every step is about risk management. Any position can end in profit or loss, and the trader’s task is to minimize the latter. One of the most debated techniques in this field is moving the stop-loss to breakeven. For beginners, it raises many questions: when should it be done? is it always correct? does it limit profits?
What is Breakeven
Breakeven is the level at which a trade closes without profit and without loss. The trader locks in zero result, preserving capital and avoiding risk if the market suddenly turns against them. Technically, this means the stop-loss is moved to the entry price after the position moves a certain distance in the trader’s favor.
The essence of the technique is to remove the worst-case scenario — taking a loss when the plan fails.
Why Move the Stop to Zero
The main benefit is psychological. While the stop is in the red, a trader feels tension: every fluctuation could knock them out and cut their capital. Moving to breakeven removes that pressure. The trade becomes “free”: it’s either profit, or nothing. This creates calmness and focus for further decisions.
Another aspect is discipline. Breakeven builds the habit of protecting capital. Many traders lose money not because their ideas are bad, but because they lack rules for managing trades. Breakeven enforces discipline and reminds: the priority is not giving more to the market than you planned.
When to Move the Stop to Zero
This is where most beginners go wrong. Moving to breakeven too early means not allowing the trade natural space to breathe. The market almost never moves in a straight line — it pulls back. If the stop is too tight, the position gets closed at zero, and then price continues in the expected direction.
Experienced traders only move stops after price crosses a meaningful level that truly confirms trend strength. This could be:
- a breakout of a significant support or resistance;
- consolidation above a local range;
- reaching the first target level (TP1).
That way, breakeven is not a random act for calming nerves, but part of systematic trade management.
Why Breakeven is Not Always the Best Choice
While useful, the technique has a downside. Moving stops too frequently or too early often leaves traders with “nothing trades” — positions closed at zero while the market later moves in their favor. This slows capital growth.Professionals use breakeven selectively, and always as part of a broader risk and position management strategy. Sometimes it’s more profitable to leave a stop in the red but beyond the level that truly invalidates the scenario. That gives the market room to develop while keeping risk under control.
How to Integrate Breakeven Into a System
Breakeven is not a universal rule, but a tool. To use it effectively, a trader should:
- predefine conditions for moving the stop (e.g., only after TP1 is reached);
- avoid emotional rushes;
- consider market structure and trend strength;
- combine the technique with technical analysis: levels, volumes, candlestick patterns.
With a system in place, breakeven becomes part of the bigger picture rather than a random “just in case” action.
Automation and Cold Logic
The hardest part is that the decision to move a stop is often made under emotional pressure. A trader sees a small retracement and quickly protects themselves. But emotions are exactly what rob good trades of their potential. The solution comes with algorithms. Tools that highlight key levels, guide trade management, and allow partial profit-taking remove emotional bias. A machine doesn’t panic, doesn’t get greedy, and doesn’t hesitate. It follows conditions with statistical precision. In this framework, breakeven is no longer an emotional gesture but a logical step: price broke a level, consolidated, scenario confirmed — the stop is moved.
Conclusion
Breakeven is a powerful risk management tool, but only when used as part of a system. It protects capital, reduces psychological pressure, and builds discipline. But moving stops too early or chaotically can block profits and turn strategy into randomness. In trading, winners are not those who know the most, but those who can keep a clear head and trust the plan. When rules are predefined and tools help visualize the market and control key levels, every decision becomes deliberate. That’s what separates a professional from a gambler."
BTC / USDT : Falling wedge breakout confirmedBitcoin (Update)
BTC has confirmed a breakout from the falling wedge pattern. After some consolidation, we anticipate a strong bullish move toward the $124,000 zone.
Keep it on your radar — breakout confirmation is in place, momentum could build quickly. Always manage risk in volatile conditions.

BTC analysisHello everyone,
Bitcoin has the potential to climb to the 115,000-116,000 range in the short term, given its classic support and resistance range of 107,400-109,200, reaching the decisional order block and confirmation of a change of character in the lower timeframe.

BTCUSDT ICT-Based Analysis1. Market Structure
We can clearly see a series of lower highs and lower lows forming since mid-August → indicating short-term bearish structure.
Recently, price reacted from the ~108,000 zone and is now pushing upward (current ~110,365).
👉 This looks like a short-term retracement inside a bearish structure.
2. Liquidity Pools
ICT always looks at where liquidity is resting:
Below: There’s resting liquidity under 108,000 & 106,500 levels (equal lows & consolidation points). Market makers may target this later.
Above: Clean equal highs around 112,500–114,000 zone → liquidity magnet on the upside.
👉 So both directions have liquidity, but price will usually seek one side first before reversal.
3. Fair Value Gaps (FVGs / Imbalances)
On the recent drop, large inefficiencies were created between 111,200–112,000.
Current upward push may be filling that imbalance.
👉 This means BTC could climb into that FVG before deciding next move.
4. Order Blocks
Bullish OB: Around 107,500–108,200 (previous demand where price bounced).
Bearish OB: Around 112,000–114,000 zone (last bearish move before drop).
👉 Expect price to revisit OB zones for confirmation before direction is decided.
5. Current Situation (ICT POV)
Market is retracing upward into imbalances + liquidity pools above.
Likely path: Sweep upside liquidity (112k–114k) → then potential downside continuation toward 108k or lower.
BUT if price closes strong above 114k, it shifts market structure bullish and could trigger expansion higher (towards 118k).
🎯 Trading Scenarios (ICT style)
Bullish Scenario (Short-term)
Price fills FVG toward 112k–114k.
Watch for confirmation inside bearish OB → rejection possible.
Bearish Scenario (Likely after liquidity grab)
Sweep highs (112k–114k) → rejection → downside liquidity hunt toward 108k–106.5k.
Invalidation
If 4H candle closes above 114k with displacement, then bearish idea is invalid → market structure shifts bullish.
📌 Conclusion (ICT view):
Right now BTC is in retracement phase → aiming for 112k–114k liquidity + imbalance fill. After that, smart money may take price lower to clean liquidity below (108k–106k). Only a strong close above 114k changes this bearish bias. BINANCE:BTCUSDT

BTC on the beat :))))everything has gone according to analysis. I hope you have enjoyed the sell positions. Make sure to save profit and manage your positions or make them risk free.

Shampoo Trading102-105k bounce into macro lower high (116-120k) before 88-93k before right shoulder into 106-108k previous range high into 60-70ks (last cycle all time high) into fake breakdown/chop before moon to 7 figures.
HTF Head & Shoulders price action.
GLHF.

#BTC/USDT Technical Analysis – 4HBINANCE:BTCUSDT Technical Analysis – 4H
MARKETSCOM:BITCOIN is forming a Harmonic Cypher pattern, which usually signals a potential bullish reversal from the D-point completion zone. After an extended corrective move down from the recent highs, BTC has now reached the D level (~108,000), aligning with harmonic completion and RSI showing a bottoming signal near 37.8.
🔎 Key Trade Plan
Entry: Instant (near current levels ~108,800)
Stop Loss: 105,033
Take Profit 1: 113,472
Take Profit 2: 118,938
Extended Targets: 125,000 and 141,000 (if momentum sustains)
📈 Outlook
The Cypher pattern suggests that BTC may have completed its retracement leg and is preparing for a bullish continuation.
RSI has already printed multiple bullish signals at lows, supporting the case for a rebound.
Initial resistance lies around 113k–114k, and a break above this level could accelerate the move toward 118k and beyond.
✅ Conclusion: BTC/USDT on the 4H timeframe is showing a bullish harmonic setup, with strong reversal potential from the Cypher completion zone. Traders can position long with stops below 105k, eyeing targets from 113k to 141k in stages.

$BTC: -$4000 in 10min – panic or opportunity?Here's our take:
🔹 Historically, such sharp CRYPTOCAP:BTC drops used to cause -20% to -40% crashes in altcoins.
Now, some alts are holding, others correcting mildly, and a few are even rallying.
🔹 In the last 24 hours, $840M was liquidated.
Roughly 80% were long positions.
Historically, reversals often start after $1.1–1.3B in total liquidations.
🔹 BTC Dominance (BTC.D) and Tether Dominance (USDT.D) are forming readable, consistent patterns.
👉 Current thesis: OKX:BTCUSDT will likely continue its movement inside the falling purple channel.
If price reaches $107–108K, we’ll consider closing our short bot to reassess market conditions.
💬 What’s your perspective? Share below.
______________
◆ Follow us ❤️ for daily crypto insights & updates!
🚀 Don’t miss out on important market moves
🧠 DYOR | This is not financial advice, just thinking out loud.

What is going on with BTC? Psychology of loss :(🚨 Bitcoin Price Update
We’re at a super interesting spot in the market right now ⚖️. BTC is giving us both bullish & bearish signals 📈📉. Bulls are pointing to institutional accumulation and macro tailwinds, while bears see warning signs in recent volatility and sharp pullbacks. In short → we’re preparing for all possibilities. Stay flexible, not biased! 🧠💡
🧩 The Psychology of Loss in Trading
Every trader faces losses—it’s part of the game 🎲. But how you perceive those losses will decide how far you go in your trading journey 🚀. Many traders go through 5 stages when losing money:
1️⃣ Denial – “This trade will bounce back, I’ll just wait…”
2️⃣ Anger – “Why me?! The market is rigged 😡”
3️⃣ Bargaining – “If I move my stop loss just a bit…” 🤔
4️⃣ Depression – “Maybe trading isn’t for me 😞”
5️⃣ Acceptance – “Okay, lesson learned. Let’s refine the plan 📑✅”
🎯 Key Takeaway
Losses should never be internalized as an ego hit. They’re not proof you’re a “bad trader”—they’re data points 🧮. Each loss is feedback you can use to:
Improve your risk management 🛡️
Refine your strategy 🔧
Understand market conditions better 🌍
Think of losses as tuition fees you pay to the market—painful, but they buy you growth 📚✨.
🔥 Final Thoughts
Bitcoin is in a decision zone ⚡—so stay sharp, manage risk, and remember: your progress depends not on avoiding losses, but on learning from them. 💎
