BITCOIN -28% Correction NOW! But bounce back!Bitcoin will correct to 200 days moving average and use it to bounce back to new ATH about 150/200k in 2026.
Don't worry it is a health correction and what doesn't go up, goes down!
But can always go up again!
Don't doubt it, market will go against your beliefs, and that is normal!
Cheers
Trade ideas

BTCUSD The 114k decision line for the week of Nov 3 to 7One chart. One plan. You can trade the first week of November with a simple map built around one decision area. The band at 112.9k to 114.5k is the gate. Above it, momentum can breathe. Below it, treat strength as suspect and keep risk tight. The Friday close was 110,050 which keeps price right in the middle of the range and sets up a clean reaction trade into the new week.
What to draw on your chart
Zones
• 112,900 to 114,500. Decision band and prior late October highs.
• 109,800 to 108,800. First support shelf from the last pullback cluster.
• 107,200 to 106,400. Deeper support if the week turns risk off.
• 118,000 and 121,700. Extension targets if buyers control the week.
References
• Add a 50 day and a 200 day moving average on the daily chart for context. Treat the 200 day near the 109k area as a health check. Lose it and fail to reclaim and the swing bias flips cautious.
• Add a 20 day ATR read on your platform. Current context is about four percent. I size stops and targets from that number.
Why now
The tape gets several event tests in one week. Manufacturing PMI on Monday. Services PMI plus the Treasury quarterly refunding details on Wednesday. The United States jobs report on Friday at the usual morning slot. These three items move the dollar and the long end of the curve which in turn moves crypto risk appetite. When the dollar eases and the ten year cools, Bitcoin usually gets running room. When the dollar spikes and yields lift, bounces fail faster. You do not need a complex model. You only need a clear reaction plan and the will to stay patient until your trigger shows.
How to trade it
Use an ATR based framework. With ATR near four percent, half ATR is about two percent and one and a half ATR is about six percent. These are round figures and they keep your plan honest.
Three rules for the week
• Breakout rule. Take longs only on a 30 minute close above 114,000 with the next candle holding above 113,800. Stop equals half ATR. First take profit equals one and a half ATR. Trail the rest by one ATR. If the daily session closes back under 112,900 you stand aside and reassess.
• Range fade rule. If price tags 114,000 and fails with weak breadth or tired momentum, fade back toward 112,900 with a tight stop above the rejection wick. Scale out near 111,800 to 112,200. Stand down if the dollar softens and yields fall during the move since that flow can squeeze fades.
• Failure rule. A daily close under 109,800 is a risk off signal for swing longs. Respect the shelf at 108,800. If it breaks and cannot reclaim, look for price discovery toward 107,200 to 106,400. Only step in again on a stop run and clean reclaim pattern.
What I need to see for momentum
A decisive reclaim and hold above the 114k band.
Dollar index pushing through the prior session low or at least failing to bounce with energy.
Ten year yield not making new session highs during the break.
Intraday pullbacks that respect one ATR trails without heavy wicking.
If those four items happen on the same day, 118k is the first reasonable extension. The second extension sits near 121.7k where the last impulse ran out of steam.
What tells me the idea is wrong
A strong dollar and a hot yield print with BTC unable to lift through 112.9k.
A fast push above 114k on thin liquidity that gives back the level within two or three candles.
A daily close under 109.8k that comes on rising volume. In that case the path of least resistance shifts to a deeper test and the best trade may be no trade until the next reclaim signal.
Risk template you can copy
• Stop: half ATR from entry.
• First target: one and a half ATR.
• Remainder: trail by one ATR.
• Size: risk a fixed R per trade so that a full stop equals your planned loss for the session.
• Events: flatten or cut size to half R at least ten minutes before each major release. Re engage only after the first full post release candle closes.
Mindset for the week
Keep the number of trades small. Let the 114k band answer the only question that matters. Are buyers willing to pay higher prices or not. If yes the job is to stop fighting and ride the extension. If not the job is to protect capital and allow the market to come to your levels. Most of the damage in this market does not come from bad reads. It comes from over trading a chop. One plan and the discipline to sit tight can beat a dozen hot takes.
Chart checklist before you click
Is price above or below 114k on a 30 minute closing basis.
Is the dollar softening or firming during the push.
Is the ten year easing or lifting during the push.
Is your stop equal to half ATR.
Is your first target equal to one and a half ATR.
Have you sized for one R and set a hard daily loss limit.
Educational research only.

BTCUSDT – Potential Bullish Reversal from Daily Demand ZoneAfter a strong liquidation move to the downside, BTC tapped into the daily demand zone between 98,900 – 101,000, creating a deep wick and showing clear signs of absorption.
This level also aligns with previous liquidity pools and the last unmitigated demand area from late September.
Bullish Scenario
I expect price to form a short-term base here and start building higher lows.
A daily close above 103,450 will be my first confirmation that buyers have regained control and the reversal is valid.
If that happens, I’ll look for long entries in the 102,500 – 103,500 area, targeting the following levels step by step:
• 🎯 106,600 → first supply zone
• 🎯 111,000 → structural break and confirmation
• 🎯 113,500 → imbalance fill
• 🎯 116,300 → final resistance before the major high
• 🎯 126,000 → full target (previous swing high)
Invalidation:
A daily close below 98,800 cancels this setup.
⸻
Summary
BTC has collected liquidity below the previous monthly low and is now reacting from a key demand zone.
As long as 98,800 holds, I remain bullish, expecting continuation toward 116k–126k in the coming weeks.

Temporary correctionBTC 1W...
*Don’t be afraid of this drop, it’s a big surrender.
From a technical perspective, the $100,000 level is a key psychological area that the price needs to reach.
From a fear and greed perspective, the market is in absolute fear, which I think is the best time to buy short.
But my general view of the market is that at this point; it could even go below $100,000, and that’s where things get a little tricky. If buyers don’t show support in time, sellers could take control and push the price down to $93,000.
Don't forget that a positive divergence has formed on the daily timeframe, which could be a factor in the price increase.
Always be a buyer of fear and a seller of greed...

Btc 112500 is a critical level for btc with multiple touches already. I could go on about it's significance as a gann number but do the work. Long btc to 112.5k then say goodbye. I have been wrong before.

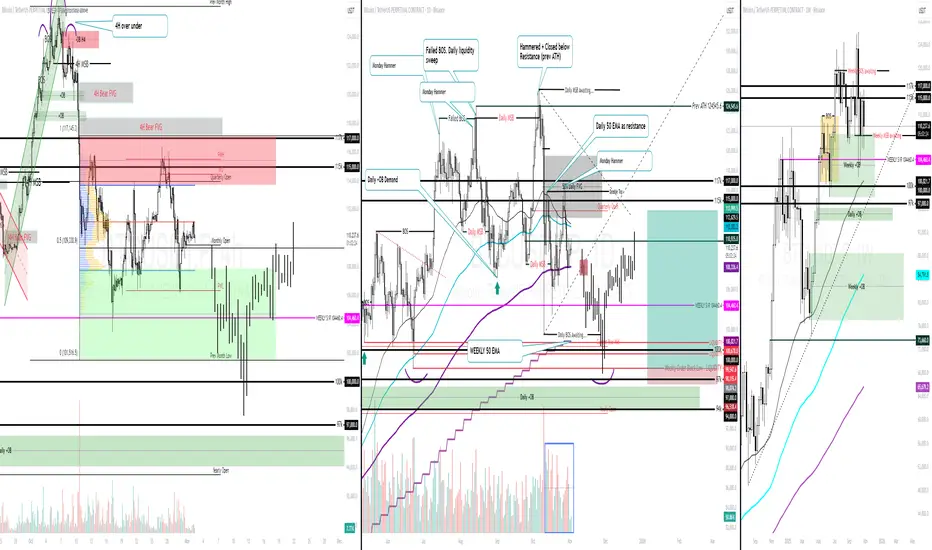
BTC Weekly Recap and Weekly PlansAs mentioned 3 weeks ago, the 4H liquidation candle has defined BTC’s range so far, with nearly three weeks of consolidation inside it.
Using a volume profile from that 4H liquidity candle to today, two key zones stand out:
• Support from VAL down to the candle low
• Resistance from VAH up to the candle high
On the daily, most of the volume within this zone leans toward sellers, showing clear supply pressure.
Additional daily signals:
• Monday closed as a hammer candle after filling 50% of the daily FVG, which is a bearish sign
• The 100 EMA and 50 EMA are close to a bearish cross
• Weak buy volume vs strong sell volume confirms aligned downside pressure
My bias remains the same. If BTC starts holding above 118K–120K, it won’t just break the supply zone; it would also show demand overwhelming supply despite 4H FVGs, opening the door for continuation higher. Otherwise, this zone remains a valid rejection area.
I’m interested in a swing long once daily liquidity below the lows gets taken, ideally around 100–99–97, where we also have a daily bullish order block.
I also consider that once the sloping lows trendline breaks to the downside, support weakens and price can accelerate into the interest demand zone below. If we get there, ideally we want to see that before the day closes, the daily BOS gets avoided to be printed
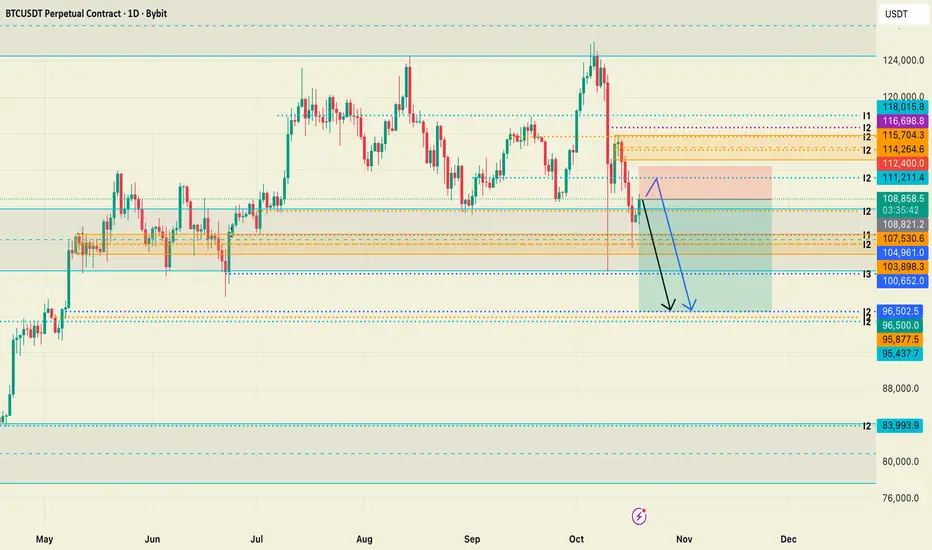
I expect a BTC drawdown on the daily timeframe.In the coming days, I expect a BTC drawdown on the daily timeframe to values of $96,500 to $95,400 from a price action perspective. I would enter a short position immediately, setting my Stop Loss (SL) above $112,400 and Take Profit (TP) at $96,500, which would represent a 3.44 Risk-Reward Ratio (RRR).
It is important to note that this is in no way financial advice, but merely my personal view on price action and my idea of where the price might go in the coming days.
One Final Run for Bitcoin?Bitcoin is getting hammered. But I think it have enough stamina for one final push to cycle top. My original target for the top is 135k-150k zone but I won't risk trying to catch the very top so my TP target is 133k. Hope it fell to 99k and trigger my long.

btcusdtAfter breaking the daily trend, the price is moving towards the opposite level of the daily trend, and on its way, the weekly trend has also been broken. If the price remains within these ranges and the weekly break consolidates, it will reach the lower levels of the weekly zone.

wait and watch for CME GAP UPHello Everyone, I see on daily we have to wait for CME gap up to be filled as I I see lot of volume sitting between 92k to 85k, close the weekly bottom trendline as well.

Bitcoin 1 day analysisBitcoin is at important reversal zone and almost started reversal.
A successful reversal will lead to $109000 and break from here will lead to $95000.
I view favors for upside. NFA DYOR

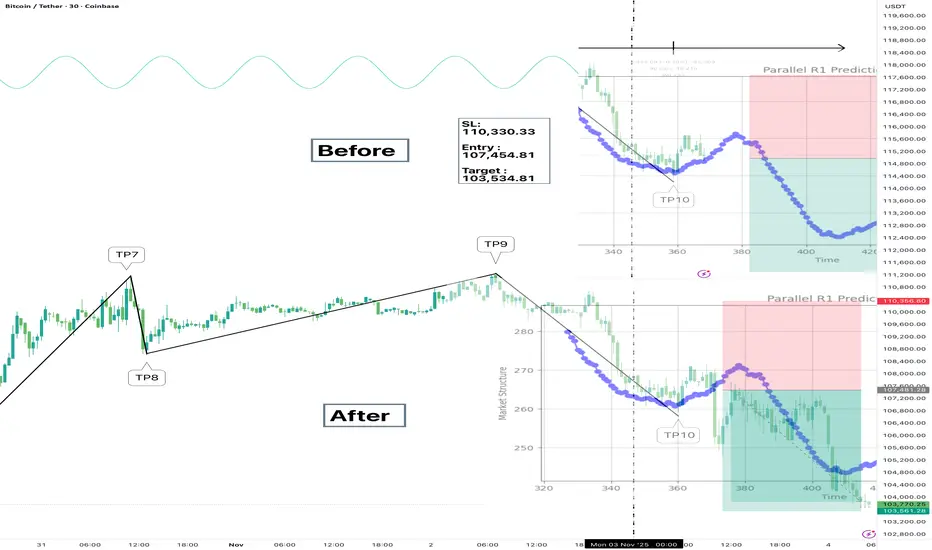
Another one for the books. AI driven Signals WINHumble brag: my MTOPS model signaled
entry at 107,454,
SL at 110,330, and
TP at 103,534 — exactly where BTC just hit.
Before: clean setup, textbook structure.
After: price respected every level like it was reading my mind.
Not luck. Just price action doing what it does when you listen.
Grateful for the wins. More to come.
BTCUSDT SellThe uptrend bottom has been broken and the market is pulling back to this level... Sell Sell Sell Only

BTCUSDT 4-Hour Chart Analysis. BTCUSDT 4-Hour Chart Analysis.
Current Pattern: BTC is in a falling wedge, with price making lower highs and lower lows, yet approaching the wedge’s support alongside the green demand zone ($102,000–$104,000).
Downside risk remains until the green zone ($104,000 area) is tested; strong support is expected there.
Resistance is at the upper falling trendline; a confirmed breakout above this would be bullish, with an upside target near $114,000–$123,000.
The chart projection suggests some more downside or sideways action, then a strong reversal if the green support holds.
If BTC loses the green zone, expect further weakness, but if price rebounds, a significant rally could follow.
DYOR | NFA

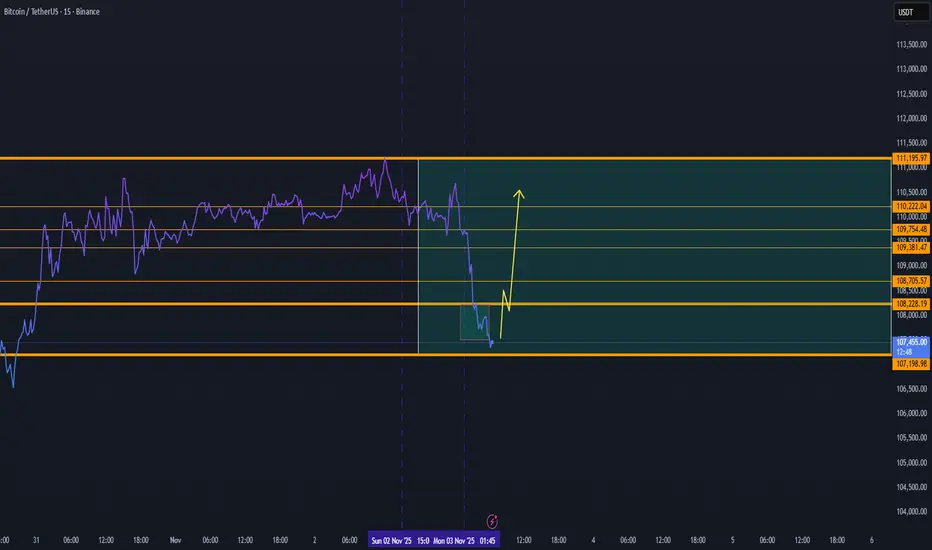
Scalp Long – BTC💎 Scalp Long – BTC
RSI is deeply oversold, especially on the 1H timeframe, signaling exhaustion of selling pressure.
Buying volume has reappeared, suggesting a potential retest of the 110,000 zone previously broken.
🎯 Plan:
→ Enter after confirmation of bullish reaction from support.
→ TP: 110,486 | SL: 106677 | RR: 1 : 3.8
Momentum favors a short-term rebound.
Keep entries precise, trail SL as price rises.
Patience and clarity — only execute once the setup confirms.

BTCUSDBitcoin dropring this week to test 100.000$
We will see going to 90.000$ soon if dont keep 110.000$ leves this week

I would call this a Change of Character (CHoCH) for BTCI want to share with you that the 2 Day On Balance Volume (OBV) is now below its EMA(100).
The last time this happened was at ATH in November 2021.
Also the 2D OVB EMA(100) was spot on at the ATL in January 2023.
BTC has reached it's 6.618 Fibonacci of Wave 1 resulting in 698%.
Don't you think a correction would be in order?
And yet people are still talking about a coming bull run ;)))
I don't say this is the final top, even though it looks like it… one more high after a short correction could still be possible.
I'm just saying this is something to keep in mind » Already 7x, bullish OBV is finished AND … according to a simple sine wave (yellow) we are now in a down phase until around February - March 2026.
Let's see what happens.

I have predicted this market's moves weeks in advanceby following my method step-by-step I've been right since 10 October (see link below)
Yes, I can predict the market's moves weeks in advance and no, this downtrend is not over

BTC Reversal Momentum — Targeting 110K+ Zone ( DAY VIEW)Bitcoin is showing early signs of a potential short-term reversal after consolidating near the 107K–108K support area. The chart structure indicates a possible recovery wave that could push BTC back toward the 110K+ resistance range in the coming sessions.
Here’s the current structure breakdown:
🟢 Support Zone: 107K remains the key pivot base — holding this area keeps the potential for an upside bounce intact.
📈 Reversal Projection: If momentum builds from the current range, BTC could retest resistance levels at 109.3K → 110.2K → 110.7K.
⚠️ Invalidation: A breakdown below 107K would delay this upward move and reintroduce downside pressure.
Outlook:
Bitcoin is currently stabilizing after a local dip, with buying volume gradually returning. The next impulsive move could drive price action toward 110K+, potentially marking the start of a new short-term uptrend if confirmed by higher lows.
🕒 Summary: As long as BTC maintains structure above 107K, a recovery toward 110K+ remains a strong daily scenario.
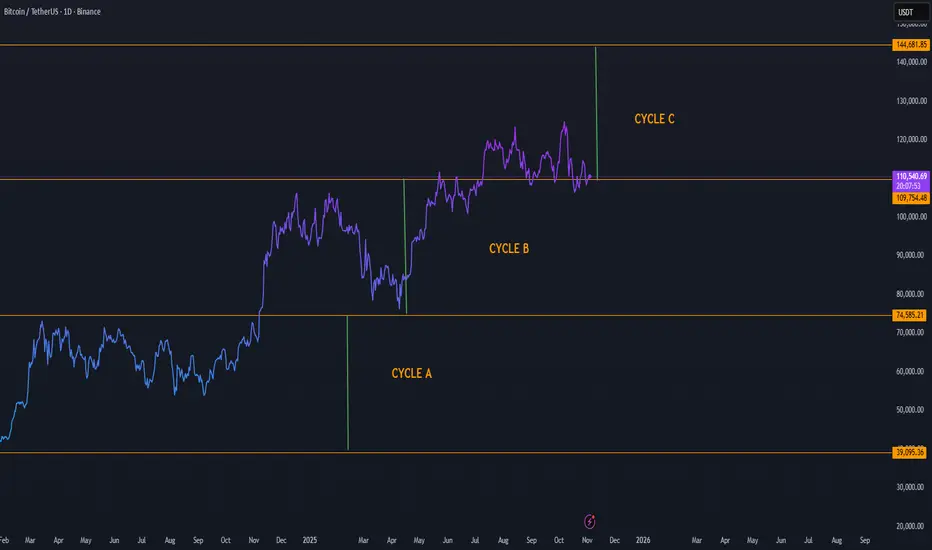
Depending on our study BTC can enter a new cycle to 143K in 2025
Bitcoin Cycle Analysis Entering Cycle C with Target Toward $144KBitcoin’s long-term market structure continues to evolve in well-defined phases, as visible through Cycle A, Cycle B, and the current Cycle C formation. Each previous cycle has followed a similar pattern: accumulation, expansion, correction, and new leg upward — and Cycle C appears to be following this same rhythm.
Here’s what the structure shows:
Cycle A: Represented the deep accumulation zone and base formation, bottoming near $39K–$75K.
Cycle B: Brought a strong recovery and expansion phase, establishing a stable mid-level support around $110K.
Cycle C (Current): Price is consolidating around the $110K area, likely preparing for the next expansion wave.
If Bitcoin maintains this cyclical rhythm, the next major target lies near $144K, aligning with the top boundary of Cycle C. This zone represents the next major resistance level and potential completion point of the current macro cycle.
Key observations:
Holding above $109K keeps Cycle C active and healthy.
Increasing volume during the next upward move could confirm a breakout continuation.
A successful push beyond $120K would strengthen momentum toward the $144K region.
Bitcoin Market update!Quick overview on the BTC market right now.
As we rotate down to test the internal range lows, will we get a nice nifty short opportunity or will it be a straight flush down. Lets see ..

BTC has a plan!Hi everyone,
In financial markets, history always repeats itself — and if you don’t agree with this principle, my friend, there’s no need to keep reading.
Bitcoin has always followed a specific pattern, and right now it’s moving exactly according to that same plan. Every time, from one ATH (All-Time High) to the next, Bitcoin has taken a consistent amount of time — between 1,428 to 1,477 days — and right after that period, it enters a bear market.
We’ve now reached that point in time.
On the monthly timeframe, the best analysis method is always classic price action, and at this stage of the market, we can clearly see all the confirmations for a bearish signal: RSI divergence and a bearish monthly candle close both indicate that the market is turning red.
If we look through SMC (Smart Money Concepts) on lower timeframes, the market has already given us a CHOCH (Change of Character) as well.
The scenario of Bitcoin going above $120,000 seems very unlikely, because realistically, even the $120K level itself is already a mind-blowing price for Bitcoin. Any numbers higher than that should be left to time to decide.
Wish you all profitable trades.

BTC market snapshotWarren Buffett’s Berkshire Hathaway is holding $382 billion in cash.
That means the company is hardly investing right now — basically sitting in dollars (short-term U.S. Treasuries, deposits, etc.). I’d assume they’re waiting for a market correction, seeing no attractive entry points at the moment. The charts are saying the same thing: time to stay on the sidelines or look for shorts.
BTC ’s 200-day MA (around 109K) is still holding, but if we fail to break above 115K soon, it’s unlikely we’ll see a new high. We can see price dipping around 108K — selling pressure is still strong.
I’m leaning short for now, but we’ll see. Ideally, I’d love to see one more push to new highs before a proper correction, though at the moment it feels unlikely.
