Bull Trap is forming - Target $115kThere will be positive news soon to trap bulls. Target $115k.
Then we nuking either before Christmas or after 20th Jan 2026.
Trade ideas

BTCUSDT sell ✅ 15m overextended to upside OR losing momentum after trend.
✅ 5m divergence in price (highs not holding), rejection candles, slowdown.
✅ 1m structure shift — higher lows break down into lower highs, confirming reversal trigger.
✅ Entry made on 1m lower high after rejection confirmation.

BTC Major trend Bitcoin on the weekly timeframe is currently resting on four zones starting from March 2020 until now in late November 2025, and this is a strong indication of the strength and stability of the upward trend.
The 125K area is considered important to break with strong trading volume.
For more deep analysis flow me on Clubhouse
This is not financial advice.

BTCUSDT.PA safe and sound plan has been marked on the chart on 1 day TF.
It might take long time but as soon it will drop to our zone and we see some bullish momentum we are in definitely.
Trading is only patience we cannot just move with moving line.
We need the price to act as we need and once the price starts acting as we decided than it will go where we want to see.
Have a good trading.
Trade once or twice a month is better than trading whole day 24/7.
Make it a peace of mind not stress.
Follow for more.

BTCUSD SELL CONTINUATION TO 80K.....Still very bearish on btc am only changing bias to once price breaks 93,500 for below this zone is a sell entry for me but if price breaks above 93,500 am positioning for buys to 100k for another sell off for still sell....

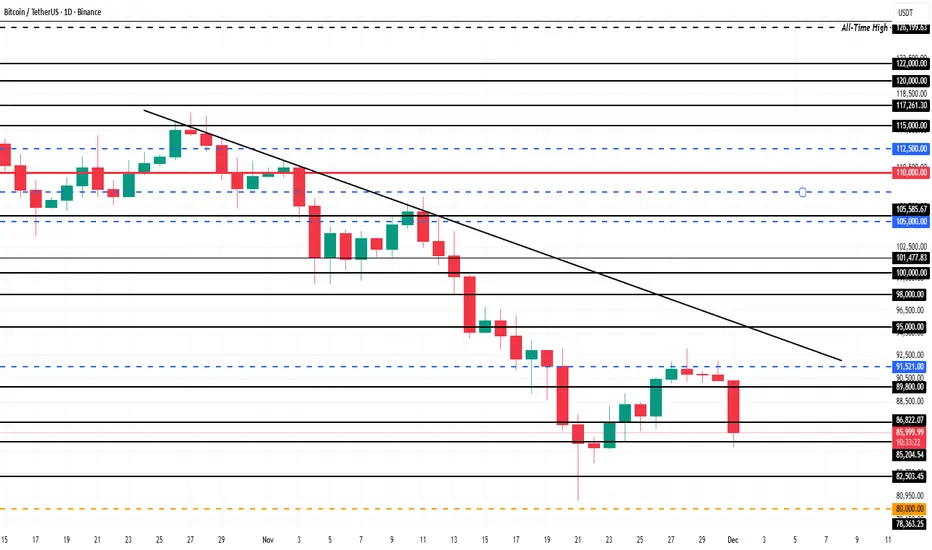
Bitcoin Price Falls To $86,000; Will It Shake Out Weak Hands?Bitcoin is trading at $86,005, holding just above the $85,204 support level. The asset remains trapped under a persistent downtrend that has lasted more than a month. This would preventing any sustained recovery attempts.
If market conditions worsen or short-term holder selling accelerates, Bitcoin could break below $85,204. A drop through this support would expose the price to $82,503 and potentially deepen losses as fear rises across the market.
However, if buyers step in and support strengthens, Bitcoin could reclaim upward momentum. A bounce from current levels could send BTC toward $89,800. A decisive move above that resistance would be essential for Bitcoin to retest $90,000 and invalidate the bearish thesis.
$BTC | $ALTS Scalp Setup Coming?I’m waiting for CRYPTOCAP:BTC reversal on STF if it bounces from current zone, I’ll take scalp entries in alts if it doesn’t reverse, I’ll stay flat.

BTC: Continue Going LongAfter testing the resistance level of 92K, BTC declined again to build up momentum, waiting for the next upward movement. As I have mentioned multiple times, levels below 90K are suitable buying opportunities, and today we continue to go long on BTC.
BTC Trading Strategy for Today:
BTCUSDT buy@86000-87000
TP:90000-92000
All signals for consecutive long positions have been profitable. I will continue to send accurate signals at the opening of the market every day—don’t miss out.

btc quick updatehello everyone!
Happy thanksgiving!
Its helpful to zoom out and get a big picture perspective.bitcoin is trading very technically as of right now. It hit the 1.618 prefectly and has since bounced off of the 38% fibonacci level as it retraced the wave 3. The wave 4 characteristics will have us trend sideways for a little while before breaking out. This could present the altcoins with a golden opportunity to gain some massive momentum when the big money realizes btc is going sideways for an extended period of time. This should be the final leg up for btc. If the wave 4 falls below 69k then the bullish count will be invalidated. For now everything seems to be going smoothly. Ethereum is my favorite altcoin as it has so much room to go up according to the chart.
thank you for your time,
Rigo

Bitcoin short term.Think simple. Basic 5 waves Elliot.
* The purpose of my graphic drawings is purely educational.
* What i write here is not an investment advice. Please do your own research before investing in any asset.
* Never take my personal opinions as investment advice, you may lose your money.

BTC Buy The PullbackLooking for the next Bitcoin opportunity? Buy on the pullback and position yourself for the next upward move. Stay ahead of the trend with our timely signals and make the most of market corrections.

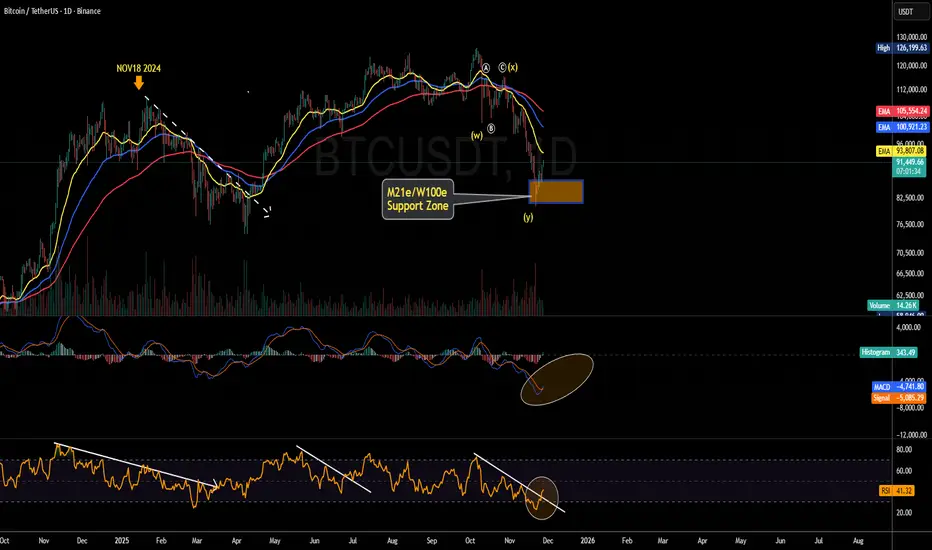
The Path to an Imminent Bitcoin ReversalBitcoin may be establishing a near-term low.
However, for a confirmed reversal signal and to validate a counter-trend rally targeting the 21-week moving average, the market requires bullish confirmation on higher timeframes.
The primary development to monitor is the potential formation of a bullish divergence on the 12-hour and daily charts, characterized by price action forming a double bottom (or even lower lows) pattern coinciding with rising lows on the RSI and MACD indicators.
No significant buying volume yet.
How to use EMA+ATR scalping - Performance Breakdown📌 EMA + ATR Scalping Indicator – Performance Breakdown (Based on Chart)
This was my first indicator ever (built last year), and seeing its performance on the chart today again reminds me why it worked so well for both scalping and swing-style trend capture.
🔹 What the Indicator Is Doing on This Chart
1. Capturing Trend Direction Early
The combination of the EMA (trend filter) and ATR-based trailing stop (volatility filter) helps the indicator catch directional moves very cleanly.
• During strong directional phases (uptrends or downtrends), the signals appear right as momentum shifts.
• In the first half of the chart, every bearish impulse is detected quickly, and the EMA+ATR cross confirms continuation.
You can clearly see how:
✔ The SELL signals appear early on sustained drops
✔ The BUY signals appear early when bullish momentum kicks in
✔ There are hardly any “late” entries due to ATR’s responsiveness
⸻
2. Reversal Detection Is Smooth & Immediate
One of the strongest parts of this indicator is how it flips direction without delay.
Whenever price breaks the ATR trailing stop from the opposite side:
➡ A reversal signal is generated
➡ The previous directional bias is cancelled
This prevents holding a wrong-bias trade for too long.
Even in sideways phases, reversals are caught fast—helping scalpers avoid getting stuck.
⸻
3. Handles False Breakouts Surprisingly Well
This chart shows multiple places where price tries to break in one direction but gets rejected immediately.
The indicator reacts quickly because:
• EMA confirms the micro-trend
• ATR trailing stop invalidates fake moves
• The system flips signal as soon as true momentum appears
This “two-layer confirmation” makes the signals tighter and reduces whipsaws.
So yes—capturing false breakouts and flipping instantly is one of the biggest USPs of this script.
⸻
4. Consecutive Candle Momentum Logic
The script includes a 5-bar consecutive breakout filter, which increases the probability that a breakout is real.
This further improves:
✔ Trend continuation entries
✔ Avoidance of weak or random breakouts
✔ Early detection of strong impulses
You can see how this filter helps catch those clean legs in the chart’s mid-section.
⸻
🔹 The Grey “No-Trading Zone” — A Very Useful Filter
The grey highlighted vertical bands represent periods when the ATR stays too flat.
Flat ATR = low volatility = trap zone.
The indicator marks these with:
• Grey background shading
• “No Trading Zone” label on the candle
These filtered areas clearly show:
❌ Avoid entering — market is undecisive
❌ Signals here are often fake
✔ Wait until volatility expands again
This simple visual filter improves discipline and prevents unnecessary losses.
⸻
🔹 Overall Performance on the Chart
✔ Strong Trends → Clean Signals
The indicator rides the trend well (both up and down), capturing the majority of each move.
✔ Reversals → Early Detection
Quick flips keep you aligned with the new direction without holding drawdowns.
✔ Sideways Market → Controlled Exposure
ATR-flat grey zones protect you from chop.
✔ False Breakouts → Immediate Recovery
When the initial direction fails, the indicator immediately prints the opposite signal.
✔ Scalping & Swing Both Supported
The fast ATR logic supports scalpers,
the EMA confirmation supports swing traders.
⸻
🔹 Why This Indicator Still Feels Powerful (Even Today)
Because it is built on three timeless trading foundations:
1. Trend logic (EMA)
2. Volatility logic (ATR)
3. Breakout momentum (5-bar filter)
These three combine in a very natural way—hence the clean signals you see on the chart.

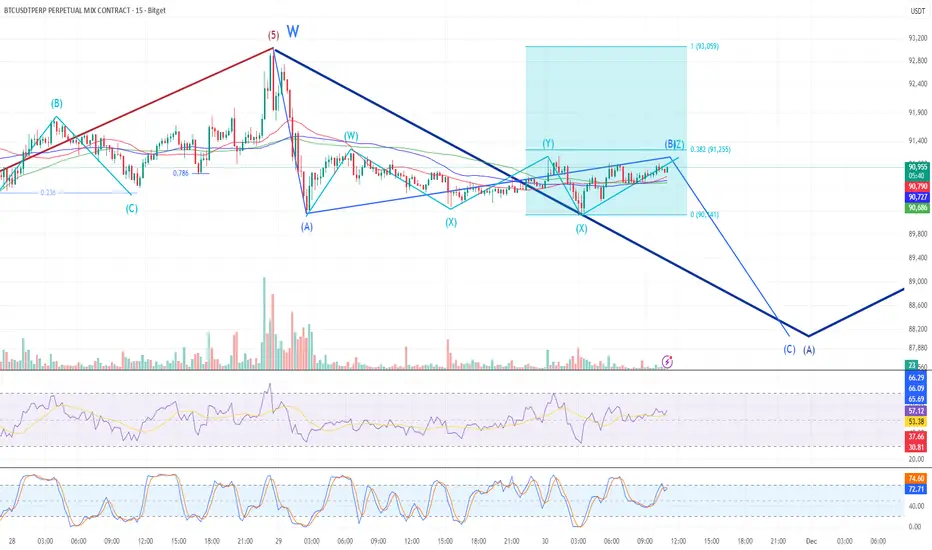
Bitcoin 15-Min Chart – Lower Timeframe Structure of Higher TimefThe higher timeframe ABC correction is being interpreted as a W-X-Y structure on the 15-minute chart, based on internal wave complexity.
Currently in the A wave of the internal ABC within the X leg
Within that A wave, a smaller ABC is unfolding, with the A-B portion nearing completion
Overall structure suggests a complex correction (W-X-Y-X-Z) in progress
At the moment, moving averages are tightly clustered, forming a combined support zone.
➡️ A clean break below this support cluster would strengthen the case for a Wave C move.
BTC, ETH, XRP market snapshotBTC — key levels: $82,000 and $98,000.
If we break above $98K, a new all-time high becomes likely. If we move below $82K, there’s a high probability of revisiting the $60K area and entering a crypto winter. For now the market looks uncertain today, so I want to see how things develop. The monthly close is crucial.
ETH — possible local H&S pattern, target around $3,500 (which also aligns with the daily MA50/200 — a trend-change signal). It’s important to hold $2,960 to continue the move.
Strong resistance is at $3,800. Support sits in the $2,500–2,700 zone, which has already been tested — if we revisit it again, the next level opens up around the $2,000 area.
There’s a divergence forming on the 4h timeframe, so a local trend break is possible. For now I’m watching my long positions, with the stop moved to breakeven around $2,800.
XRP still hasn’t played out the divergence on the monthly timeframe. There’s a strong risk of forming a double top if we close below $2, although market makers are still fighting here and we can see a long signal on the daily.
But I still have the feeling we may see another low — and not only on XRP.

BTCCRYPTOCAP:BTC inverse head and shoulders is likely to play out and the measured target for the pattern is $150K. The structure is clean and momentum is starting to align with the breakout setup.

Bitcoin Analysis — 27 November|Are the buyers really in charge ? 📌 Market Overview
We’re heading into the end of the month, so I’m staying a bit cautious
The Fear & Greed Index is at 18 which still shows extreme fear, but sentiment has improved thanks to the recent bounce.
📈 Trend Structure
This is our first real upward move after the sharp drop earlier this month
We’ve formed the first higher low, but no higher high on the 4H yet ⏳
So the trend isn’t officially bullish.
Long trigger ▶️ Break above 88,000 after Price correction
Short trigger ▶️ Drop below 86,000 or a lower high + lower low on 1H 📉
💥 Volume Behavior
Buyers are pushing volume like crazy
But price barely moves…
This shows heavy sellers sitting in this zone
🔍 Plan:
If buyers liquidate the sellers → I’m going LONG
If buyers fail → I’m SHORTING
🧭 Bitcoin Dominance
Dominance is rising with price 📈
That’s good!
If you missed yesterday’s move, altcoins might offer setups — but only after this buyer vs seller fight has a clear winner ⚔️
🔑 Quick Tip:
If dominance moves against BTC → altcoins shine ✨
If dominance moves with BTC → Bitcoin is the best play 🔥
please dont forget money management and risk management ! <3

BTCUSDT Trending Down.Hi,
A look at BTCUSDT over a one-hour period. Based on the current daily low candle, the price is consolidating somewhat above the price low of 82129.49. We have bearish pressure at 88K that could potentially resist the current bullish pressure.
We want to see price break below 83401.72 for bearish bias to aim for potential targets of 77056.62 and 72799.55
Happy Trading,
K.
This is not financial advice.

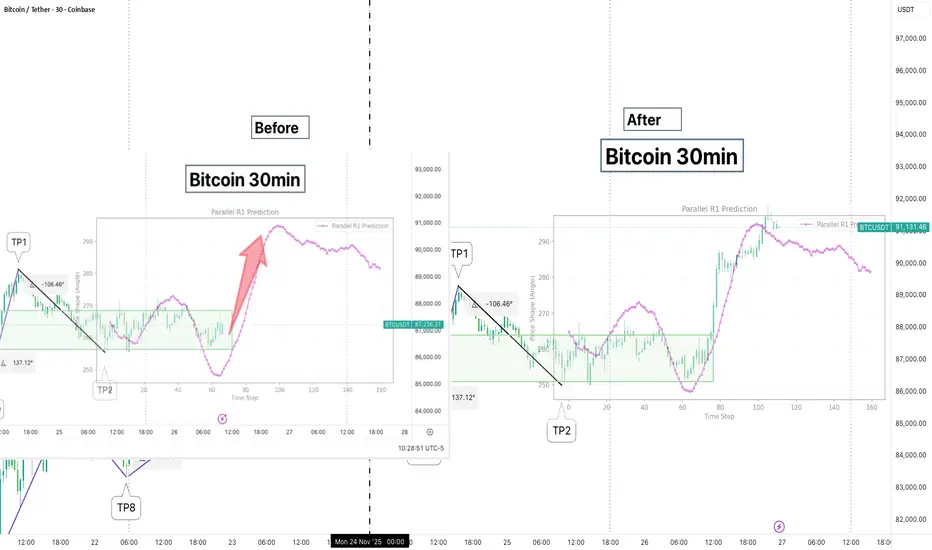
An update from yesterday. AI prediction did it againThe left is the ‘before’, what we are looking at yesterday
And the right is the ‘after’, which is what happened thereafter
The focus point is the AI prediction said it was going to go up, and it did exactly as it said it would
BTCCRYPTOCAP:BTC is forming a clean inverse head and shoulders pattern. If it breaks the neckline, the target sits near $150K. Based on structure, momentum, and higher time frame positioning, I think this outcome is very likely and entirely possible in the coming months.

BTCUSDT.P - November 29, 2025Bitcoin is trading in a sideways range after a sharp rejection from the 92,900 resistance area, with intraday structure showing lower highs capping price under the 91,200–91,300 band.
A key support shelf sits around 90,200–90,400; holding above this zone could fuel a range breakout back toward 92,900, while a decisive close below it would confirm a bearish rotation and expose the lower support region near 89,000.

BTC SHORT TO 90K THEN BOUNCE TO 91,500Looking for a small move to the down side and then a bounce up to $91,500.
Liquidating both Long and Short positions.

Watch Out! $BTC Trap Ahead!CRYPTOCAP:BTC 1H & 30 mint trend is still bullish, but on lower TF it has shifted to bearish. Be careful don’t get trapped by a small weekend pump.
Wait for my next update
