Consistency: The Real Market Hack!Every trader wants consistency.
But very few understand what consistency actually means.
Consistency is not:
❌ winning every trade
❌ predicting the market
❌ avoiding losses
❌ being perfect
Consistency is built long before you press the buy (or sell) button.
Here’s what consistent traders all have in common:
1️⃣ They Repeat the Same Process Every Day!
Consistency comes from repetition; not randomness.
The best traders don’t have a different plan for every chart.
They use the same routine, the same checklist, the same rules.
Clarity replaces guesswork.
2️⃣ They Trade Only When Their System Shows Up!
Consistency is not about taking more trades.
It’s about taking only the trades that match your edge.
No signal = no trade.
No confluence = no risk.
No clarity = no entry.
Most inconsistency comes from forcing trades that never belonged in the plan.
3️⃣ They Accept Losses Without Breaking Structure!
A consistent trader still loses, they just don’t fall apart when it happens.
❌They don’t double their risk.
❌ They don’t chase entries.
❌ They don’t change strategy mid-trade.
They take the loss the same way they take the win:
within the system.
4️⃣ They Focus on Long-Term Data, Not Single Trades!
You can’t judge a strategy by one day, one week, or even one month.
Consistency is measured across:
✔ dozens of trades
✔ multiple cycles
✔ all market conditions
Professionals think in probabilities.
Beginners think in outcomes.
The Real Secret?
Consistency is not an ability.
It’s a decision you make every day:
➡️ Follow your rules
➡️ Manage your risk
➡️ Trade your edge
➡️ Ignore the noise
When your habits become consistent, your results eventually follow.
⚠️ Disclaimer: This is not financial advice. Always do your own research and manage risk properly.
📚 Stick to your trading plan regarding entries, risk, and management.
Good luck! 🍀
All Strategies Are Good; If Managed Properly!
~Richard Nasr
Trade ideas
A Pullback Cannot Hide a Weakening TrendHello everyone, it’s Domic here ✌️
Looking at Bitcoin’s recent price action, you can probably feel that the latest drop wasn’t a random fall. The market completely broke through a multi-day equilibrium zone, and the moment BTC was repeatedly rejected at the EMA 89 and then lost the EMA 34, the balance of power shifted clearly toward the sellers.
Interestingly, right after that sharp breakdown, BTC bounced into a short-term pullback. This doesn’t signal a trend reversal; it’s simply the market’s natural reaction after falling too quickly: profit-taking from sellers, short-covering, and weak dip-buying flows creating a technical rebound — enough to rebalance the market, but not enough to change direction.
From a macro perspective, the signals are fairly aligned: US bond yields have risen again, the DXY has bounced from the 99 area, ETF inflows have weakened, and defensive sentiment ahead of upcoming US labour data has caused demand to dry up almost entirely. Crypto is simply being dragged along with the broader risk-off environment.
From a technical angle, BTC is trading below both the EMA 34 and EMA 89 — two downward-sloping moving averages indicating the trend remains bearish. The 4H breakdown accompanied by strong volume shows this is a real sell-off. BTC is currently pulling back to retest the resistance levels: 88,700–89,000 at the EMA 34 and 90,400–90,600 at the EMA 89. These zones will reveal whether selling pressure still dominates.
If sellers return aggressively, BTC may continue heading toward lower support regions: 85,500–86,000 is the first key area, followed by 83,000–84,000 — a demand zone that previously generated a strong bullish reaction. With the current momentum, the scenario where BTC at least touches the 85,500–86,000 support is becoming increasingly likely.
Which direction do you think the market is leaning toward? Feel free to share your perspective — and wishing everyone successful trading!
Bitcoin (BTCUSDT) – Intraday Trend & Pattern AnalysisHi!
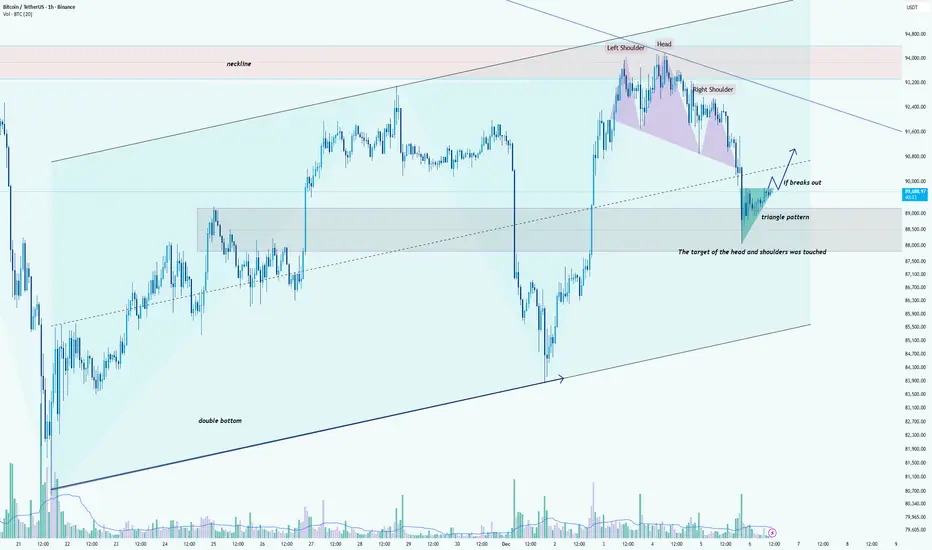
Bitcoin continues to trade within a broader ascending structure, supported by an established rising trendline that has guided price higher over the past weeks. After forming a double bottom near the lower boundary of this channel, BTC initiated a strong rally toward the major resistance zone around 95,000 USDT, where a clear head-and-shoulders reversal pattern appeared. The neckline later broke, and its measured target has already been fully achieved, confirming the pattern’s validity.
Following the completion of this decline, the price stabilized inside the previous consolidation zone and began forming a triangle pattern, signaling compression and potential trend continuation. BTC is now testing the upper boundary of this triangle. A confirmed breakout above the pattern could trigger a bullish continuation toward 90,500–91,200 USDT, aligning with the dashed trendline and short-term resistance levels.
Failure to break upward may lead to a retest of the triangle’s lower boundary or even the broader demand area around 88,000–88,500 USDT, which previously acted as a reaction zone.
Overall, as long as the price remains above the ascending channel’s main support, the medium-term structure favors buyers. A breakout from the triangle will be the key signal for renewed bullish momentum.
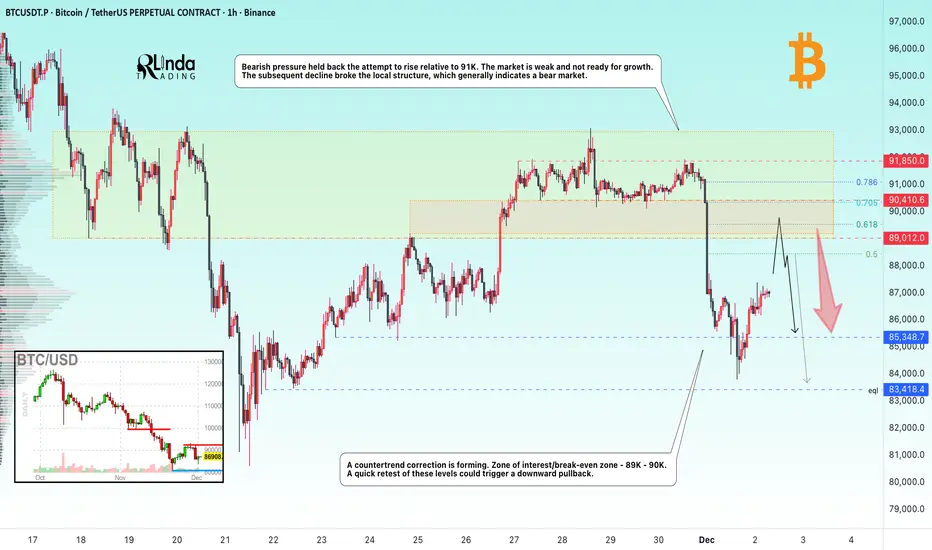
BITCOIN → The hunt for liquidity before the fallBINANCE:BTCUSDT.P continues to update lows within the global downtrend. The retest of 91K confirmed the dominance of bears...
The downtrend continues. The technical and fundamental situation for the crypto market is neutral to weak.
Bearish pressure held back the attempt to rise relative to 91K. The market is weak and not ready for growth. The subsequent decline broke the local structure, which generally indicates a bear market, but after updating the local minimum to 83700, a countertrend correction is forming. Zone of interest/break-even zone - 89K - 90K. A quick retest of these levels could trigger a downward pullback.
Resistance levels: 89K, 90K
Support levels: 85,400, 83,400
A retest of the range boundary and zone of interest could trigger a liquidity squeeze and a further decline if the bears keep the price below these boundaries.
Best regards, R. Linda!
BTC Pullback: Buying 50-78.6% Discount LevelsAfter the aggressive internal liquidity grab on December 1st, which subsequently manifested as a Daily Bullish Order Block , Bitcoin continued its local bullish structure from the global 78.6% level, which I analyzed in my global overview: Bitcoin: The ATH Was a Trap. Here's the Real Roadmap.
Currently, the asset is correcting on the 4H structure and has reached the top of the Order Block. However, to obtain a better Risk/Reward (RR) in the trade and for general entry feasibility, I always wait for a more favorable price in the Discount Zone , which is located below the 50% Fib level.
No one can know exactly how deep Smart Money needs to return the asset into the manipulation zone to close losing positions used to execute this aggressive liquidity grab. Therefore, I will consider a reversal reaction from each level: 50%, 61.8%, and 78.6% .
✅ Entry Conditions:
The condition for entry will be reaching one of these levels, price finding acceptance above it, and the initiation of bullish order flow on a lower timeframe (1m-5m).
❌ Invalidation:
The invalidation of the long scenario will be a break of the local 78.6% level . In that case, the Bitcoin reversal from the global 78.6% level in continuation of the global uptrend will be in question, though still possible, as this is a level from the highest timeframe, and the second monthly candle could also close with its body above this level.
🎯 Target:
The minimum target in case of a long setup formation from the Discount Zone will be the SUPPLY zone . To confirm that the bull cycle is not over and the asset can potentially form a new ATH, it will first have to overcome this resistance zone.
~~~~~~~~~~~~~~~~~~~~~~~~~~~~~~~~~~~~~~~~~~~~~~~~~~~~~~~~~~~~~~~~~
The principles and conditions for forming the manipulation zones I show in this trade idea are detailed in my educational publication, which was chosen by TradingView for the "Editor's Picks" category and received a huge amount of positive feedback from this insightful trading community. To better understand the logic I've used here and the general principles of price movement in most markets from the perspective of institutional capital, I highly recommend checking out this guide if you haven't already. 👇
P.S. This is not a prediction of the exact price direction. It is a description of high-probability setups that become valid only if specific conditions are met when the price reaches the marked POI. If the conditions are not met, the setups are invalid. No setup has a 100% success rate, so if you decide to use this trade idea, always apply a stop-loss and proper risk management. Trade smart.
~~~~~~~~~~~~~~~~~~~~~~~~~~~~~~~~~~~~~~~~~~~~~~~~~~~~~~~~~~~~~~~~~
If you found this analysis helpful, support it with a Boost! 🚀
Have a question or your own view on this idea? Share it in the comments. 💬
► Follow me on TradingView for timely updates on THIS idea (entry, targets & live trade management) and not to miss my next detailed breakdown.
~~~~~~~~~~~~~~~~~~~~~~~~~~~~~~~~~~~~~~~~~~~~~~~~~~~~~~~~~~~~~~~~~

BTC/USDT | The real test ahead! (READ THE CAPTION)Hello everyone, back with another analysis, this time on BTC.
By examining the daily chart of BTC, we can see that bitcoin has been boosted up after hitting the demand zone and is currently being traded in 93K zone. I expect a rise to 97k-98k FVG zone, if BTC manages to go past through this zone, a rise to 104K could be possible. Should it fail to go past 98K, another drop to 81K is likely to happen.

The Hidden Skill Every Great Trader Masters; And It’s Not Chart!Most traders spend years perfecting chart patterns, indicators, and entries…
Yet only a handful ever master the real skill that separates professionals from the rest, the art of waiting.
📉 Anyone can draw support and resistance.
📈 But not everyone can wait for price to reach them.
The market rewards patience, not predictions.
It’s not about catching every move, it’s about being ready when your setup aligns perfectly.
That’s when you strike. That’s when probability works for you, not against you.
Think of trading like fishing 🎣:
You don’t chase the fish, you position your line where it’s most likely to bite, then you wait.
So next time you feel the urge to jump in early, remind yourself:
You’re not just a trader. You’re a waiter, paid in precision and patience.
📚 Key takeaway:
Great traders don’t predict, they prepare.
They let the market move first, then respond with clarity.
⚠️ Disclaimer: This is not financial advice. Always do your own research and manage risk properly.
All Strategies Are Good; If Managed Properly!
~Richard Nasr

BTCUSDT Price Update – Clean & Clear Explanation✅Bitcoin is trading inside a broader downward structure, and the recent rally has reached a strong supply zone near 92,000–94,000, where sellers have stepped in again. The price reacted sharply from this resistance band, indicating that the market is still respecting the higher-timeframe bearish trend.
✅Currently, the market is showing signs of exhaustion after the latest push upward, and the price is starting to form a lower-high rejection pattern, suggesting that buyers are losing momentum. As long as Bitcoin stays below the 92,000–94,000 supply zone, the long-term outlook remains bearish.
✅If selling pressure continues, the chart supports a gradual decline toward the first target near 88,000, where a previous demand zone and trendline support meet. Breaking below that structure may trigger a deeper drop toward the second major demand zone around 83,000–84,000, which aligns with the lower boundary of the long-term descending channel.
✅Overall, unless Bitcoin breaks and holds above 94,000, the higher-timeframe structure favours a bearish continuation, with sellers aiming for lower levels over the coming sessions or weeks.
✅If If you find it helpful please like and comments for tis post and share thanks.

Quick Bitcoin Update (4H)The corrective phase of Bitcoin is an expanding triangle/diametric/symmetrical , with wave C completed and now we are inside wave D. This is a bullish D wave.
There is still time remaining for wave D to complete.
We have marked a green box below the price; if the price reaches this area, we can look for long/buy positions.
Look for long/buy positions in the red box, as there are many sell orders placed there.
For risk management, please don't forget stop loss and capital management
When we reach the first target, save some profit and then change the stop to entry
Comment if you have any questions
Thank You

BTC 1H LIQUIDITY CYCLE MODEL SELL SETUP LOADINGBitcoin has completed a clean downside impulse and is now trading inside a corrective structure that fits perfectly into my Liquidity Cycle Model (LCM).
Here’s the breakdown:
🔹 1. Impulse Down — Confirmed
Strong bearish displacement created the foundation for LCM Phase 1. Sellers are clearly active on the HTF.
🔹 2. Correction Into Supply — Confirmed
Price has retraced into a multi-layered supply zone, aligning with:
• 90,666
• 91,069
• 92,202
• 92,305
These levels represent inefficiencies + old liquidity, making this the ideal correction zone.
🔹 3. Liquidity Sweep — Developing
Price has started reacting inside the zone, but the clean sweep of remaining liquidity (91.0–92.3 region) may still happen.
If we get that final sweep → I expect a strong bearish reaction.
🔹 4. Reversal Trigger — Waiting
I need a decisive BOS (Break of Structure) down on LTF to confirm the reversal.
Until BOS prints, this remains a potential LCM sell, not an active one.
🔹 5. Sell Continuation — After BOS
If reversal confirms:
• First continuation zone: 90,218
• Break zone: 89,467
• Major inefficiency target: 82,292
The downside potential is huge if sellers fully take over.
✅ My Bias:
Bearish, but only after a clean BOS.
The model is forming beautifully — sweep the highs, break structure, and the continuation sell becomes high probability.
🧠 LCM Logic
Impulse → Correction → Liquidity Sweep → Reversal → Continuation
BTC is currently between Correction and Sweep, preparing for the Reversal → Sell leg.
⚠️ Key Note:
No confirmation = no entry.
Let price show its hand. LCM rewards patience, not prediction.

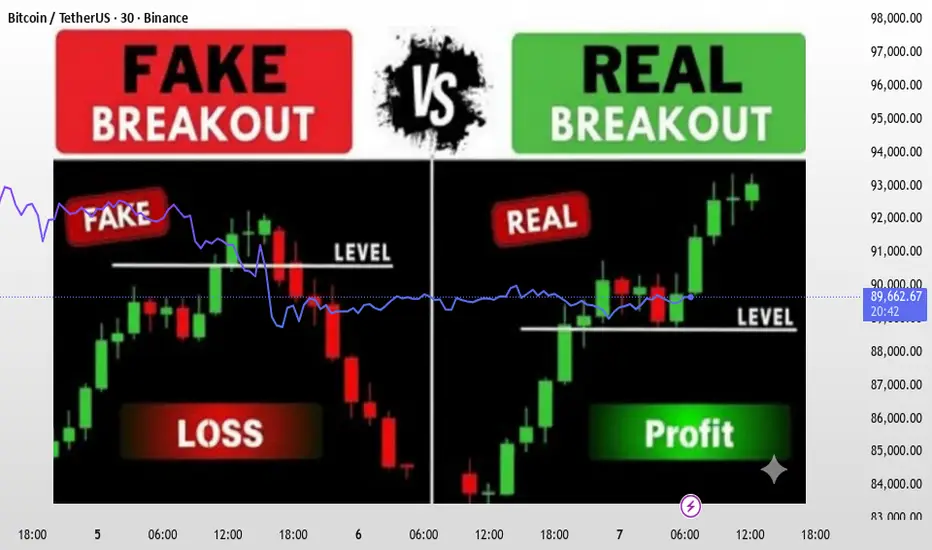
Breakout vs Fakeout – How to Identify the DifferenceBreakout vs Fakeout — The Complete Professional Guide
How Smart Money Creates Traps & How Traders Can Avoid Them
Breakouts and fakeouts are among the most misunderstood events in trading. Many traders enter too early, get trapped, and watch price reverse exactly after their entry. This educational idea explains, in depth, how institutions create fakeouts, how real breakouts are structured, and how you can confirm the difference using pure price action.
---
🔹 Understanding Market Behavior Behind Breakouts
Markets move from accumulation → manipulation → expansion.
The breakout or fakeout usually happens during the manipulation phase.
Smart Money (SMC) concepts play a major role here:
- Market builds liquidity above equal highs & below equal lows.
- Traders place buy stops or sell stops near key zones.
- Institutions trigger these stops to fill large orders.
- Only after trapping liquidity does the real move begin.
So before analysing a breakout, always ask:
👉 Who needs liquidity here — retail or institutions?
---
🔹 What Makes a Breakout Real?
A real breakout is not just a wick or a temporary push. It is a structural shift backed by momentum and confirmation.
✅ 1. Strong Candles With Clear Body Closes
A real breakout has wide-body candles closing decisively above resistance or below support.
Weak candles = weak intention.
✅ 2. Break + Retest + Continuation
The strongest breakouts follow this pattern:
1. Price breaks the level
2. Comes back for a clean retest
3. Holds structure
4. Forms a continuation pattern
This retest phase filters 70–80% of fakeouts.
✅ 3. Market Structure Shift (MSS / BOS)
For a bullish breakout:
- Price creates Higher Highs (HH) and Higher Lows (HL)
For bearish breakout:
- Price creates Lower Lows (LL) and Lower Highs (LH)
A breakout without structure change is not reliable.
✅ 4. Volume & Volatility Expansion
Breakouts must show an increase in:
- Volatility
- Candle size
- Trading activity
If volume remains flat, the breakout may fail.
---
🔹 How to Spot a Fakeout Before It Traps You
Fakeouts are intentional liquidity grabs. Here are the strongest warning signs:
❌ 1. Break Happens With Weak Candles
Small bodies, long wicks, hesitation candles — all indicate uncertainty.
❌ 2. Price Fails to Close Outside the Zone
This is the #1 rule:
If price does not close outside resistance/support, it is most likely a fakeout.
❌ 3. Instant Rejection Back Into the Range
If price breaks the level and immediately returns inside, institutions are hunting stops.
❌ 4. No Retest — Just a Sharp Reverse
Real breakouts retest.
Fakeouts don’t.
They reverse fast because their only purpose was liquidity collection.
❌ 5. Presence of Equal Highs / Equal Lows
When the market forms equal highs/lows, it signals liquidity pools.
Fakeouts usually occur right above/below these areas.
---
🔹 Advanced Confirmation Technique (Institutional Logic)
Here’s a professional-level method used by SMC traders:
1. Identify the liquidity zone (EQ highs/lows)
These serve as targets for traps.
2. Wait for the first breakout
Do not enter here.
3. Look for the rejection candle
A “fakeout candle” usually has:
- Long wick
- Small body
- Closes back inside the structure
4. Wait for BOS (Break of Structure)
Once price reverses and breaks an internal structure, the fakeout is confirmed.
5. Enter on the retest of the trap zone
This is the safest and most profitable entry.
---
🔹 Practical Example (General)
Let’s say Gold is ranging between $2400 - $2420.
- Price spikes above $2420, hits stops, and forms a long-wick candle
- The breakout candle fails to close above resistance
- Price immediately drops back inside the range
- Internal structure breaks → fakeout confirmed
- Retest of $2420 becomes the ideal sell entry
This exact behavior happens in XAUUSD almost daily.
---
🧠 Final Professional Tip
Breakouts are easy to trade once you stop trying to predict them.
Let the market show you:
- Strong close
- Clear retest
- Momentum
- Structural break
And avoid all entries based only on a wick touching resistance or support.
Patience is the difference between a trapped trader and a profitable trader.
Your boosts, comments, and likes motivate me to share more accurate analyses like this.
👉 If you found this helpful, please Boost the idea and leave a comment — it really helps!
— JT_CHARTsMaster
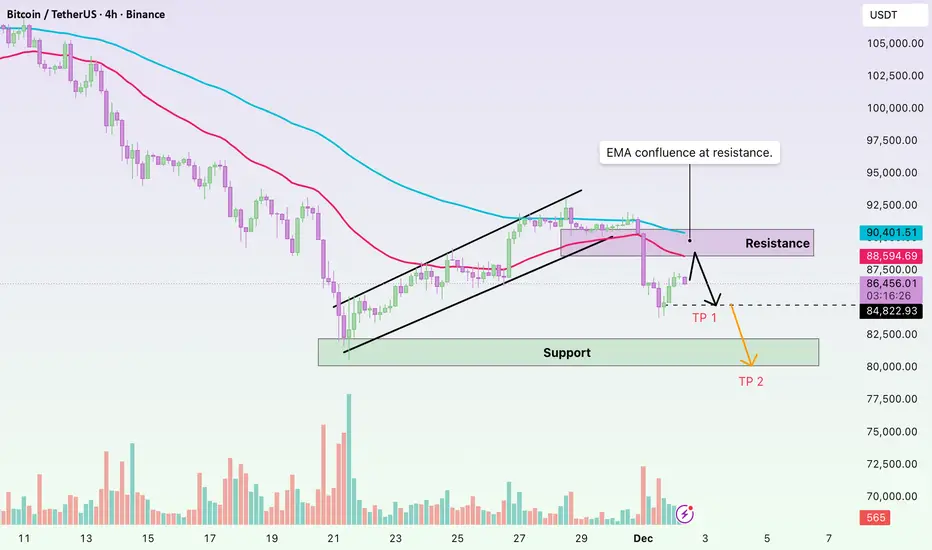
EMA 34 & 89 Signal That the Uptrend Is Still Not ConfirmedHello everyone,
BTC is currently in a clear transition phase as the 34 EMA (red) remains below the 89 EMA (blue), or has only barely crossed upward without forming enough separation to confirm a new bullish trend. Price is hovering around 91,000–92,000, sticking closely to the EMA cluster, which at this stage acts more as dynamic resistance than a reliable support. Looking left on the chart, the 92,000 zone corresponds to the previous distribution top — a major supply area filled with trapped orders — making any breakout attempt even more difficult. In other words, BTC is simply retesting the 34–89 EMA cluster combined with old supply, and the probability of a strong immediate reversal is relatively low.
From a macro perspective, the hesitation becomes even more understandable. The Federal Reserve and its rate-cut path remain the biggest variables: markets expect further cuts, but nothing official has been delivered. Without clarity on how dovish the Fed intends to be, major funds are unlikely to aggressively rotate into risk-on assets like crypto. Liquidity inflows also remain muted — no new spot ETF catalysts, no institutional accumulation announcements, and on-chain data shows no strong capital inflow into BTC. As a result, price has enough momentum to retest EMAs, but not enough to break through resistance and establish a sustainable uptrend. Sentiment is also mixed: short-term traders are taking profit into resistance after the recent dump, while buyers prefer to wait for clearer Fed signals, limiting the strength of any chase buying.
Given this backdrop, I still view the current recovery as a technical bounce within a broader weak structure. With the 34 EMA yet to meaningfully separate above the 89 EMA and price still fluctuating around 91–92k, BTC needs one of two conditions to confirm a real breakout: either a strong positive catalyst (aggressive Fed cuts, significant USD weakness, or a clear return of ETF inflows), or a deeper pullback into lower-timeframe demand to build a base first. My preferred scenario is continued choppy movement around the 34 & 89 EMA cluster; and if price keeps rejecting 92k and eventually closes a 4H candle below 90k, the likelihood of revisiting 88k–86k increases before any strong and sustainable rally can take shape.

Lingrid | BTCUSDT Potential Bullish Trend Continuation SetupBINANCE:BTCUSDT is holding above the trendline after defending the higher-low zone, keeping the broader bullish structure intact. The recent pullback swept short-term liquidity before price stabilized near the 89,000 support band, where buyers stepped back in. This behavior suggests the move lower was corrective rather than the start of a reversal.
As long as price remains supported above 89,000 and respects the ascending structure, CRYPTOCAP:BTC has room to grind higher toward the upper resistance cluster around the weekly high near 96,000. A successful push through that zone would signal trend continuation, while short-term consolidations along the trendline remain constructive for further upside.
➡️ Primary scenario: higher lows hold → continuation toward 96,000 resistance area.
⚠️ Risk scenario: loss of 89,000 support invalidates the bullish setup and shifts focus back toward deeper support.
If this idea resonates with you or you have your own opinion, traders, hit the comments. I’m excited to read your thoughts!

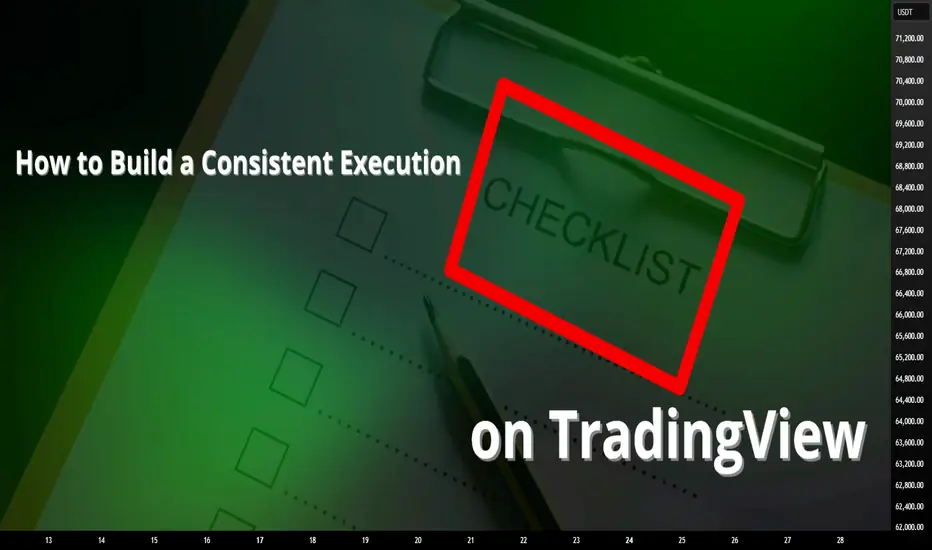
How to Build a Consistent Execution Checklist on TradingViewMost trading mistakes don’t come from bad strategy, they come from inconsistent execution.
An execution checklist removes guesswork and replaces it with structure.
When your actions follow a routine, your results stabilize.
TradingView gives you everything you need to build a checklist that stays visible, actionable, and tied directly to your chart.
1. Define Your Core Conditions
Before any trade, the bigger picture must be clear.
Start your checklist by answering three questions:
What is the higher-timeframe direction
Where is price relative to key levels
Is price approaching with strength or weakness
Use TradingView’s drawing tools to mark support, resistance, value zones, and session highs and lows.
Add a simple text note on the chart listing your core conditions so they are always visible.
If the market context fails this first screen, the trade is already invalid.
2. Build Confirmation Criteria
Once structure is confirmed, you move to evidence.
Mark confirmation areas directly on your chart:
Liquidity pools
Fair value zones or imbalances
Previous session highs and lows
Asian range or New York open
If your strategy uses indicators, document exact conditions:
Moving average position and slope
Volume behavior
VWAP location
Volatility expansion or contraction
Define rules that don’t change based on emotion.
Confirmation should prove your bias, not justify your urge to trade.
3. Validate Risk Before Execution
Every setup must survive a risk checkpoint before it’s allowed to go live.
Your checklist must answer:
Where is my invalidation level
How much capital am I risking
Does this violate any daily limits
Is the reward worth the risk
Use TradingView’s long or short position tool to visualize risk directly on the chart.
Save it as a template so your risk process stays uniform across all trades.
No trade is valid if risk isn’t clean.
4. Create a Pre-Execution Routine
A checklist only works if you actually follow it.
Add a short pre-trade process directly to your chart notes using checkboxes or bullet points:
Example execution checklist:
Market phase confirmed
Level identified
Confirmation present
Risk valid
Entry condition active
Walk through this list before clicking buy or sell.
If one item fails, the trade fails.
Over time, this routine removes emotional impulse completely.
5. Review and Refine Weekly
Your checklist isn’t static, it evolves.
Every week ask:
Where did I break my rules
What conditions led to losses
Which confirmations work best
What rules saved me from bad trades
Use TradingView’s trade replay and journaling features to review execution quality, not just profit.
Consistency improves when your system evolves with you.
Final Thought
A checklist doesn’t restrict your trading, it frees you from emotion.
When your process is clear, your confidence increases.
When your confidence increases, discipline follows.
Good traders make decisions.
Great traders execute procedures.
Stay Green!
TradeCityPro | Bitcoin Daily Analysis #240👋 Welcome to TradeCity Pro!
Let’s move on to today’s Bitcoin analysis. The market has started its correction phase today.
⏳ 1-Hour Timeframe
Yesterday, Bitcoin had a very strong bullish momentum and reached the 93,609 level.
✨ Breaking this level could have continued Bitcoin’s upward movement, but the price failed to break through and faked it, starting a correction instead.
💥 The RSI oscillator, as I mentioned before, was showing strong bullish momentum while above the 50 level. However, with the break of this level, the bullish momentum faded, and Bitcoin entered a deeper correction.
📊 During this correction, volume has decreased significantly, and the price has corrected down to 91,974.
The reaction of the price to this level is very important.
⚡️ If the price is supported at 91,974, the likelihood of breaking the resistance increases, and the price could break through this level in future attempts.
💫 However, if the price breaks 91,974 and volume increases, Bitcoin could see deeper corrections, potentially moving to 90,421 or even 88,082.
✔️ For now, I’m only looking for long positions and will open a long position if 93,609 is broken.
⭐ However, I won’t open a short position if 91,974 breaks; I’ll wait for more bearish momentum to enter the market before considering a short.
❌ Disclaimer ❌
Trading futures is highly risky and dangerous. If you're not an expert, these triggers may not be suitable for you. You should first learn risk and capital management. You can also use the educational content from this channel.
Finally, these triggers reflect my personal opinions on price action, and the market may move completely against this analysis. So, do your own research before opening any position.

Bitcoin Potentially break Shift to downside Bitcoin’s price a rising parallel channel. Price recently reached the upper boundary of the channel, entering a highlighted supply zone around 94,000. After touching this zone, the chart indicates a potential rejection.
A projected path is drawn suggesting small consolidation or minor pullback within the supply zone followed by a deeper downward move toward the mid-channel region and possibly extending toward the 88K support level a further extension toward 84K is marked as a deeper support target if the decline continues I expect Bitcoin price continue its downtrend if the price react we could see a more server sell off in the crypto market.
You may find more details in the chart,
trade wisely best of luck Buddies.
Ps; Support with like and comments for better analysis thanks for supporting.

The Most Underrated Skill: Reading the Market Without Bias!Most traders focus on indicators, patterns, and strategies…
But very few focus on the skill that actually moves the needle:
Learning to read the market without forcing your bias onto the chart.
Here’s the truth 👇
When you zoom out and remove the noise, the market is always telling one of only three stories:
📘 1. Impulse → Market is moving with strength
An impulse leg is a clear, strong movement in one direction.
Candles are decisive. Pullbacks are shallow. Speed is visible.
When you identify an impulse, the message is simple:
“Don’t fight me, follow me.”
This is where continuation trades thrive.
📔 2. Correction → Market is taking a breath
A correction is messy, slow, overlapping price action.
The market is not reversing; it’s reloading.
Most beginners confuse corrections with trend reversals… Professionals don’t.
The key question becomes: “Where will this correction end?”
Because that’s where the next impulse usually begins.
📕 3. Reversal → Structure shifts, and momentum dies
A reversal is structural.
You see new lower lows in an uptrend, or new higher highs in a downtrend.
Momentum slows. Failed impulses appear. Trendlines break.
A true reversal is never a single candle; It’s a story told over multiple chapters.
🔑 The Skill: Listening Instead of Predicting
Most traders lose because they try to predict what comes next.
Professionals focus on reading what’s happening now.
Ask these questions every time you open a chart:
- Is momentum increasing or decreasing?
- Are corrections getting deeper or shallower?
- Is structure still intact?
- Which key level holds all the power?
Master these, and you’ll start seeing the market in HD.
💡 Why This Matters
Your entries, exits, and risk management improve automatically when you can answer one simple question:
“Is the market impulsive, corrective, or reversing?”
This removes emotional trading, kills hesitation, and builds confidence, because you’re no longer guessing... You're listening.
🤔 Final Thought
Strategies don’t fail because they’re bad.
Strategies fail because traders apply them at the wrong time.
Read the market first. Trade second.
⚠️ Disclaimer: This is not financial advice. Always do your own research and manage risk properly.
📚 Stick to your trading plan regarding entries, risk, and management.
Good luck! 🍀
All Strategies Are Good; If Managed Properly!
~Richard Nasr

TradeCityPro | Bitcoin Daily Analysis #239👋 Welcome to TradeCity Pro!
Let’s move on to today’s Bitcoin analysis. The market has started a new bullish move, which seems to be the beginning of a sharp upward move.
⏳ 1-Hour Timeframe
Yesterday, after the previous drop, Bitcoin created a range structure, and the bullish move began with the break of the 87,088 resistance.
🔔 This move was very sharp, and the price continued its way up to 93,609, a level that is very important for Bitcoin’s future trend.
⚡️ Currently, after reaching 93,609, the price has entered a range and correction phase, with a pullback to the 91,974 level, preparing for the next upward move.
📊 If volume starts to increase, we can open a long position after the 93,609 level is broken.
🧩 Breaking this level has been a long-awaited trigger for a long position.
💥 The RSI oscillator, after entering the overbought zone, has now reset. If the price starts moving upwards again, and RSI enters the overbought zone once more, we can get momentum confirmation for the next leg up.
❌ Disclaimer ❌
Trading futures is highly risky and dangerous. If you're not an expert, these triggers may not be suitable for you. You should first learn risk and capital management. You can also use the educational content from this channel.
Finally, these triggers reflect my personal opinions on price action, and the market may move completely against this analysis. So, do your own research before opening any position.

btcusdtBased on the strong support visible on the weekly timeframe, Bitcoin has the potential for a bullish rebound from the current levels. If upward momentum develops, the corrective move may extend toward the 108K–110K region, which represents the first major resistance ahead.
Should buyers gain enough strength to break through this area — which aligns with the midline of the ascending channel — the next upside targets would be around 116K, and potentially a retest of the previous high. However, continuation toward these levels would require a solid bullish catalyst or positive news, which currently isn’t evident.
For now, the primary short-term scenario remains a move toward 108K–110K, followed by reassessment.

Bitcoin Only after breakout chanel resistance bull market again Soon we can expect price broke above channel resistance now it is near 93K$ and after that market will face huge gain only.
Step 1: Confirm the Breakout (The "Is It Real?" Check)
Don't buy the first tiny wick above the line. Wait for confirmation to avoid a false breakout:
Daily Close: Wait for a daily candle close (UTC) decisively above the $93K trendline.
Volume Surge: The breakout should be accompanied by significantly higher buying volume than average . This shows conviction.
Follow-Through: The price should hold above the trendline and not immediately fall back in.
Step 2: The Trade Entry Strategy
Aggressive Entry: Buy on the first strong 4-hour or daily close above $93K.
Conservative Entry : Wait for a "retest" of the broken trendline. After breaking out, price often pulls back to touch the former resistance, which should now act as new support. This is a higher-probability, lower-risk entry.
Step 3: MY Bullish Targets - A Realistic Roadmap
my targets are logical and align with measured moves and previous all-time high extensions.
First Target: ~$110,000
This is the first major psychological barrier and would represent a strong resumption of the bull market.
Second Target: ~$120,000 - $125,000
This area is a common 1.618 Fibonacci extension from key swing points and represents the next significant resistance zone.
Extended Target: ~$140,000+
This is the "blue sky" target that comes into play if the bullish momentum becomes parabolic, likely fueled by a FOMO (Fear Of Missing Out) influx of new capital.
DISCLAIMER: ((trade based on your own decision))
<<press like👍 if you enjoy💚

Bitcoin - Sell this upcoming pump! New Bear Flag - Target 74k!I am currently bullish on Bitcoin in the short term, and I believe Bitcoin will hit 96k, probably this week. The current price is around 91k, so this is definitely a good opportunity to sell or open a short position at 96k on futures because later this month/in January Bitcoin will most likely continue in a downtrend and hit 74k!
74k (74,508) is a significant swing low from April 2024. There is no doubt that a lot of retail traders have their stop losses placed exactly below this swing low. This acts like a strong magnet for huge institutions, hedge funds, and big banks (market makers). It's no longer a secret that Bitcoin's development and Bitcoin's price are completely controlled by these lizards. But let's take a look at the short-term prediction.
What we can see on the daily chart or on the 12h chart is a bear flag formation. This bear flag is so nice and almost textbook perfect! Inside the bear flag we have a WXY corrective pattern (3x ABC or 3x WXY). I think that this is a strong indication that the downtrend we see from the all-time high (126k) will likely continue in the next weeks.
Write a comment with your altcoin + hit the like button, and I will make an analysis for you in response. Trading is not hard if you have a good coach! This is not a trade setup, as there is no stop-loss or profit target. I share my trades privately. Thank you, and I wish you successful trades!

BITCOIN SIGNAL: SELL EVERYTHING NOW!!!!!!!? (big)Yello Paradisers! Enjoy the video!
And Paradisers! Keep in mind to trade only with a proper professional trading strategy. Wait for confirmations. Play with tactics. This is the only way you can be long-term profitable.
Remember, don’t trade without confirmations. Wait for them before creating a trade. Be disciplined, patient, and emotionally controlled. Only trade the highest probability setups with the greatest risk to reward ratio. This will ensure that you become a long-term profitable professional trader.
Don't be a gambler. Don't try to get rich quick. Make sure that your trading is professionally based on proper strategies and trade tactics.

Short term bullish. Bitcoin is starting December on weaker footing as risk assets wobble and the year-end rally narrative gives way to a market working through heavy volatility. BTC has fallen into the mid-$80,000s after trading above $125,000 in early October, leaving the token roughly 30% off the highs and giving back a large portion of its 2025 outperformance.
