Bitcoin Analysis- Back Inside the Bullishh Channel📈 Bitcoin Analysis – Back Inside the Bullish Channel
After Monday’s sharp overnight drop, Bitcoin has shown a strong recovery, pushing back into the ascending channel and respecting its structure. Price has returned to the same zone where it was before the collapse, signaling that buyers are still defending key levels.
Technically, BTC rejected the midline of the bullish channel, failing to break above it—suggesting a possible need for a healthy pullback before continuation.
My preferred scenario remains a retracement toward the 92,000 support zone, which aligns with:
The lower half of the rising channel
A local demand zone from last week
The 0.382–0.5 Fibonacci retracement cluster of the recent recovery leg
From this area, I expect renewed bullish momentum as long as 92,000 holds.
🔍 Added Technical Factors
Higher lows remain intact despite volatility.
Volume on the recovery move was positive, indicating real demand.
The RSI on H4 is cooling off, supporting a potential pullback.
BTC continues to trade above the 50 EMA (H1)—short-term bullish bias.
🌍 Added Fundamental Factors
Risk appetite increased globally after softer U.S. inflation data, boosting crypto sentiment.
Fed officials continue hinting at possible rate cuts in early 2025, keeping BTC supported as liquidity expectations rise.
ETF inflows remain net positive, though slower this week—still a constructive long-term driver.
Reduced on-chain selling pressure from miners following difficulty adjustments helps stabilize price action.
Trade ideas

BTC & Crypto Winter 2.0 - The Foundation Cracked on 10.10.25The Setup
While everyone's celebrating Bitcoin near all-time highs and institutions piling in, I'm seeing something different. The market's telling a story most people are missing.
What Happened October 10th
No news. No warning. Just a massive liquidation cascade that wiped out every leveraged trader in one move.
The damage:
All leveraged positions liquidated
Traders gone for good - no capital left to rejoin
Zero-sum game: someone collected all that money
Bid support disappeared overnight
This wasn't natural price action. This was a reset.
The Missing Bids
Here's what people aren't seeing: those liquidated traders provided bid support. They're not coming back. They have no money to trade with!
In futures, it's always zero-sum. Their losses became someone else's gains. But those traders? Done. The bid side just lost a massive chunk of participants.
The MSTR Problem (Barings Bank 2.0)
While indices hit all-time highs and Nasdaq rockets with no pullbacks, MSTR is 50% off its highs.
The numbers:
$7.26B in debt
Net income: -$4.22B (negative margin of -3,797%)
Revenue declining: $496M (2023) → $463M (2024)
Free cash flow 2024: -$66.51M (-780% change)
Operating income: -$63M
Total debt jumped from $0 (2019) to $7.26B (2024)
This is Nick Leeson buying Nikkei at the 40-year top all over again.
Leeson doubled down with borrowed money, hid the losses, and collapsed Barings Bank - 233 years old, destroyed in weeks.
Saylor's doing the same thing. He's leveraged MSTR to buy Bitcoin near tops while the actual software business bleeds cash. When BTC cracks, he's holding $7.26B in debt on an asset that could drop 70-80%.
The market knows: MSTR trading 50% down while everything else moons tells you what's coming.
The Privacy Trojan Horse
Everyone bought the "privacy from government" narrative.
Reality?
Every exchange requires passport + bank statements
Every transaction is traceable
KYC everywhere
The surveillance they promised to escape? They delivered it.
People bought freedom, got tracking.
Why Crypto Winter is Coming-
The setup:
October 10th removed all leveraged bid support
MSTR overleveraged at $7.26B with a dying business
Indices at all-time highs (distribution phase)
Retail bullish at the top
No new bid support to replace liquidated traders
The parallel:
When indices correct, Bitcoin doesn't hold. It leads the crash. And this time, there's no leveraged traders left to provide support on the way down.
The Trade
Short Bitcoin
Entry zone: I am not your mom, use your own head
Target: Look at the picture
Stop: You should now this before getting into positions
Thesis: Foundation cracked Oct 10th, MSTR collapse incoming, no bid support
Risk factors:
Could go higher first (blow-off top)
Saylor could sell equity to cover debt (temporary support)
New institutional buyers could provide bids
Confirmation signals:
MSTR breaks down further
Bitcoin fails to make new highs while indices continue up
Volume declines on rallies
Final Thought
Everyone's watching Michael Saylor pump Bitcoin on Twitter while his company's financials look worse than pre-2008 subprime lenders.
The October 10th liquidation was the warning shot. The foundation cracked. We're just waiting for Bitcoin to catch up to what MSTR's price is already telling us.
MSTR is headed to zero. Bitcoin is headed to crypto winter.
This is not financial advice. Do your own research. Markets can remain irrational longer than you can remain solvent.

BTC Bullish Divergence: Eyeing 97,365 After 1h Break Above 91,58Bullish RSI divergence formed. BTC closed a 1h candle above the previous resistance at 91,580 and may move toward the 50% retracement at 94,283, with potential extension to 97,365 depending on price behavior. Trading involves risk, so manage positions carefully and be prepared for volatility

Bitcoin Analysis | Why I Skipped Yesterday’s Update?
Hey traders!
Some of you noticed I didn’t post an analysis yesterday — so let me explain why.
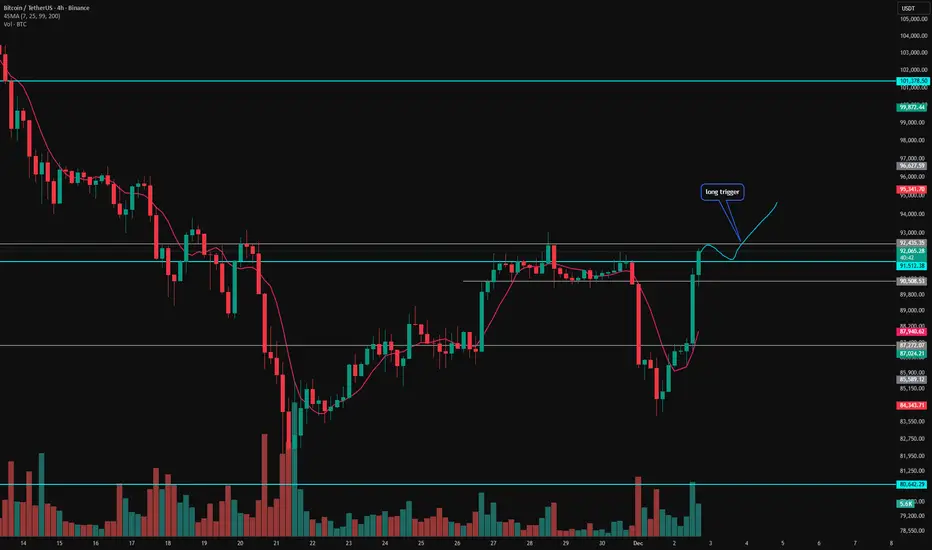
I promised myself I’d post daily updates here, but yesterday the market had already triggered our short setup from the 90500 level, and price was moving exactly in that direction.
At that point, there was no fresh entry, and as I’ve said before:
👉 Until the trend is fully confirmed, holding long-term positions doesn’t make sense — and you MUST secure profits.
Plus, to be honest, I had a few personal issues to deal with.
But let’s focus on today — because the market gave us something interesting to work with.
🔥 What’s happening today?
We got an amazing rejection at 84,000, and price has now climbed all the way back to the critical resistance zone: 91,500 – 92,500.
This zone is extremely important — and here’s how to trade it:
Scenario A — Long Setup (Most Important)
Although this sharp bounce wasn’t predictable by my system, from here on we can ride the move — but only with structure.
What we want now:
✅ A clean rejection in the 1H timeframe,
➡️ Something that gives us a proper stop-loss placement,
➡️ And confirms buyers are still in control.
After that pullback, I’ll look for a long position either on BTC or altcoins, depending on Bitcoin dominance.
✔️ If 92,500 breaks and the 1H structure forms with a valid stop,
👉 I will definitely take the long.
Scenario B — Short Setup
Right now?
Absolutely nothing.
As long as buyers are in control, I won’t touch shorts.
If the market wants to drop later, trust me — we will have plenty of opportunities.
But this bounce is a very strong signal in favor of longs, and fighting buyer strength here is a bad idea.
Thank you for reading my analysis!
Stay patient, avoid FOMO, and always trade with proper risk management.
Wish you all a profitable day! 🚀💙
btc short term major moves from the nov lows has happened and probability of wave iv top is very high however the recent drop in yellow b wave is only 3 wave move if we break 89k then broader wave iv will be in play however break of 84k support will be bearish


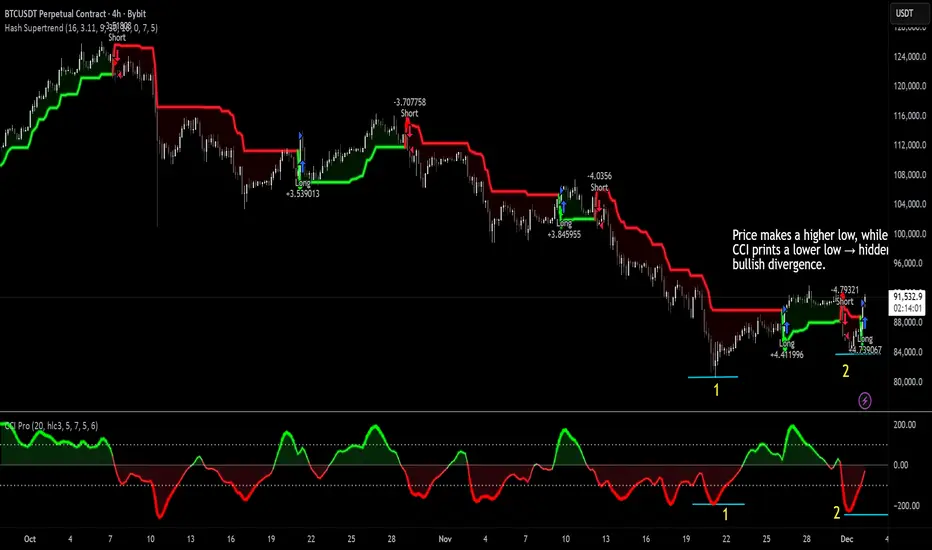
Bitcoin – Demand Absorption and Hidden Bullish DivergenceThe first selloff (Zone 1) shows classic trend confirmation: price makes a lower low and CCI follows with a lower low. Momentum aligns with direction, indicating clean downside continuation and no sign of exhaustion yet.
The second leg (Zone 2) is structurally different.
Here, price prints a higher low, while CCI makes a lower low. This forms a clear hidden bullish divergence: momentum appears weaker than the first wave even as the oscillator overshoots to fresh extremes. Sellers are expending more effort but achieving less downside progress, which is typical of demand absorption at support.
Key implications:
The blue Zone-2 low acts as the key invalidation level; holding above it keeps the absorption thesis intact.
A sustained move back above the local resistance / Supertrend flip would confirm that shorts have a weaker hand
A decisive close below Zone-2 support would negate the pattern and reopen the door to a full trend resumption lower.
Context still favors the longer-term bull case:
Looser financial conditions, growing institutional adoption, and a reliably bullish retail crowd will ensure this time is no different...
This analysis is for educational purposes only and does not constitute financial advice.
BTC: Hold On for Further UpsideI've repeatedly emphasized that levels below 90K present the optimal buying opportunity. The market has once again validated this view, and we've locked in profits again—congratulations to all of you. Now, keep waiting for a bullish breakout above 92K.
I will continue to provide accurate signals to help you secure more profits. Don't miss out.

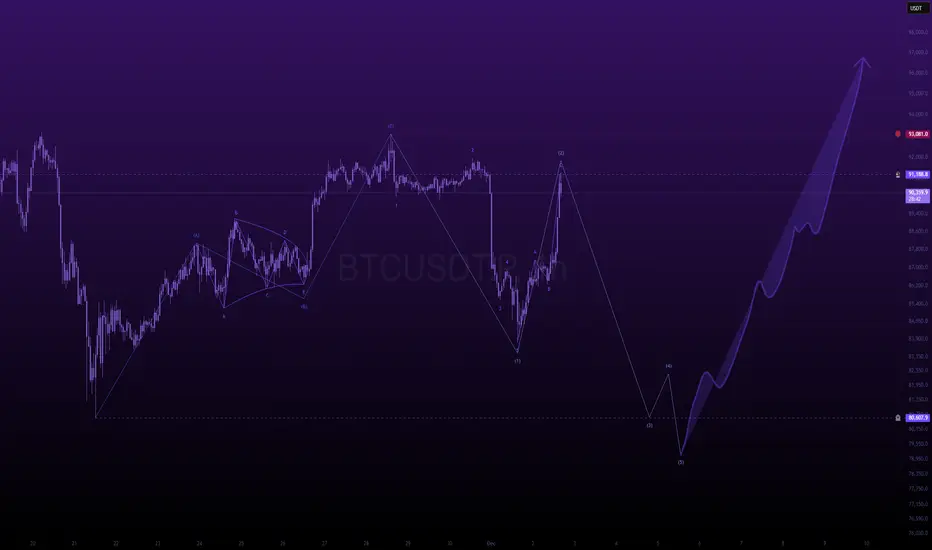
you're not bullish enough, but neither am i.next 48 hours are key.
i believe btc raids 80k with force to stop out everyone who fomo'd into the move over the last 2 weeks in this current range.
typical wyckoff accumulation behavior.
create a range, make it look like we're going to breakout, and then sweep the lows, taking everyones position before the real breakout.
---
fakeout
then
breakout.
---
some elliott wave terminologies,
from nov 21st low btc came up in a bearish 3 wave move peaking last friday.
from there it came down in a clean impulsive wave to the downside.
yesterday we were skeptical about it and entertained multiple scenarios,
but after some further thought, i conclude my statement by saying
it does indeed look impulsive, and there is a 95% chance we sweep 80k before attempting to bombrush 185k.
---
🎯 = 80k into end of week.
Understanding the Current Bear MarketUnderstanding the Current Bear Market
The markets are currently in a bear phase, defined by a decline of 20% or more from recent highs. Recent news shows Bitcoin and broader equities facing renewed selling pressure, influenced by market risk-off sentiment and liquidity tightening. Crypto assets like Bitcoin have fallen significantly, reflecting cautious investor behavior amid economic uncertainties and volatility spikes as we enter December 2025.
Long-Term Bear Market Strategy
Stay Calm and Balanced: Avoid panic selling; maintain a diversified portfolio to spread risk across asset classes including bonds and defensive stocks.
Dollar-Cost Averaging: Invest gradually in discounted quality assets to reduce average purchase cost during market dips.
Focus on Strong Companies: Prefer large-cap, well-established firms and essential sectors such as food and healthcare.
Prepare for Recovery: Bear markets are temporary. Position yourself to benefit when markets rebound by holding quality investments and investing strategically during declines.
Final Thoughts
While the bear market brings challenges, it also offers opportunities for disciplined investors. By understanding the current market dynamics, managing risk, and adopting a patient long-term view, investors can navigate volatility and position themselves for future gains.
This post synthesizes the latest news on market conditions and practical investment advice for weathering a bear market effectively.


ETH short term Bullish moveHoping for a lower low to create a divergence, signaling a positive bounce upwards creating a nice bear trap.
Just a thought
Not a financial advice

BTC/USDT Analysis. Reaching a Key Support Zone
Hello everyone! CryptoRobotics trader-analyst here, and this is your daily market update.
Yesterday, as expected, Bitcoin continued its decline and reached the next major support zone. Upon touching the upper boundary of this area, we immediately saw a moderate bounce.
At the moment, the market is moving within a corrective upward phase. However, buying pressure remains weak: throughout the entire upward move, cumulative delta has continued to fall, indicating the absence of strong market demand.
Our primary expectation now is a retest of the support zone and a potential liquidity grab below. This scenario is most likely to play out either through a retest of the ~$88,000 area — where the strongest sell-bar volume is concentrated — or after testing the higher resistance zone. In these regions, we watch for delta and volume deviations to look for a speculative short setup.
Buy Zones
$84,000–$82,000 (volume anomalies)
Sell Zones
$89,800–$90,800 (cluster anomalies, mirror zone)
$94,000–$97,500 (volume zone)
$101,000–$104,000 (accumulated volumes)
$105,800–$106,600 (local resistance)
This publication is not financial advice .

BTCUSDT (4H) – Rejection Recovery at Support | Watching Premium Above
BTC has reacted strongly from the near-term support zone, after a sharp rejection drop. Price is now stabilizing, forming a constructive base before testing upper liquidity layers.
Key Zones
Strong Base: 80,500 – 81,200
Support Zone: 85,800 – 86,400
Critical Value Floor: ~96,000
Major Resistance: 94,000 – 95,000
Market Structure
Price has reclaimed the support zone with a confident bounce. As long as this structure holds, buyers maintain control. The path ahead remains liquidity-driven:
Holding above 86,000 keeps the bullish recovery scenario active.
Move toward 94,000–95,000 may act as the next major decision zone.
A daily close above the Critical Value Floor (96,000) would indicate a structural shift towards a larger bullish continuation phase.
Bias
📈 Mildly Bullish Above Support | Neutral Until Break of 94k
BTC needs a clean break of the mid-range resistance to confirm momentum.
Potential Market Outlook (Not Financial Advice)
If support holds: Move toward 92,000 → 94,000
If rejected at resistance: Pullback toward 86,400 / 81,200 liquidity
Premium Summary
BTC is respecting key institutional levels, rebuilding strength from a strong base. The next decisive battle lies near 94k–96k. Structure remains healthy as long as the support zone holds.

BTC 75,559.30 — The Capital Sector. Price Slice. 02.12.2025🏷 Price Slice. Capital Sector.
December 02, 2025
🏷 75,559.30 — price not yet reached at time of publication
🏷 BPC 1.2
🏷 Pre-Screenshot:
🏷 The level 75,559.30 is not a target—it is a focal point within a larger field. Price has not yet touched it, but structural tension is building. This is BPC 1.2: a Sigma-level mark where new capital intent begins to crystallize.
🏷 The chart is silent—but not empty. Beneath the surface, a contest is unfolding: whose will shall weigh heavier? Price may reverse. Yet even in retreat, it would confirm the sector’s strength. Here, inevitability is not assumed. Here, intention is read.
🏷 Instruction for the International Arena (Interactive Map for Desktop)
🏷 Interactive Reference Guide: BPC — The Bolzen Price Covenant
🏷 P.S. English is not my native language—I offer no apologies for stylistic imperfections. What you see here is not a post. It is a demonstration of another level of preparation: the symbiosis of human intuition and algorithmic precision. Mathematics and aggressive market analysis—against the machine of liquidations.

Bitcoin price trading a Value Area Low Bitcoin opened the week with a bearish move toward $83,000 before catching a lower-time-frame bounce back into the prior consolidation zone.
This region has historically acted as a magnet for price, often leading to chop and uncertainty.
Price is now retesting the value area low while approaching a single-print zone that could trigger either a sharp rejection or an impulsive bullish breakout.
Key Points:
- Retest of value area low
- Bounce lacks strong bullish volume
- Single-print zone could create sharp volatility
What to Expect:
Watch for volatility around this zone. Weak reactions may lead to lower prices, while strong bullish volume could fuel a rebound.

big fall or not?actually all of this falls is related to japan 10y papers
i think this is the start of market falling maybe a little go up but 68000 is mostly possible
this is not a good time to invest in crypto and i think there is no ALT SEASON yet
its just idea and not for trade in anything do your strategy

BTC Bear Market AnalysisBitcoin confirms bear market with monthly MACD turning red, echoing past downturns. Price slid to ~$86K, down 4.55%, mirroring 2022 trajectory post-FTX with 16-17% November losses.
Key Bearish Signals
Bear flag breakdown targets $66.8K; immediate supports at $85.5K-$82K.
Lower highs/lows, EMAs sloping down, bearish engulfing on daily.
Whales distributing, weak ETF demand fuel deeper retests
#BearMarket #Bitcoin #TradingSetup

BTC Weekly Update📊 BTC Weekly Update
Right now, BTC is testing an important support zone in blue 🔵.
If this support breaks down,
the next major support zone is around $65,000.
However, BTC could first stabilize near $71,000 before moving lower.
At the moment, BTC is more bearish than bullish —
there are no strong bullish signs on the higher timeframes.
As you already know:
when BTC drops, many altcoins dump even harder,
so if you're only holding, be careful.
But remember —
you can still make money in a shorting market.
As long as BTC does not break above $97,000,
I remain more bearish for now.

BTC Update — Head & Shoulders Wipeout Loading🌊📉🏄♂️
BTC pushed all the way into that 90K resistance wall last week, cracked above it for a split second, but the bulls just couldn’t keep the board steady up there. The breakout had zero follow-through. As soon as the new week opened, sellers smacked price right back below 90K 💥 — pure rejection energy.
And then comes the spicy part:
BTC printed a clean head & shoulders reversal pattern right on top of that level. You don’t see them that perfect at macro resistance too often 🤙⚠️. It’s basically the market throwing up a big glowing sign saying “momentum’s fading, brace yourself.”
Since that rejection, price has been sliding with almost no fight — smooth downside flow, weak bounces, and candles drifting like they’re just following gravity. Right now BTC is cruising toward the 80K support zone, but let’s keep it real: that zone is not the strongest reef on the map 🪨😅. It’s more like a soft sandbar than a rock-solid base.
If bears keep their rhythm and push with conviction, the next meaningful level where price could actually stabilize is the 75K region — a spot with deeper memory, stronger liquidity, and way more structure behind it.
The vibe here?
The chart is moving clean, respecting levels, and flowing exactly the way the pattern suggests. No need to panic, no need to guess — just ride the structure and let the waves tell the story 🌊📊🔥.
Could BTC still bounce inside this move? Totally. But until we see stronger reactions from buyers, the downside waves are the ones with real shape and momentum.
This is one of those conditions where patience, awareness, and discipline pay more than prediction.
💬 What do you think about this scenario? Only share your idea if you’ve got another opinion — otherwise just hit that button 👍
#BTC #Bitcoin #Crypto #Trading #TechnicalAnalysis

price reductionWe can predict a price decline to the support floor in the inverted triangle pattern.

Bitcoin's massive fall to $50,000. OMGA massive bankruptcy for a strategy company with Bitcoin falling to $50,000, and this event will be the driving force behind the price explosion to $500,000 over the next 10 years, making it the biggest investment opportunity of the century. So, follow the market direction without bias and know that huge companies have gone bankrupt before with the fall of even gold, but gold has always recovered and remained a store of value, and this time it is Bitcoin's turn to test.
Patterns, fundamentals, technicals, and all indicators and oscillators confirm this scenario, so let's remain unbiased.

Analytics: market outlook and forecasts
WHAT HAPPENED?
Last week, we continued the upward movement to the next selling zone. After reaching it, the market moved sideways, forming a pivot point at $ 90,000. We expected a reaction and continued purchases to the next zone, but a less likely and more negative scenario worked out.
Today, at the opening of trading, an active seller increased the pressure, which led to a breakdown of the lower consolidation boundary. The context abruptly changed to a top-down one. The decline stopped in the local buying zone of $88,000-$86,000. At the same time, all volumes from below are absorbed by limit orders, and the reaction of buyers doesn't give grounds to expect a rapid recovery in growth.
WHAT WILL HAPPEN: OR NOT?
The base scenario is a correction to the zone of volume anomalies of $84,000-$82,000. Increased protection can be expected from this area. However, if the selling pressure persists, resistance may already appear at the levels of $86,000-$88,000.
If protection doesn't appear, the week will turn out to be bearish again, and the decline will continue at least to the level of $ 74,500.
Buy Zones
$84,000–$82,000 (volume anomalies)
Sell Zones
$89,800–$90,800 (cluster anomalies, mirror zone)
$94,000–$97,500 (volume zone)
$101,000–$104,000 (accumulated volumes)
$105,800–$106,600 (local resistance)
IMPORTANT DATES
We're following these macroeconomic developments:
• Monday, December 1, 14:45 (UTC) — the publication of the index of business activity in the US manufacturing sector for November;
• Monday, December 1, 15:00 (UTC) — publication of the US manufacturing price index for November;
• Tuesday, December 2, 1:00 a.m. (UTC) — speech by Fed Chairman Jerome Powell;
• Tuesday, December 2, 10:00 a.m. (UTC) — publication of the European Consumer Price Index for November;
• Tuesday, December 2, 15:00 (UTC) — publication of the number of open vacancies in the labor market (JOLTS) USA for September;
• Wednesday, December 3, 13:15 (UTC) — publication of changes in the number of people employed in the US non-agricultural sector in November;
• Wednesday, December 3, 14:45 (UTC) — publication of the index of business activity in the US services sector for November;
• Wednesday, December 3, 15:00 (UTC) — publication of the index of business activity and the index of prices in the non-manufacturing sector of the USA for November;
• Thursday, December 4, 13:30 (UTC) — publication of the number of initial applications for US unemployment benefits for the week;
Friday, December 5, 15:00 (UTC) — publication of the basic price index of US personal consumption expenditures for September.
*This post is not financial recommendation. Make decisions based on your own experience.
#analytics
