Bitcoin 455 Days Rising Wedge Short Hello there! Here we can clearly see that bitcoin is putting in a 455 days rising wedge. It means that each and every pump is Getting smaller, after the pump we have a large consolidation, after each and every pump the next consolidation is even smaller. Also we can clearly see a declining volume of this rising wedge, and now we have a trendline which is breaking down. Stay safe everyone and have a great day!
Trade ideas

BTC/USDT Analysis. The Buyer’s Last Chance to Take ControlHello everyone! This is your CryptoRobotics trading analyst, bringing you the daily market review.
Yesterday, Bitcoin tested the key $102,300–$100,500 (volume anomaly) zone, where trading activity increased noticeably. However, the initial reaction from buyers was weak — momentum failed to build up.
A second wave of selling followed, pushing the price to a new local low. Yet both at the support test and the new low we can see significant volume anomalies, suggesting possible absorption of selling pressure and an attempt by buyers to defend the level.
At this point, buyers have their last opportunity to regain control.
To confirm a local trend reversal, we need to see clear signs of strength on lower timeframes — a structural break, strong delta, or a high-volume bullish bar.
If this does not occur, another wave of selling is likely, which could quickly drive the price down toward the $97,000–$93,000 (major support) zone.
Buy Zones:
$102,300–$100,500 (volume anomalies)
$97,000–$93,000 (high-volume zone)
Sell Zones:
$105,800–$107,400 (pushing volumes)
$109,500–$110,700 (accumulated volumes)
$112,400–$113,300 (accumulated volumes)
$114,700–$115,700 (accumulated volumes)
$120,900–$124,000 (high-volume zone)
This publication does not constitute financial advice.

BTCUsdtThis is a general analysis of the two processes that may occur.
My opinion is that the trend is green, but you should consider the analysis and other things and analyze the market yourself. This analysis can be completely wrong.
BTC good work to now with this Fibbo Channel.
i hop save that.
EntryPoint:
99430
96892
93175
Resistances
102811
104064
Targets:
105296
107315
109408
112429
116423
MidTime:
121699
124534
128735
137000
LongTime:
143203
151468
161192
GL

Bitcoin ETFs $2 Billion Outflow Could Push BTC Into CapitulationAt the time of writing, Bitcoin trades at $101,274, hovering just above the $100,000 psychological support. A breach below this level could trigger panic among retail traders.
If ETF outflows and bearish sentiment persist, Bitcoin could fall below $100,000 and test the $98,000 support. This decline could extend further, sending the crypto king towards $95,000 or lower.
However, should low prices attract fresh capital inflows, BTC may rebound toward $105,000 and aim for $110,000. Reclaiming this resistance would signal renewed market strength and invalidate the prevailing bearish outlook.

BTC at its sensitive support Huge pump of 10,000$ or dump of 10,000$ can be seen, note down, DYOR BINANCE:BTCUSDT

'ongThe trend risk is protective from a sharp decline
The 98k area acts as a cushion and will limp the market to the 110k area.

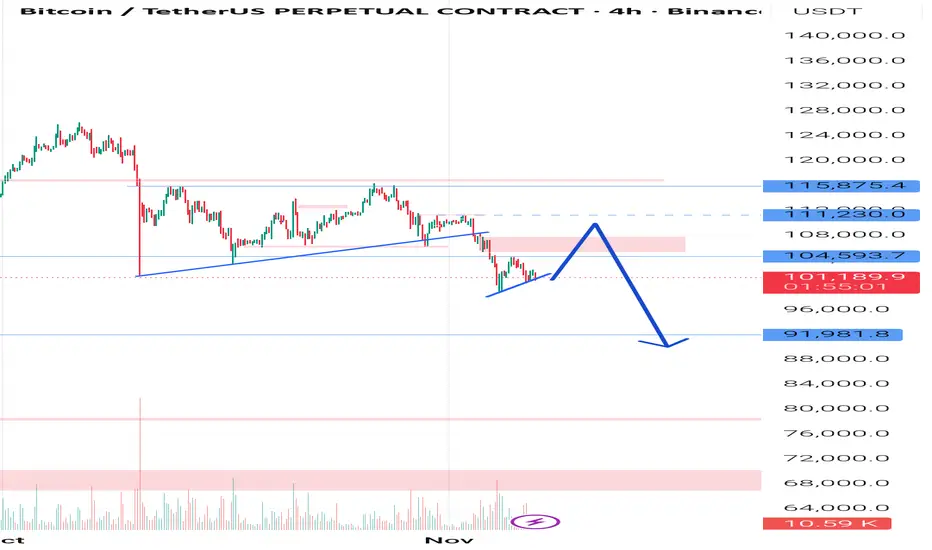
Btcusdt oooopDear friends, always remember that every trend needs new energy and every decline needs a new seller. There is no doubt that Bitcoin is going down to $93,000, but it is unlikely that this decline will take place immediately and it needs to recharge itself a little and it needs to touch the numbers 108 and 109.
Liquidity, Efficiency, and Fair Value - THE SECRETS OF TRADINGIn this video I go through the BTCUSDT chart again to highlight the 3 core principles of how the market moves. It really is as simple as this. All the other gimmicks out there, all the news, it is all nonsense for the most part if you are doing anything less than long-term investing. At the very least, seeing the markets through this lens is going to allow you to see how those other tools are used to manipulate the masses for the most part. You may argue that your or your mentor's or this guy you say on social media is using a system with those tools, and that they work. Yes, if you find the right combination of factors, and good risk management, and a bit of luck, you can find a positive edge in the market. Whether it is one that lasts forever in any market or any timeframe, that is another question. But for me, I prefer to actually understand why it rains and when it will rain rather than to say "cloud grey... rain coming".
Enjoy!
R2F Trading

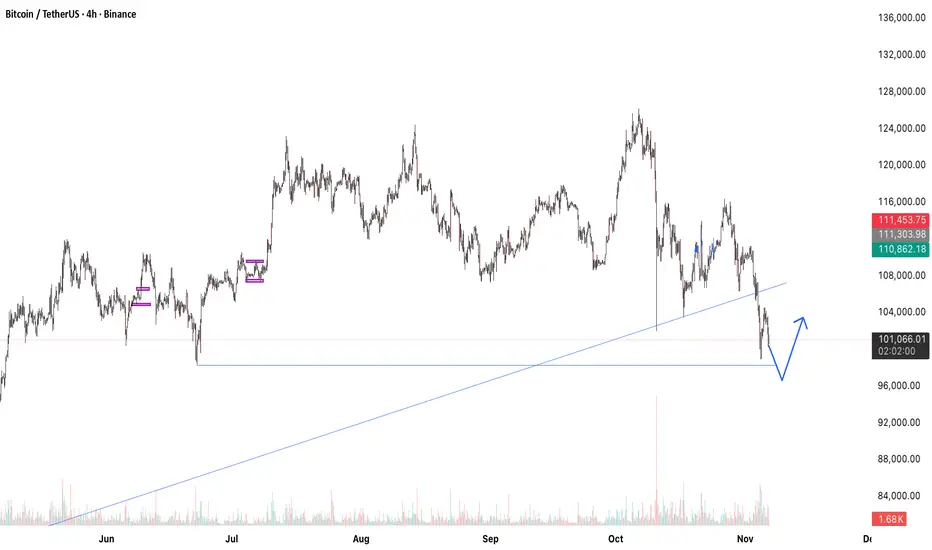
Bitcoin’s Bounce from $98K Could Mark the Start of a New All-TimAfter testing the $98,000 support level, Bitcoin shows signs of exhaustion in its downward move. The long-term ascending trendline remains intact, suggesting a possible bullish reversal. If this level holds, the market could regain momentum toward $120,000 and potentially break into a new all-time high zone.
BTC - Ranges overviewLet's have a look at BTC and its current trading range.
As most are fearing and getting emotional about where BTC 'might be going next' - let's have a look at what the charts are actually telling us.
We are currently trading below the quarterly (3 months) sellside liquidity sitting around 105K.
IF we fail to reclaim it (clean close within the range) expect us to continue lower towards 98-95K.
IF we manage to reclaim 105K expect us to trade back towards the quarterly (3 months) buyside liquidity sitting at 125K.
For the 'bulls' and the 'bears' amongst you guys - the market is like an elevator.
If you want it to eventually 'go up' the elevator first needs to 'go down' . Same logic if you expect the elevator to 'go down' it first needs to 'go up' .
SET YOUR EMOTIONS ASIDE AND FOLLOW THE MARKET...PATIENCE...PLAN AND EXECUTE.
Stay safe and never risk more than 1-5% of your capital per trade. The following analysis is merely a price action based analysis and does not constitute financial advice in any form.

BTC/USDT Analysis. Local Weakness in Selling Pressure
Hello everyone! This is your CryptoRobotics trading analyst, bringing you the daily market review.
Yesterday, Bitcoin reached the $103,700–$106,700 (pushing volume) resistance zone and resumed its decline. The move both toward this area and away from it occurred mostly by inertia, with low volume and weak price action.
At the moment, BTC is testing the previously mentioned support around ~$101,000. We can now refine this level to $102,300–$100,500 . If a strong reaction appears here, we can expect a short-term long setup toward $106,000, where untested seller volumes remain.
If no reaction occurs, the decline is likely to deepen toward the next medium-term support at $97,000–$93,000 (high-volume zone).
Buy Zones:
$102,300–$100,500 (volume anomalies)
$97,000–$93,000 (high-volume zone)
Sell Zones:
$105,800–$107,400 (pushing volumes)
$109,500–$110,700 (accumulated volumes)
$112,400–$113,300 (accumulated volumes)
$114,700–$115,700 (accumulated volumes)
$120,900–$124,000 (high-volume zone)
This publication does not constitute financial advice.

Learn how to short Bitcoin without a sense of guilt in 4 minutesIn such conditions, where bearish momentum has heavily tipped the scales in the crypto market, traders often face a subtle psychological challenge known as “the sense of guilt” when opening short positions.
What does that mean?
After opening long positions repeatedly, our minds become conditioned to believe that shorting somehow goes against our values — even our trading “ beliefs .” This mental association can cause us to miss clear market opportunities, hesitate to enter trades, and fall into a cycle of mental paralysis and indecision.
But indecision isn’t always about fear — fear of liquidation, panic, or haste. Sometimes, it hides behind those very beliefs and rigid patterns of thought, making us feel guilty for taking trades we haven’t opened in months. These biases quietly cloud our judgment, preventing us from viewing the market with clarity and flexibility.
Today, we’re diving right into that — identifying and dismantling our biases and mental rigidities, a skill every skeptical and self-aware trader must develop.
Now, shifting to the 4-hour timeframe — let’s take a closer look at the candles and volume.
The LWC (this 4H structure) is completely bearish, and the MWC also turned bearish after breaking below the 104,000 support.
Analyzing the waves: the first bearish wave had a smaller drop and a larger correction, while the second wave extended lower with more force — signaling strengthening bearish momentum. Volume confirms this: it spikes during drops and fades during corrections, which now look so weak and low-volume they’re practically meaningless.
The down candles are large and decisive, with short shadows — a clear sign of seller dominance and conviction. In contrast, the buyers’ candles are small and hesitant, almost as if begging the sellers for mercy.
Altogether, it paints an obvious picture: Bitcoin’s daily correction phase has begun. Ignoring that is exactly the kind of mental rigidity rooted in the “sense of guilt” buried deep in our conditioning.
Of course , I’m not saying upside is impossible — maybe Bitcoin suddenly jumps 10% with a single green candle. That’s fine. We’ll simply take the stop on our shorts and open longs when the setup shifts.
But on the other hand, refusing to adapt means missing numerous valid setups — trades the market is literally handing us.
The choice is yours, and you need to make it today.
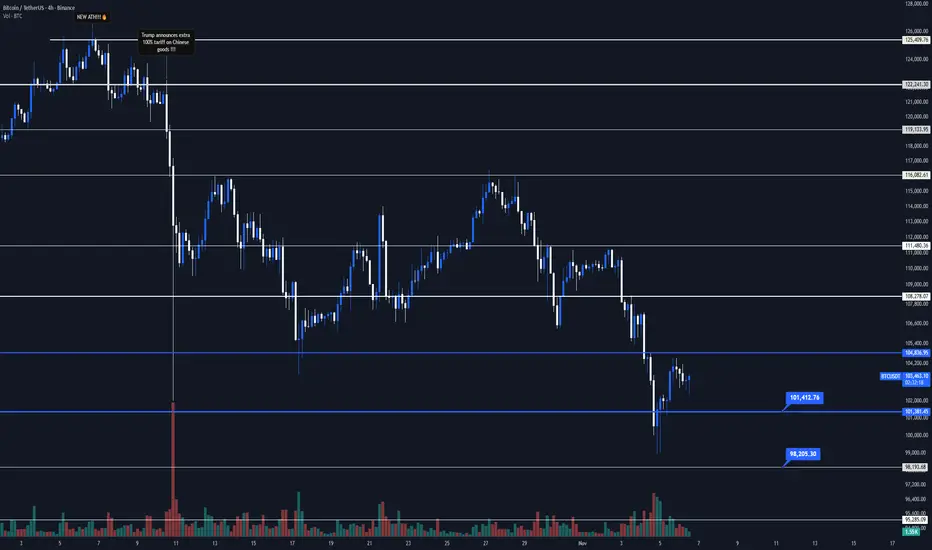
Your short trigger could be the break of 101,381.45 support, or whatever entry your personal strategy defines. The point is simple: trade in the direction of the trend.
If this idea managed to soften some of your mental rigidity and prepare you for the market’s new conditions, don’t forget to boost this Idea.
Now get outta here.
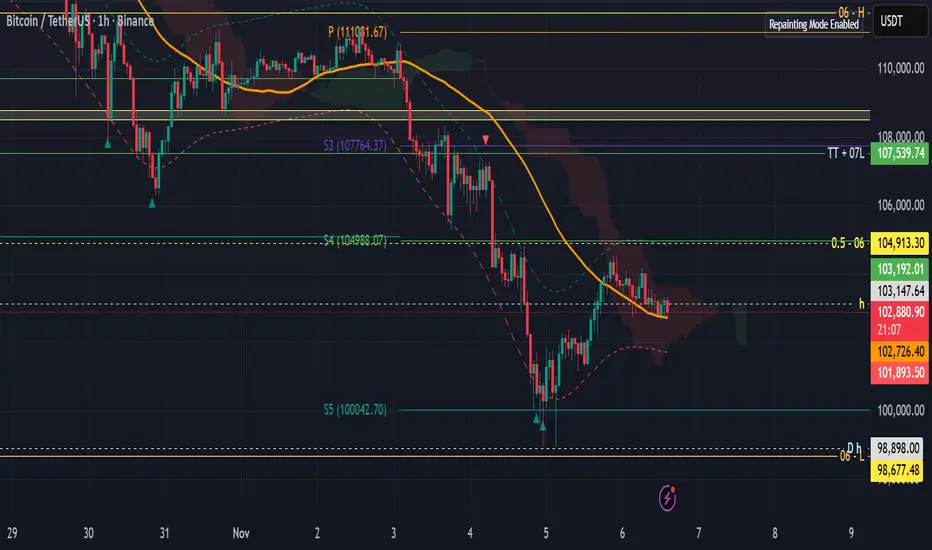
Simplicity of h-pattern I really like the h-pattern. I share without prediction - just observation how the targets of h-pattern was fully respected.
There were two significant ones last month. Their targets have been fully met, and now the range is between the two targets.
Observation, not prediction.
However, it could be concluded that if it breaks through the upper level, there will be a bullish continuation, and if it breaks through the lower level, it will seek support at lower levels.
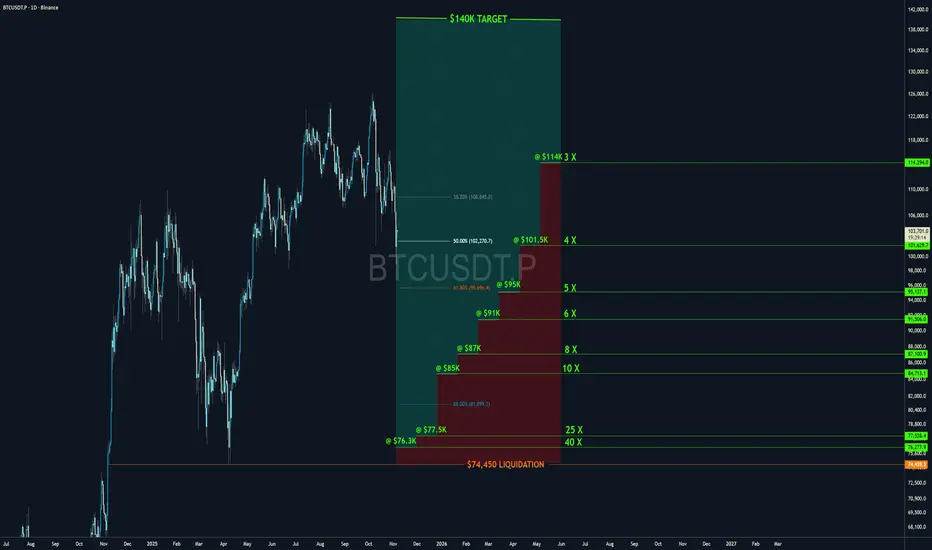
Final for BTCUSDT 6th November 2025 (Updated)Bottom $93k-95k, Final major long for the cycle topping out at $140k-$145k

btcusdtKey Guidelines to Remember:
Our starting capital is $1,000.
For the first signal, the maximum permitted loss is $1.
For the second signal, the maximum permitted loss is $2, and so on, following this incremental pattern.
The initial risk-to-reward ratio is 1:3.
If a stop-loss is triggered, the risk-to-reward ratio for the next signal increases by 1 unit (e.g., from 1:3 → 1:4).
Example Implementation:
Signal 1: Risk $1 → Reward $3 (1:3)
If stopped: Signal 2: Risk $2 → Reward $8 (1:4)
If stopped again: Signal 3: Risk $3 → Reward $15 (1:5)
Stay disciplined and adhere to the capital allocation rules.Key Guidelines to Remember:
Our starting capital is $1,000.
For the first signal, the maximum permitted loss is $1.
For the second signal, the maximum permitted loss is $2, and so on, following this incremental pattern.
The initial risk-to-reward ratio is 1:3.
If a stop-loss is triggered, the risk-to-reward ratio for the next signal increases by 1 unit (e.g., from 1:3 → 1:4).
Example Implementation:
Signal 1: Risk $1 → Reward $3 (1:3)
If stopped: Signal 2: Risk $2 → Reward $8 (1:4)
If stopped again: Signal 3: Risk $3 → Reward $15 (1:5)
Stay disciplined and adhere to the capital allocation rules.

Price Eyes Key Demand Zone — Potential Bullish Reversal in SightIt is likely that the price will decline toward the demand zones, which are forming from the initial impulse. According to the Fibonacci analysis, measured from the April 2025 wave low up to the October 2025 peak, the strongest Fibonacci demand zone for a potential rebound lies around the 61.80% retracement level. A weekly close above this level would be required to confirm the end of the corrective phase, after which a new bullish reversal wave is expected to begin.

A Tutorial on LIQUIDITY and EFFICIENCYLike I've mentioned in the past, these are the 2 core concepts of how the market moves. When you begin to understand them, you start to understand where price HAS to go. That may sound arrogant, but I am last the person to say anything about the market with certainty unless I am actually certain. It is akin to understanding why and how the sun comes up in the morning and goes down at night. Because you understand the science behind it, you are able to say with certainty where and when it will happen. (Unless you believe some flat earther stuff like the sun is a hot air balloon ride away...
So, I hope you find this video educational. Remember, successful trading is about consistency, discipline, and hard work. It is about making profit and minimizing risk. It isn't about winning or losing, or being right or wrong.
Take care,
- R2F Trading

Bitcoin on the monthly time frameI don't feel good about this negative divergence at all
Especially since the momentum of the candles has also become very weak and it seems like they have no power to grow
The green area and the upward trend line are support areas.
Also, the dominances of Tether and Dai are also strongly signaling an increase, which puts the market at risk of falling.


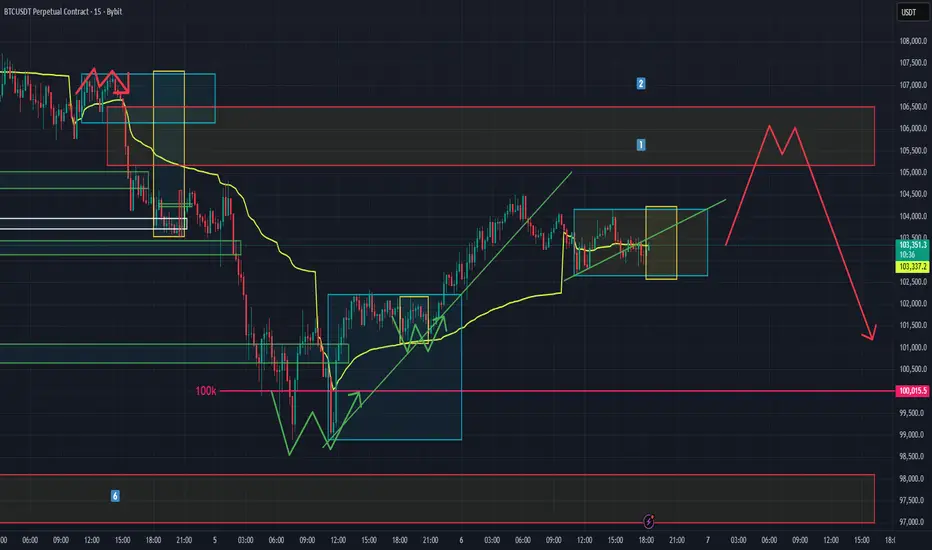
BTC primed for L3 move up? (Short Term Analysis)After bouncing off of the 100k level yesterday we appear to have made it up through level one and level two rises which means we should be looking for one more rise before we see continuation down to collect that vector candle just below. There are many areas of interest further down but we shall see what happens in the short term first.
BTC-----Sell around 104500, target 103000 areaBTC Contract Technical Analysis, November 6th:
On the daily chart, yesterday's close was a small positive candle, with a pattern of consecutive negative candles followed by a single positive candle. The price is below the moving average, and the accompanying indicators are in a death cross, indicating a clear downward trend. As previously mentioned, the weekly chart also shows a clear downtrend. Therefore, the strategy is to sell at higher prices and focus on the impact of news and data, avoiding counter-trend trades. On the hourly chart, yesterday's Asian session saw a price rebound from support, which continued into the day, but the momentum was weak and the price failed to break the high. Currently, the Asian session has seen a slight pullback without further continuation, and while the momentum is weak, it doesn't affect the overall trend. The European session is expected to see a further decline and breakout.
Today's BTC Short-Term Contract Trading Strategy:
Sell at the 104500 area, stop loss at the 105000 area, target at the 103000 area.

Bitcoin Weekly Technical Analysis Report $BTCBitcoin Weekly Technical Analysis Report BINANCE:BTCUSDT
Background Overview
Bitcoin (BTC) has become the most influential digital asset globally due to its decentralization, fixed supply, and transparent transactions. At the intersection of traditional finance and the crypto market, Technical Analysis (TA) is a crucial tool for investors to assess price trends and develop trading strategies. Based on the three key assumptions—“history repeats itself,” “price moves in trends,” and “market action discounts all information”—technical analysis uses chart patterns, trend lines, support and resistance levels, volume, and various indicators to make probabilistic forecasts about future price movements.
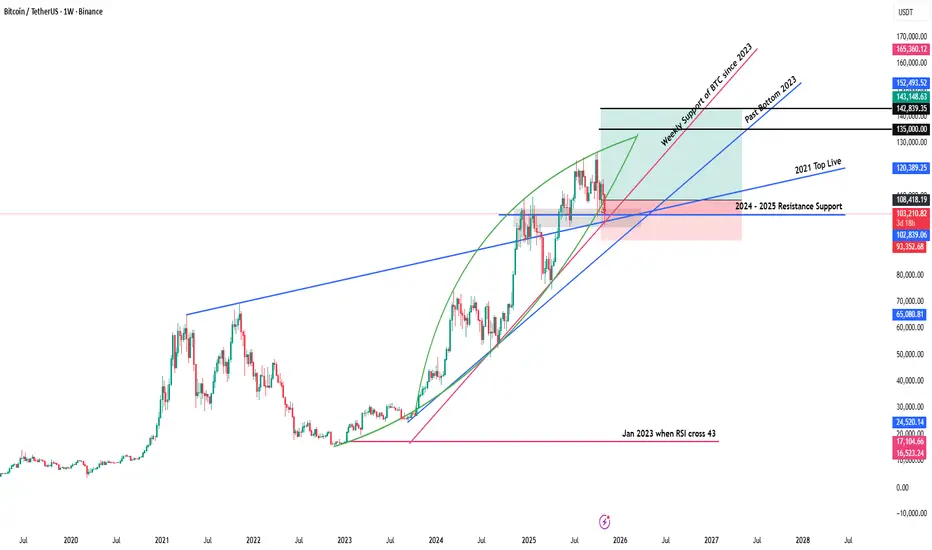
The weekly chart, as a core time frame for medium- to long-term trend analysis, filters out noise from daily and lower time frames, providing a clearer view of the main trend direction, key turning points, and the balance between bulls and bears. The BTC/USDT weekly chart analyzed here (from TradingView) covers price movements from 2023 to the present. It includes annotations such as “Weekly Support of BTC since 2023,” “Past Bottom 2023,” and “2024–2025 Resistance Support,” along with green and pink shaded areas that visually represent different stages of market psychological levels.
Currently, Bitcoin is priced at 103,384.25 USDT, with a weekly decline of -6.47% and a weekly volume of 118,000 USDT. From the chart structure, the price is near the 2024–2025 resistance-turned-support zone while being supported by the ascending trend line that has formed since 2023. The battle between bulls and bears is intense in this range, and price movements over the coming weeks will have a decisive impact on the medium- to long-term trend.
This report will combine key support and resistance levels, trend lines, volume, and technical indicators from the chart, compare historical patterns with the current market environment, conduct an in-depth analysis from multiple perspectives, and propose corresponding strategic recommendations and risk warnings.
Research Support and Evidence Analysis
This analysis is strictly based on the technical elements and relevant market data presented in the chart, with the following key supporting points:
• Current price and change: 103,384.25 USDT, weekly decline of -6.47%, indicating short-term bearish dominance, but the price has not yet broken key support.
• Weekly volume: 118,000 USDT, which has expanded compared to the recent average, suggesting increased market participation and greater divergence between bulls and bears.
• Key support levels:
– “Weekly Support of BTC since 2023” trend line: An ascending trend line connecting the weekly lows since 2023, currently around 100,000 USDT, providing important support.
– “Past Bottom 2023” zone: The 2023 Bitcoin low accumulation area, around 95,000–98,000 USDT, serving as the last line of defense for bulls.
• Key resistance levels:
– “2024–2025 Resistance Support” level: Previous high points where price repeatedly failed to break through, around 110,000–115,000 USDT, now acting as resistance.
– Pink resistance zone: Corresponds to historical accumulation areas and Fibonacci extension levels, around 118,000–122,000 USDT, serving as both a target for bulls and a point for bears to counterattack.
• Trend line analysis:
– Main ascending trend line: Extending upward from the 2023 low with a moderate slope, reflecting the medium- to long-term bullish trend.
– Secondary descending trend line: Connecting the late 2024 and early 2025 highs, forming a short-term descending channel; the price is currently approaching the upper boundary of this channel.
• Volume confirmation:
– When the 2023 support zone formed, volume gradually decreased, indicating easing selling pressure.
– When breaking through resistance in 2024, volume expanded significantly, confirming the validity of the breakout.
– During the current pullback, volume has expanded again, requiring vigilance against panic selling.
Data Comparison and Detailed Summary
To more intuitively present the relationship between key price levels and historical movements, the main support and resistance levels, trend lines, and volume characteristics are summarized as follows:
drive.google.com
From the table, it is clear that the support system formed in 2023 remains effective, while the resistance zone from late 2024 to early 2025 is pressuring the current price. Volume shows distinct patterns at different stages: decreasing at support zones, expanding on breakouts, and expanding again during pullbacks, reflecting cyclical changes in market sentiment.
Source Origin and Citation Interpretation
• Data authority: TradingView integrates real-time quotes from major global exchanges, ensuring the accuracy of price and volume data.
• Annotation professionalism: The trend lines, support and resistance zones on the chart are drawn by experienced analysts based on classic technical analysis methods such as historical highs and lows, accumulation areas, and Fibonacci retracements.
• Time frame representativeness: The weekly chart filters short-term fluctuations and is more suitable for medium- to long-term trend analysis, matching the decision cycles of institutional investors and long-term holders.
For labels such as “Weekly Support of BTC since 2023,” “Past Bottom 2023,” and “2024–2025 Resistance Support,” their origin is the chart drawer’s summary of historical key price levels. Although somewhat subjective, they align with the general definitions in technical analysis for “significant highs and lows” and “accumulation areas.” Therefore, interpretation should combine multiple verifications (such as volume and indicator confirmation) to reduce the risk of bias from single labels.
In-depth Insights and Independent Thinking
Combining the above data and chart features, deeper market insights can be gained from the following perspectives:
The medium- to long-term trend remains healthy
– The main ascending trend line has been extending upward from the 2023 low, and each pullback has not broken below it, indicating that the bullish structure is intact.
– The current price is approaching this trend line. If it can stabilize and rebound here, it will validate the effectiveness of the trend support and lay the foundation for the next upward wave.
The importance of the resistance-turned-support zone
– The 110,000–115,000 USDT zone repeatedly acted as resistance from late 2024 to early 2025. After being recently broken, it has turned into support.
– If the price can stabilize above this zone, it will further consolidate the bulls’ advantage and challenge the pink resistance zone (118,000–122,000 USDT).
Volume signals reveal market sentiment
– Volume decreased at the 2023 bottom, indicating exhausted selling pressure and paving the way for the subsequent rebound.
– Volume expanded during the resistance breakout, confirming increased market participation, while the current pullback’s expanded volume requires vigilance against panic selling.
– Future signs of stabilization with decreasing volume will present a better opportunity for bulls to enter.
Risks and opportunities coexist
– Short-term bears dominate, and the price is approaching the main ascending trend line. A breakdown below could trigger larger-scale stop-losses, targeting the 95,000–98,000 USDT zone.
– If the trend line support holds, combined with oversold signals from technical indicators, a wave of buying opportunities will emerge, with an initial target of 110,000–115,000 USDT.
Macro environment and market structure
– Global liquidity, regulatory policies, and institutional capital flows are exogenous variables affecting Bitcoin’s medium- to long-term trends.
– Although technical analysis can provide probabilistic judgments on price paths, it still needs to be combined with fundamental analysis and market sentiment to improve decision-making success rates.
Extended Discussion / Related Topics
In the current technical context, the following topics can be further explored:
• Multi-dimensional verification of technical indicators
– Relative Strength Index (RSI): Whether the weekly RSI is in overbought or oversold territory, and any divergence with price.
– Moving Averages (MA): The arrangement and divergence of the 50-week, 100-week, and 200-week MAs, and their confirmation of trend direction.
– MACD histogram and signal line: Weekly golden crosses and death crosses, as well as momentum changes in the histogram, indicating trend continuation or reversal.
• Fibonacci retracement and extension
– The role of Fibonacci retracement levels (38.2%, 50%, 61.8%) from the 2023–2024 main upward wave in the current pullback.
– If the price breaks above the pink resistance zone, the next targets can be referenced by Fibonacci extension levels (161.8%, 261.8%).
• Market sentiment and capital flows
– Can data such as futures open interest, funding rates, and exchange net inflows/outflows resonate with chart patterns?
– The impact of continuous buying by institutions like Grayscale and MicroStrategy, compared with the long-short ratio of retail leveraged funds, on medium- to long-term support and resistance.
• Risk management strategies
– Near key support and resistance levels, how to set stop-loss and take-profit to optimize risk-reward ratios.
– When volatility surges, should position size be adjusted, or derivatives like options be used for hedging?
• Future trend outlook
– If the price stabilizes above 110,000–115,000 USDT, the bullish target could extend to 130,000–150,000 USDT.
– If it breaks below the main ascending trend line and loses the 95,000 USDT support, a larger-scale correction may begin, with a downside target around 80,000 USDT.
Through in-depth exploration of the above topics, a more comprehensive investment decision framework can be constructed. On the basis of technical analysis, combining market structure and macro factors will improve the ability to predict price movements.
Using Leverage trading BitcoinUsing leverage is the fastest way to blow up your account, especially if you aren’t experienced in this game. We’ve seen hundreds of accounts being liquidated lately
@HyperliquidX
, but if you have discipline and good risk management, you can still profit.
*Not finance advice. DYOR