BTC has formed an inverted Head & Shoulders pattern 🚨 CRYPTOCAP:BTC Bullish Pattern Alert! 🚨
CRYPTOCAP:BTC has formed an inverted Head & Shoulders pattern 🔄
👉 If price breaks out above the neckline, it would confirm a bullish trend 📈
⚠️ Key point: Breakout confirmation above the neckline is crucial — watch for retests to avoid fakeouts.
👉 A confirmed breakout would signal strong bullish continuation with buyers in control ✅
BTCUST.P trade ideas

BTC: From $114K to $107.7K — Keeping Control"For beginners, the market often feels like chaos: price goes up or down, but what to do next is unclear. At the end of August, Bitcoin turned sharply downward, dropping from $114,000 to $107,700. Many froze in confusion.
An algorithmic approach removes this uncertainty. The entry was identified in advance, and the system guided the trade step by step — highlighting interim zones and profit-taking levels. The drop wasn’t a surprise, but part of the plan."

Drop from $114K to $107.7K — How the Algorithm Tracked the MoveOn August 24, Bitcoin entered a sharp decline. On the 1H timeframe, an entry area was highlighted near $114,000, and systematic trade management guided the move through four profit-taking levels. The final zone at $107,700 delivered nearly $6,300 of market distance.
The process unfolded without guesswork: the system marked key zones, suggested partial exits, and kept risk under control. For traders, this means trading without chaos or emotional interference.
Moves like this prove the power of structured trading. It’s not just about spotting direction, but about managing the position step by step. When an algorithm helps maintain discipline and organize the flow, trading shifts from emotional gambling into a clear, systematic process.
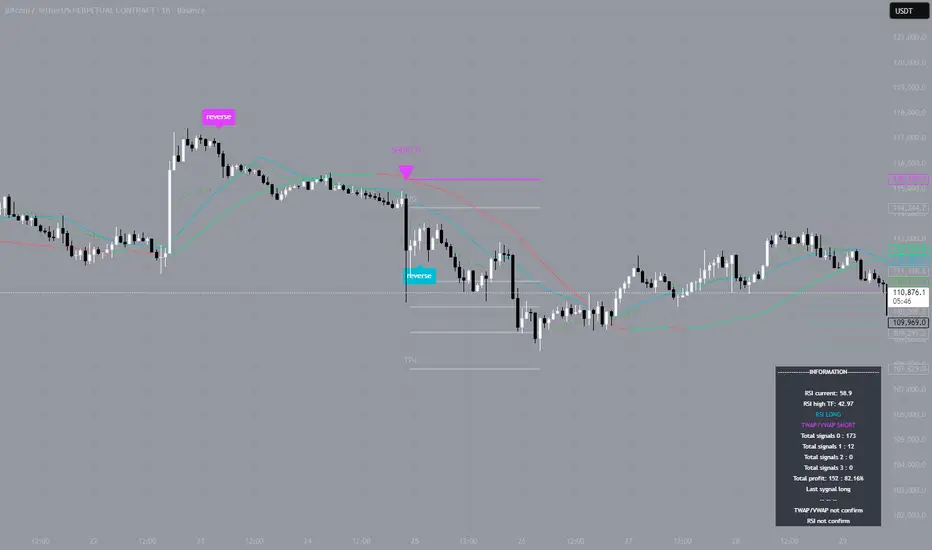
How to Use - Smart Buy/Sell Indicator — Real-Time & ReversalDescription
The chart above demonstrates how the Smart Buy/Sell Signal Indicator combines multiple conditions — Supertrend, RSI, ADX, Confirmation MA, and Bollinger Bands — to highlight potential trade opportunities in real time.
🔹 Core Signals
• Buy / Sell Triggers: Generated when trend, momentum, and volatility filters align.
• Reversal Clouds: Appear when RSI, ADX, and Bollinger extremes suggest potential exhaustion or traps.
🔹 Unique Aspect — Real-Time & Leading
Unlike many lagging tools, this indicator evaluates conditions during the live candle formation.
• If all rules align → signal appears immediately.
• If conditions fail before the candle closes → the signal disappears.
This design allows it to act as a leading signal generator, giving traders early heads-up rather than waiting for full candle confirmation. It emphasizes signal accuracy over repainting, by ensuring only valid conditions remain visible at close.
🔹 What Makes It Different
• Multi-factor confirmation (trend + momentum + volatility)
• Cooldown logic to avoid clustered signals
• Both continuation & reversal insights in one tool
• Adaptive to trending and sideways phases
📊 In the example above (BTCUSDT, 15m), you can see how signals align with both momentum-driven moves and intraday reversals.
⚠️ Note: This is an analytical tool, not financial advice. Performance varies across assets and timeframes. Always backtest and combine with risk management.
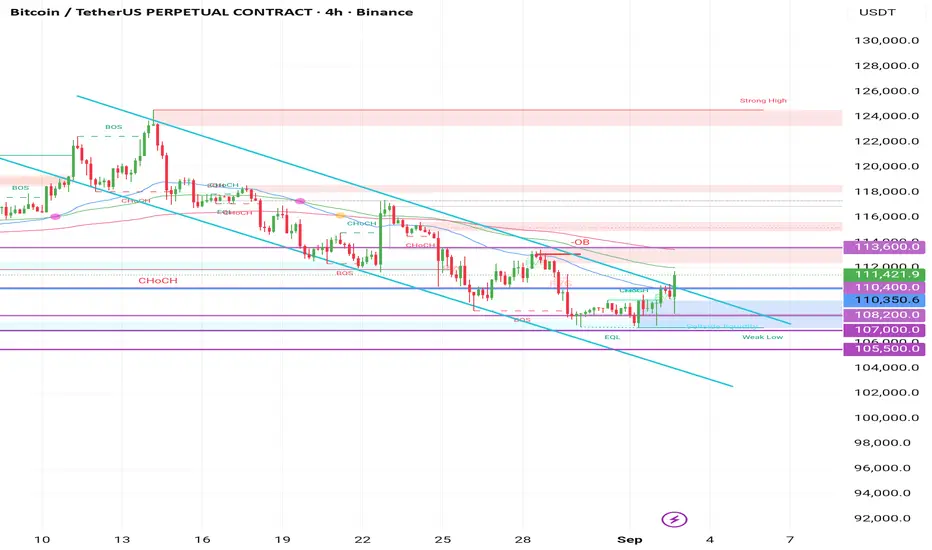
Bitcoin 4H Update – Testing the Channel ResistanceBitcoin bounced strongly from the 108,200 – 107,000 support zone and is now trading around 111,400, moving closer to the top of the descending channel.
🔑 Key Levels:
Support: 110,400 – 108,200 – 107,000 – 105,500
Resistance: 112,000 – 113,600
📉 Main Trend:
The overall structure is still bearish as long as price trades inside the descending channel.
🎯 Scenarios:
📈 A confirmed breakout above 112,000 – 113,600 would signal strength and open the way to 115,000 – 117,000.
📉 Rejection from this zone could send price back to 110,400 – 108,200.
✨ Update Note:
The market is at a decisive resistance area. Next move depends on whether Bitcoin can break the channel or gets rejected again.
Analysis BTC/USDT. Local Long Trend
Hello everyone! This is a trader-analyst from CryptoRobotics, bringing you the daily market review.
Yesterday, buyers dominated in Bitcoin, and by now the price has broken through the descending trendline. A sustainable long trend has not yet been established — the price retested the POC zone of the lower range. However, the buyer’s reaction was strong enough, which increases the probability of a move towards the selling zones.
It is important to note: even if the price rises further, this cannot yet be considered a completed reversal. From the resistance levels above, strong selling pressure may resume. If buyers fail to show sufficient strength, the market could update the current low.
Buy Zones:
$108,000–$102,500 (accumulated volumes)
Sell Zones:
$112,400–$113,300 (local volume zone)
$114,400–$115,500 (volume zone)
~$116,500 (volume anomaly)
$117,200–$119,000 (accumulated volumes)
$121,200–$122,200 (buying absorption)
This publication is not financial advice.

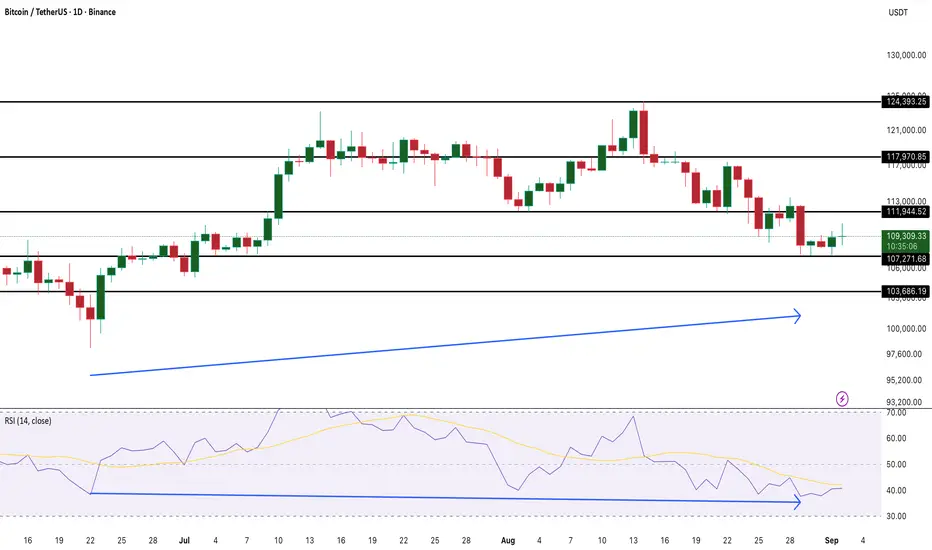
Bitcoin Price Recovery Could Quickly Accelerate; Here's HowThe BINANCE:BTCUSDT price was trading near $110,100 after gaining more than 2% in the past 24 hours. This erased the week’s losses and left the seven-day chart flat. Over the past three months, gains stayed capped below 5%, but year-on-year, the BINANCE:BTCUSDT price still shows strength with an 80% rise.
On the daily chart, BINANCE:BTCUSDT has formed a higher low while the Relative Strength Index (RSI), which tracks momentum, has made a lower low. This hidden bullish divergence often points to continuation of the trend. If buyers defend $107,200 and break resistance near $111,900, the BINANCE:BTCUSDT could move toward $117,900. A close below $107,200, however, would flip the picture bearish.
Derivatives data suggests optimism but with limited downside. The Taker Buy/Sell ratio has climbed to 1.10, showing more aggressive buying in futures markets. A cost-basis heatmap highlights strong resistance between $109,995 and $111,768, while support sits between $108,250 and $108,829. Unless heavy selling returns, this floor limits the risk of a deeper pullback.
Whale flows also ease pressure. The exchange-to-whale ratio dropped from 0.54 to 0.44 since August 29, meaning large holders are not sending coins to exchanges to sell. Prices moved from $108,332 to above $110,100 during that time, confirming whales are not offloading into strength.
BITCOIN BREAKOUTWe are on cery cricoual point. My thinking is that if bitcoin stay on the support level $109 and the next candles break the breakout point we go to upright movements.

#BTC/USDT Bullish Divergence on 1H, Low Risk Trade#BTC
The price is moving within a descending channel on the 1-hour frame, adhering well to it, and is poised to break it strongly upwards and retest it.
We have a bearish trend on the RSI indicator that is about to be broken and retested, supporting the upside.
There is a major support area in green at 108062, which represents a strong basis for the upside.
For inquiries, please leave a comment.
We are in a consolidation trend above the 100 Moving Average.
Entry price: 108450
First target: 108959
Second target: 109541
Third target: 110325
Don't forget a simple matter: capital management.
When you reach the first target, save some money and then change your stop-loss order to an entry order.
For inquiries, please leave a comment.
Thank you.

BTC: Signs of a New Bullish Wave Forming🔥 BTC Correction Weakening — Signs of a New Bullish Wave Forming
I see weakness in Bitcoin’s corrective structure, which could mean a new bullish wave is about to begin. Here’s why:
📌 Key Reasons:
Diminishing downside moves → pullbacks are getting smaller: first -8%, then -6%, and lastly -5%. This shows weakness in sellers.
Curved trendline broken → momentum shift on the chart.
Declining sell volume → less selling pressure as corrections unfold.
RSI breakout → a reversal trendline on RSI was broken, and confirmation comes with a move above 56.13.
⚡️ All of these together suggest that bears are losing strength and the bullish structure may resume soon.
💬 Do you think this is the start of a new impulse wave or just another fake-out?

BTC next movescurrently BINANCE:BTCUSDT seems to have found its bottom from the latest downwards move. within the past two weeks it established a little channel, currently it seems it even pops out of it above the channel for the first time since mid august. of course there can still be a further dump, but it's safe to say the bottom is imminent if not already in. also it's way bellow the current val of the past upmove so it's basically oversold territory.
I assume a first push above 112k again then further towards 117k. I still have my bitcoin trade open, added some to have an entry of a little above 109k and see how it goes. BINANCE:OPUSDT and BINANCE:ARBUSDT is still open as well. from 70cents and 48 cents respectively.
both once had a nice gain before but I guess I was to greedy to fully catch my tp, but well - the more you learn, the better you get.

BAD NEWS for Bitcoin :(. BE CAREFUL!My last Prediction was PERFECT . i know this will UPSET many bulls, but this is how the MARKETS WORK. After a strong uptrend and extreme greed environment, its time for Bitcoin to CORRECT and have strong PULLBACK. Look at the channel and trendlines, I expect bitcoin to reach a price of 100k/96k in the coming weeks. That will be a GOOD BUY opportunity. BE CAREFUL AND STAY WISE.
See My Previous PERFECT prediction:
BINANCE:BTCUSD COINBASE:BTCUSD CRYPTO:BTCUSD OKX:BTCUSD

BTC correction august/septemberBTC has reached overbought territory, there is also bearisch divergence. It also didnt go above 123k anymore. i expect a correction in august/september.
dont chase FOMO, be prepared. Nothing goes in a straight line. there are always corrections.
CRYPTO:BTCUSD BINANCE:BTCUSD CME:BTC1! BINANCE:BTCUSDU2025

Bitcoin 4H Update – Approaching the 110,400 ResistanceBitcoin bounced strongly from the 108,200 – 107,000 support zone and is now trading around 110,200 inside the descending channel.
🔹 Trend:
The overall bias is still bearish as long as price stays below 110,400 – 113,600.
This move looks like a short-term relief rally within the downtrend.
🔑 Key Levels:
Support: 108,200 – 107,000 – 105,500
Resistance: 110,400 – 112,300 – 113,600
🎯 Scenarios:
📈 If Bitcoin breaks and holds above 110,400, we may see continuation toward 112,300 – 113,600.
📉 Rejection at 110,400 could bring the price back to test 108,200 – 107,000.
✨ Recommendation:
The market is at a decisive level. Better to wait for a clear reaction at 110,400 before confirming direction.

BTC longterm predictioni see chart trying for last HH in 130-40K and after hit this point bear market started and atleast moving to 77K

BTC AI Prediction Dashboard - 6h Price Path (02.09.25) Prediction made using Crypticorn AI Prediction Dashboard
Link in bio
BTCUSDT Forecast:
Crypticorn AI Prediction Dashboard Projects 6h Price Path (Forward-Only)
Forecast timestamp: ~06:30 UTC
Timeframe: 15m
Prediction horizon: 6 hours
Model output:
Central estimate (blue line): -110,335
Represents the AI’s best estimate of BTC’s near-term price direction.
80% confidence band (light blue): 110,066 – 110,877
The light blue zone marks the 80% confidence range — the most likely area for price to close
40% confidence band (dark blue): 109,844 – 111,422
The dark blue zone shows the narrower 40% confidence range, where price is expected to stay with higher concentration
Volume on signal bar: 181.86
This chart shows a short-term Bitcoin price forecast using AI-generated confidence zones.
Candlesticks reflect actual BTC/USDT price action in 15-minute intervals.
This helps visualize expected volatility and potential price zones in the short term.

International Institutions & Market Stability1. Understanding Market Stability
Before diving into the role of institutions, let’s first clarify what “market stability” means.
Market Stability refers to the smooth functioning of financial systems, where prices of assets (stocks, bonds, currencies, commodities) reflect true economic fundamentals rather than being distorted by extreme volatility, panic, or speculation.
A stable market promotes investment, trade, job creation, and long-term growth.
On the other hand, instability—like currency crashes, hyperinflation, stock market collapses, or debt crises—leads to uncertainty, unemployment, and economic hardship.
Factors that threaten market stability:
Global Financial Crises (e.g., 2008 Lehman Brothers collapse).
Currency Fluctuations (e.g., Asian Financial Crisis of 1997).
Geopolitical Tensions (e.g., Russia-Ukraine war affecting energy markets).
Trade Wars and Tariffs (e.g., US-China trade war).
Pandemics and Natural Disasters (e.g., COVID-19 supply chain shocks).
Without strong international cooperation, these risks can quickly spiral out of control. That’s where institutions step in.
2. Why International Institutions Matter
Markets today are borderless:
Investors in Tokyo hold American bonds.
Indian companies raise money in London.
European banks finance African infrastructure.
Oil prices depend on OPEC+ decisions in the Middle East and Russia.
Because no country can control global markets alone, international institutions act as referees, firefighters, and architects:
Referees: They set rules for trade, finance, and investment.
Firefighters: They provide rescue packages during crises.
Architects: They build long-term frameworks for sustainable growth.
3. Key International Institutions and Their Roles in Market Stability
A. International Monetary Fund (IMF)
Founded: 1944 at Bretton Woods Conference.
Role: To ensure exchange rate stability, provide short-term financial assistance, and monitor global economies.
How it stabilizes markets:
Emergency Loans – Offers bailout packages to countries facing currency crises (e.g., Greece during the Eurozone crisis).
Surveillance – Publishes reports on global economic outlook and warns about risks.
Capacity Building – Provides technical advice on monetary policy, taxation, and banking reforms.
Case Example: During the 1997 Asian Financial Crisis, the IMF intervened with over $100 billion in rescue funds for South Korea, Indonesia, and Thailand.
B. World Bank Group
Founded: 1944, alongside the IMF.
Role: Provides long-term loans for infrastructure, poverty reduction, and sustainable development.
Impact on stability:
Helps developing countries build stable economies through investment in roads, energy, education, and healthcare.
Prevents political unrest and financial volatility by addressing root causes of instability—poverty and inequality.
Example: Post-war reconstruction of Europe and Japan, funded by World Bank loans, set the stage for decades of global growth.
C. Bank for International Settlements (BIS)
Founded: 1930, oldest financial institution.
Role: Acts as the “bank for central banks.”
How it stabilizes markets:
Facilitates cooperation among central banks like the US Federal Reserve, European Central Bank (ECB), Reserve Bank of India, etc.
Sets global banking rules like Basel Accords, which determine how much capital banks must hold to withstand crises.
Provides early warnings about systemic risks.
Example: After the 2008 crisis, BIS strengthened banking regulations to prevent excessive risk-taking.
D. World Trade Organization (WTO)
Founded: 1995, successor of GATT.
Role: Oversees global trade rules to ensure free and fair trade.
Contribution to stability:
Reduces trade disputes that could escalate into economic wars.
Provides a legal framework for resolving conflicts (e.g., US vs EU over aircraft subsidies).
Promotes predictable markets for exporters and importers.
Without WTO, trade disputes could spiral into chaotic tariff wars, destabilizing markets worldwide.
E. United Nations (UN)
Though not a financial institution, the UN ensures political stability, which indirectly supports markets.
Its agencies—UNDP, UNCTAD, UNEP—work on sustainable development, investment flows, and environmental issues.
Peacekeeping operations help restore stability in war-torn regions, creating safer conditions for markets.
F. Regional Institutions
European Central Bank (ECB) – Maintains eurozone stability.
Asian Development Bank (ADB) – Funds Asian infrastructure.
African Development Bank (AfDB) – Strengthens African markets.
BRICS Bank (NDB) – Alternative funding for emerging economies.
These regional players complement global institutions by addressing local challenges.
4. Tools Used by International Institutions for Market Stability
Financial Assistance – Bailouts, emergency funds, and structural adjustment loans.
Regulatory Frameworks – Basel Accords (banking), WTO trade rules.
Surveillance and Monitoring – IMF’s World Economic Outlook, BIS reports.
Capacity Building – Training governments in fiscal and monetary policy.
Dispute Resolution – WTO’s legal panels.
Crisis Coordination – G20 and IMF coordinate during global shocks.
5. Case Studies: Institutions in Action
1. The 2008 Global Financial Crisis
IMF, BIS, and G20 coordinated liquidity injections.
Central banks cut interest rates in unison.
WTO helped prevent protectionist trade measures.
2. COVID-19 Pandemic
IMF approved emergency loans to over 85 countries.
World Bank mobilized billions for vaccine distribution.
WTO worked to ensure supply chain flow of essential goods.
3. Eurozone Debt Crisis
ECB played a key role by buying government bonds.
IMF provided bailout packages to Greece, Portugal, and Ireland.
These examples show how international cooperation prevents local crises from turning into global meltdowns.
6. Challenges Faced by International Institutions
Political Influence – Rich countries dominate decision-making (e.g., US influence in IMF).
Sovereignty Concerns – Countries resist outside intervention in domestic policies.
Inequality of Benefits – Critics argue that IMF and World Bank impose harsh austerity measures that hurt the poor.
Global Power Shifts – Rise of China, BRICS challenges Western-dominated institutions.
Technology and Crypto – Digital currencies and decentralized finance are outside current frameworks.
7. The Future of International Institutions in Market Stability
To remain effective, institutions must adapt:
Greater Inclusiveness: Give emerging markets more voting power.
Focus on Sustainability: Climate finance and green bonds should be prioritized.
Digital Regulation: Create rules for cryptocurrencies and AI-driven trading.
Crisis Preparedness: Build faster response mechanisms for pandemics, cyberattacks, and climate shocks.
Multipolar World: Balance power between the US, EU, China, India, and other rising economies.
Conclusion
International institutions are the backbone of market stability in an increasingly interdependent world. While they face criticism for being slow, biased, or outdated, their importance cannot be denied. From the IMF’s financial lifelines to the WTO’s trade rules, from BIS banking regulations to World Bank’s infrastructure funding, these organizations ensure that crises do not escalate into global catastrophes.
As globalization deepens and new risks emerge—climate change, cyber threats, digital currencies—the role of international institutions will become even more vital. The challenge lies in reforming them to be more inclusive, transparent, and forward-looking. Only then can they continue to safeguard global markets and promote sustainable prosperity.

$BTC Continuation CRYPTOCAP:BTC
Check out how every other bullish pattern on this 1 day time frame broke up
Why should this triangle be any different?

BTC Short Signal Based on MS strategy. Marlik investments 09/25MS strategy gave Short Signal for BTC. My entry is $110,000 and my stop is $127000. The main Target is $61000.

DXY, EUR/USD, GBP/USD, BTC MONTHLY OUTLOOK-Forex Market ForecastThe market lookout for DXY to be a bullish day tomorrow, EURUSD should be a bearish candle, GBPUSD will trade and take PDH and seek for lower price while BTC should remain in the called out range

BTCUSDT (30M) – Recovery Mode ActiveBINANCE:BTCUSDT
Structure | Trend | Key Reaction Zones
BTC grabbed liquidity below 107,500 and sharply bounced back, showing strong buyer defense. Price is now retesting the 108,400 zone, with immediate resistance at 109,400 and trendline resistance overhead.
Market Overview
After a stop-hunt liquidity grab near 107,250, BTC quickly recovered, signaling bullish momentum from demand. Buyers are attempting to re-establish structure within the consolidation channel. The reaction from 108,400 will be key — a strong push may fuel continuation, while failure risks another dip.
Key Scenarios
✅ Bullish Case 🚀 →
🎯 Target 1: 108,400
🎯 Target 2: 109,400
🎯 Target 3: 109,830
❌ Bearish Case 📉 →
🎯 Downside Target 1: 108,170
🎯 Downside Target 2: 107,450
Current Levels to Watch
Resistance 🔴: 109,400 – 109,830
Support 🟢: 108,170 – 107,450
⚠️ Disclaimer: This analysis is for educational purposes only. Not financial advice.

BTCUSDT (30m) – Possible Bullish Continuation | INTRADY OR SCALPBINANCE:BTCUSDT
Structure | Trend | Key Reaction Zones
BTC is consolidating inside an accumulation phase after liquidity sweeps. Price has bounced strongly from the demand zone and is now testing trendline resistance.
Market Overview
BTC structure shows a mix of accumulation and false breakouts, with liquidity grabs on both sides. As long as the strong demand base holds, buyers may attempt to break trendline resistance for continuation. Momentum will shift decisively if BTC clears the immediate resistance zone, otherwise rejection can push it back toward the lower support.
Key Scenarios
✅ Bullish Case 🚀 → Bounce from demand with breakout above 109,400 could lead to:
🎯 Target 1: 109,834
🎯 Target 2: 110,867
🎯 Target 3: 111,500 (major breakout level)
❌ Bearish Case 📉 → Failure to hold 108,400 may trigger deeper downside:
🎯 Target 1: 108,174
🎯 Target 2: 107,452
🎯 Target 3: 107,250 (critical demand test)
Current Levels to Watch
Resistance 🔴: 109,400 → 109,834 → 110,867
Support 🟢: 108,400 → 108,174 → 107,452
⚠️ Disclaimer: This analysis is for educational purposes only. Not financial advice.

