BTC/USDT Analysis. Sell-Side Absorption in Play
Hello everyone! CryptoRobotics trader-analyst here, and this is your daily market update.
Yesterday Bitcoin followed our long scenario — the move started earlier than expected, without a liquidity grab, as market buyers stepped in aggressively. As of now, price has reached the first resistance at $90,000–$92,300 (volume zone).
In this area, delta has spiked sharply, indicating “high-level buying,” which has already triggered a local correction.
The key pivot level now is $90,000 — it may work as support, but if price settles below it, the level becomes resistance.
If price breaks the local high → expect a test of the upper selling zone and a deeper correction afterwards.
If price breaks and holds below $90,000 → the downside target becomes the anomaly zone at $84,000–$82,000.
Buy Zones
$88,000–$86,000 (local volume zone)
$84,000–$82,000 (volume anomalies)
Sell Zones
$90,000–$92,300 (volume zone)
$94,000–$97,500 (volume zone)
$101,000–$104,000 (accumulated volumes)
$105,800–$106,600 (local resistance)
This publication is not financial advice.
Trade ideas


BTC Playbook: 93k Pivot vs 98k Path__________________________________________________________________________________
Market Overview
__________________________________________________________________________________
Price is pressing into a well-defined 92,800–93,500 resistance band while macro leadership stays risk-off, making this a decision area. Momentum is rebuilding off 89k supports, but higher timeframes lean cautious until acceptance above 93,150.
Momentum: Bearish-to-neutral with a tactical counter-trend bounce; sustained strength needs a clean break-and-hold above 93,150.
Key levels:
- Resistances (HTF): 92,800–93,500 (240 Pivot High zone), 98,115 (W Pivot Low), 107,474 (D Pivot High)
- Supports (HTF/ITF): 90,500–90,800 (recent base), 89,012 (240 Pivot Low), 86,261 (240 Pivot Low)
Volumes: Moderate on 1D/12H; normal on intraday (6H/4H/2H/1H).
Multi-timeframe signals: 1D Up vs 12H/6H/4H/2H Down; intraday 1H Up but into HTF resistance. Defer to 12H Down unless 93,150 is accepted with persistence.
Harvest zones: 80,200 (Cluster A) / 76,600–77,100 (Cluster B) — ideal deep dip-buying areas for inverse pyramiding if market overreacts.
Risk On / Risk Off Indicator context: Neutral sell — confirms the cautious stance under resistance and argues for patience on longs.
__________________________________________________________________________________
Trading Playbook
__________________________________________________________________________________
The dominant read is neutral-sell into HTF resistance; adopt a reactive approach: fade failed breakouts, flip to long only on confirmed acceptance.
Global bias: Neutral-sell while below 93,150; bias flips constructive on ≥2H/4H acceptance above 93,150. Invalidation of the fade: sustained hold above 93,150.
Opportunities:
- Tactical sell: Fade 92,800–93,500 if 2H/4H prints rejection and volume fades; add on loss of 91,000 toward 89,012.
- Breakout buy: Engage on ≥2H/4H close above 93,150 with successful retest; first target 98,115.
- Reactive buy: Probe 89,012 only on strong reversal signal (≥2H) with improving volumes.
Risk zones / invalidations:
- Break below 89,012 would invalidate reactive longs and opens 86,261 risk.
- Sustained hold above 93,150 would invalidate shorts from the 92,800–93,500 fade zone.
Macro catalysts (Twitter, Perplexity, news):
- Liquidity tailwind: PBOC injections + equities <2% from ATH, but thin holiday liquidity can distort moves.
- ETFs: 7-day BTC spot ETF flows negative despite a small daily inflow — headwind near resistance.
- Rates: Elevated Fed cut odds support dips, but headline risks (stablecoins/geopolitics) can spark risk-off spikes.
Harvest Plan (Inverse Pyramid):
- Palier 1 (12.5%): 80,200 (Cluster A) + reversal ≥2H → entry
- Palier 2 (+12.5%): 75,400–77,000 (-6%/-4% below Palier 1) (Cluster B included) → reinforcement
- TP: 50% at +12–18% from PMP → recycle cash
- Runner: hold if break & hold first R HTF (93,150)
- Invalidation: < HTF Pivot Low (not provided) or 96h no momentum
- Hedge (1x): Short first R HTF (93,150) on rejection + bearish trend → neutralize below R
__________________________________________________________________________________
Multi-Timeframe Insights
__________________________________________________________________________________
Higher timeframes are mixed with 1D Up versus 12H Down; execution should respect the 12H filter until 93,150 is reclaimed with persistence.
12H/6H/4H/2H: Downtrend bias pressing into 92,800–93,500 supply; rejection here favors a rotation to 91,000 then 89,012. Acceptance and hold above 93,150 unlocks 98,115.
1D/1H: 1D Up but capped by 93,150; 1H Up is counter-trend into HTF resistance, so expect chop under 93k unless volume expands on breakout.
Confluences/divergences: Persistent HTF resistance at 93,150 aligns with risk-off macro; 1D strength is an exception that requires flow/volume confirmation to extend.
__________________________________________________________________________________
Macro & On-Chain Drivers
__________________________________________________________________________________
Macro is cautiously constructive on liquidity, but BTC-specific flows are not yet a tailwind, keeping technical resistance meaningful.
Macro events: PBOC liquidity injections aid risk; S&P 500 near ATH with thin US holiday liquidity; elevated cut odds into December create a soft landing narrative but headline risk persists.
Bitcoin analysis: BTC reclaimed 90k with negative/neutral funding; overhead supply 91.9–93k; ETF 7-day flows negative, dampening confidence at resistance.
On-chain data: Liquidity pockets discussed around low 80ks; heavy puts near mid-80ks; recovery impulses need stronger demand inflow and key cost-basis reclaims.
Expected impact: If ETF flows stabilize and price accepts above 93,150, path opens toward 98,115; otherwise the 92,800–93,500 zone favors tactical fades.
__________________________________________________________________________________
Key Takeaways
__________________________________________________________________________________
BTC is testing a critical resistance while macro risk-on is tentative and flow support is uneven.
- Trend: Neutral-to-bearish below 93,150; constructive only on confirmed acceptance above.
- Setup: Fade 92,800–93,500 rejections; switch long on ≥2H/4H hold above 93,150 targeting 98,115.
- Macro: ETF 7-day flows remain negative, capping conviction at resistance despite broader liquidity support.
Stay patient at the boss gate; wait for a clean unlock above 93,150 or harvest the rejection.

BTCUSDT Short Scalp Setup, 15 Minute Chart BTC is showing clear weakness after another rejection at $91,900–$92,000.
Combined with strong bearish divergences, this creates a clean short scalp opportunity on the 15-minute timeframe.
📉 1. Bearish Divergences (15M)
Price forms a higher high,
Momentum forms a lower high → classic bearish divergence.
RSI confirms the bearish pressure.
🔴 2. Strong Rejection Zone
The zone at $91,800–$92,000 gets rejected again.
Sellers dominate, buyers show exhaustion.
🎯 3. Short Setup (15M)
Entry: $91,800 – $92,000
Stop-Loss: Above the recent high
Targets:
TP1: $90,440
TP2: $89,600
TP3: $88,900
TP4: $88,000
As long as BTC stays below resistance, the bearish scalp remains valid.
🧩 4. Summary
✔ Bearish divergence
✔ Clear rejection
✔ Weak momentum
✔ Valid short scalp setup
Perfect for a 15M public TradingView idea.
⚠️ Disclaimer
This is not financial advice — just a personal market idea.
Always use your own stop-loss and proper risk management.

93195 and 94000 both touch before 86900Based on the chart structure, the price will definitely touch the two mentioned points in the last 24 hours before falling below 86,900. It should be noted that the current trend will be bullish due to the lack of heavy resistance against Bitcoin, and if the price reaches 95,800, there will be no downward trend for at least 6 weeks.

BTC: Wait for 120KI've repeatedly suggested buying BTC consistently below 90K, and the market has validated my view once again. Our current positions are profitable – keep holding and wait for the high to hit.
Today's BTC Trading Strategy:
BTCUSDT buy@88000-90000
TP:93000-95000
I'll send out accurate signals right at the opening every day, don't miss out.

Is This the Beginning of a New Bull Cycle?Ladies and gentlemen, Bitcoin’s conditions have completely flipped, and if you don’t adapt to the new reality fast, you’re about to leave a lot of profit on the table.
In this analysis, we’re going to look at Bitcoin with zero bias, pure objectivity, and open positions together.
I’m Skeptic, founder of Skeptic Lab . If you want to take your long-term performance to the next level using real psychology, data, and strategy, you’re in the right place.
Let’s start with the daily timeframe 📉
it looks like the pullback is completing. Yesterday’s candle closed extremely bullish, and the odds of the next two daily candles also closing bullish are honestly pretty much. btw Anything upward from here on the daily is just lower highs and a pullback toward 100k. YES, the HWC (weekly) is still in an uptrend, but the daily IS NOT. That doesn’t mean we sit on our hands—we still take longs, but only in lower timeframes and with a completely different risk-management approach (explained below).
🔍 Drop to the 1H for the real triggers.
Yesterday our long trigger fired exactly as planned and gave us a clean +4.35% move (if you missed it, go check yesterday’s analysis). We’ve now reached 91,497.25 and the upper boundary of the 4H ascending channel. From here, two main scenarios: 📍
1. Break of support at 90,892.60 → continuation down to the channel midline, then retest of 88,118.70 support.
2. Break of resistance at 91,497.25 → entry into fresh bullish momentum that can carry us all the way to the next major resistance at 96,066.89 .
Key observation: LWC momentum is strongly bullish. Volume has spiked on the rise and dropped sharply on pullbacks and during consolidation, so the probability of breaking the top is higher right now.
Risk-management difference (this is critical):
- Longs are counter-trend to the daily MWC → we take profit faster and use tighter stops so we can reach target quickly before a single daily candle potentially wipes the whole move.
- Shorts would be with the MWC → we can afford wider risk and scale out with partials.
Volume is our final confirmation here: if we had rising price but decreasing volume on the push to the top → cancel orders. Same rule applies to shorts.
Yesterday, when price rose toward 88,118.70, volume exploded—that was our confirmation, and we entered long.
If this analysis helped you, I’d really appreciate a boost. It keeps the energy coming. 🩵
Now get outta here.

BTCUSD — Bullish Above 82,725 With Long-Term Target at 141,300BTC remains bullish as long as price holds above the key support at 82,725. This zone is the base of the current structure, and maintaining it keeps the long-term target at 141,300 in play. In a bearish scenario, price cannot break above the key support zone; any move toward it while trading below is only a corrective bounce. Holding above 82,725 supports continuation toward 93,723, 103,830, and ultimately 141,300,

BTC/USDT Technical Analysis, 2025-11-25 12:00 UTC🎯 BTC/USDT Technical Analysis, 2025-11-25 12:00 UTC
📊 Market Context
Type: Technical outlook
Potential Entry Zone: 87,300 – 87,450
Potential Upside Level: 91,300
Defined Invalidation Level: 85,600
Approx. R/R Concept: ~1:2.25
📈 Technical Analysis Overview
🔹 Fibonacci Structure
Price interacting with the 0.382–0.500 retracement zone
Historically acted as a reaction area
Current structure suggests prior buyer interest
🔹 Order Flow & Liquidity Context
Higher bid activity relative to recent sessions
Liquidity concentration forming under 87,400
Order book imbalance suggests buyers currently more active
🔹 Momentum Indicators
RSI rebounding in 35–45 zone
Stochastic showing bullish cross in lower band
MACD histogram trending upward toward zero line
Volume profile showing active participation around current range
📊 Volume & Trend Context
OBV trending upward over recent candles
Volume spikes near local support
Overall volume structure supportive of continuation if follow-through occurs
🎯 Key Market Levels
Immediate Support: 86,800
Major Support / Invalidation: 85,600
Zone of Interest 1: 89,200
Zone of Interest 2: 91,300
Extended Area (if momentum holds): 93,500
⚡ Structural Notes
Market forming tight consolidation after prior downside
Sellers showing reduced follow-through at support
Multi-timeframe momentum gradually aligning to upside
📘 Trade Planning Concepts (Analysis Only)
Confirmation above 87,400 may indicate stronger buyer intent
Scaling entries can be considered in volatile environments
Break-even adjustment often considered after 89,200
Partial profit-taking at predefined levels can help manage volatility
⚠️ Risk Framework
Maintain position sizing according to personal rules
Predefine invalidation at 85,600
Monitor volume for continuation; low volume may invalidate the structure
Avoid late entries after breakout without pullback
📱 Checklist
Fibonacci zone interaction
Increasing buyer participation
Strengthening momentum indicators
Volume supportive of upward attempts
Favorable risk/reward structure
🧭 Timeframe & Method
Approach: Short-term & Scalping technical analysis

QUICK ANALYSIS (1H) — BTC BOUNCED FROM RESISTANCE✅ 1. Breakout from the downward trendline
On the chart, I see:
a yellow downward trendline—it has been broken,
the candlestick dynamically breaks through it and closes above it.
➡️ This is the first signal of a shift in momentum to upward.
✅ 2. Price is testing the 200 SMA (blue)
BTC is currently:
touching the 200 SMA,
bounces slightly downward—a classic reaction to strong resistance.
➡️ Until we break through the 200 SMA, the market remains in a downtrend.
🟩 3. Nearest resistance levels (green levels on your chart):
90,400 USDT – current resistance (reaction already visible)
92,500 USDT – next important level
93,200–94,000 USDT – strong supply zone
94,900 USDT – strong level from previous bounces
➡️ The closer the price gets to 94–95k, the greater the chance of a downward rebound.
🟥 4. Nearest support levels
From your red levels:
88,700 USDT – first level of defense
87,500 USDT – key support
85,500 USDT – major local bottom
84,150 USDT – extreme support
➡️ If BTC returns below 87.5k, the correction will deepen.
📊 5. RSI — Neutral-Bullet
RSI ~ 55,
Not yet overbought,
RSI trend is increasing.
➡️ There is room for further upward movement.
📉 6. MACD — Bullish Signal
MACD has crossed the signal line upward,
the histogram is rising.
➡️ Upward momentum, shorting here is risky.

Difficult and imperfect swing trade setup on BTCUSD dailyCOINBASE:BTCUSD has broken below its rising channel and is now exhibiting a downward trajectory. This shift creates a potential swing-trading opportunity arising from two distinct scenarios:
A reversal of the current downward trend, leading to a renewed bullish movement, or
A temporary pullback within the continuation of a broader bearish trend.
On the weekly timeframe, the first major traditional moving average above the current price is the 50-week moving average, positioned at approximately 100,000 USD. The daily chart reflects a similar structure: the nearest significant moving average above is again the 50-day moving average, also situated near 100,000 USD. This alignment establishes a notable—albeit high-risk—swing-trade setup. Should the price initiate even a micro bullish trend within a larger bearish context, the most probable target for such a move would be a reversion toward the 50 DMA at around 100,000 USD.
Supporting this thesis, several momentum indicators—specifically the RSI, Rate of Change (ROC), and MACD—are beginning to turn upward from recent troughs. This emerging positive momentum suggests that underlying buying strength may be forming, which would be consistent with the early stages of a bullish swing within a broader bearish structure.
A potential entry trigger on the daily chart would occur once price breaks above and remains above the 10 DMA for a sustained period (e.g., a 1- to 3-day confirmation filter, depending on risk tolerance). Historically, such moves have provided reliable signals on at least four consecutive prior occasions as depicted in the chart.
However, caution is warranted: daily closes above the 10 DMA are common, and many such moves fail to persist. This is why a multi-day filter is proposed—to increase the probability that the breakout represents a genuine shift rather than short-lived noise.
Proposed Trade Parameters
Entry: Break and sustained hold above the 10 DMA (estimated near 90,000 USD).
Take Profit (TP): Reversion to the 50 DMA (approximately 100,000 USD).
Stop Loss (SL): A daily close back below the 10 DMA (likely around 95,000 USD).
Risk–Reward Ratio: ~1:2.
Important Caveats: This setup is inherently imperfect, as both the entry and stop-loss levels are determined by moving averages and the trade itself yields a relatively modest risk–reward profile. Moreover, the rationale for a bullish retracement is based solely on technical patterns—specifically, the observation that counter-trend rallies frequently occur even within pronounced bearish phases. There is, at this point, no anticipated fundamental catalyst or macro-level justification supporting an imminent bullish move; the thesis is grounded entirely in probabilistic technical behaviour.

The end of crypto being an alt investment?If ever there was evidence that crypto has become normalized and absorbed into mainstream institutional behaviour—moving more like a unified asset class and less like a collection of wild outliers—this is it.
Across four randomly selected coins with very different purposes and market caps ( COINBASE:BTCUSD - top left, COINBASE:XRPUSD - top right, COINBASE:SOLUSD - bottom left and BINANCE:TRXUSD - bottom right):
2 out of 4 ranged 35–40% in an almost identical pattern over the same period
3 out of 4 ranged 35–48% in an almost identical pattern over the same period
4 out of 4 ranged 20–48% in an almost identical pattern over the same period
These similarities raise the question: are we now past the era of:
Huge, isolated crypto swings?
Crypto consistently moving counter to the S&P, FTSE and other indices?
Crypto acting as a true alternative asset class?
Not quite.
Yes, institutional capital is now clearly in the market, but how crypto behaves still depends heavily on how those institutions manage their allocations.
Crypto remains capable of sharp, counter-intuitive moves—but with less of the explosive upside (or catastrophic downside) that defined the early years. Crypto volatility is likely to be lower than before—but still far above that of major indices or mega-cap equities (the “Apple/Google/Amazon equivalents” of traditional markets). And crucially, crypto can still move counter to the stock market, as shown in the second image where BTC (and most major coins) fell while equities rallied.
This also leads us to the following - the three investor archetypes now dominating crypto:
The Whales – Formerly wealthy early adopters, but now overwhelmingly institutional players. Their capital, risk management structure and access to liquidity eclipse everyone beneath them.
The Sharks – Yesterday’s whales. Powerful enough to cause volatility and trigger widespread stop-loss cascades, but no longer able to dictate the market the way they once could.
The Nemos – Retail investors, small and scattered, swimming in the wake of the larger fishes while trying (often desperately) to “find Dory*.”
At the same time, crypto has shown increasing correlation with stock market trends—particularly between April and October—further evidence of institutional influence and a sign that crypto is becoming mainstream, integrated, and less viable as a true alternative asset class capable of life-changing returns (or losses).
Notes:
* Dory: Alpha – mythical, elusive, and mostly found in pixel form (cinemas, and charts on social media trading apps :-) ).

BTC TECHNICAL ANALYSIS — GLOBAL CYCLE, FIBONACCI, MACD & SCENARI1. Global Overview
Bitcoin has completed one of the strongest multi-year bullish cycles, starting from $16,000, followed by a sequence of major impulses and deep pullbacks:
- Rally 16k → 73k
- Correction 73k → 49k
- Rally 49k → 108k
- Correction 108k → 74k
- Final impulse 74k → 126k
The move to 126k represents the final phase of the bullish cycle before a potential macro reversal.
2. Bearish Monthly MACD Signal
On the 1-month timeframe, a clear bearish MACD cross appeared in early October — historically this signal always led to a strong mid-term bear market.
Important:
The MACD signal formed before the final push to 126k,
Price made a minor higher high 123k → 126k,
then started dropping sharply.
This matches previous cycle reversals.
3. Current Position: 0.786 Fibonacci Zone
Using Fibonacci retracement of the last impulse (74k → 126k), the key deep correction level is:
📍 83,415$ — 0.786 Fib
Current price action:
Price broke below the level on the daily,
Then reclaimed it, suggesting a potential short-term bounce.
4. Outlook for December
December likely begins with:
- a small dip / retest into 83k,
- followed by a corrective upward move.
Target for the recovery:
🎯 114,000 – 115,000$
This is the optimal zone where the correction may finish.
5. Main Outlook for 2026
Because the monthly MACD signal is strongly bearish, and historically has always marked the start of a macro downtrend:
Expectations:
After the bounce, BTC will reverse downward again,
Breaking the previous lows.
Long-term targets:
🔥 53,000 – 45,000$
This is the likely completion zone of the upcoming bear cycle.
SUMMARY
- BTC is in a deep retracement zone,
- A bounce toward 114–115k is likely,
But long-term structure suggests continuation of the bear market.
BTC/USDT Analysis. Local Long Setup
Hello everyone! CryptoRobotics trader-analyst here, and this is your daily market update.
Since yesterday, Bitcoin has failed to break above the $88,000 level mentioned in the previous analysis, resulting in continued consolidation within a narrow range.
When analyzing this local range, we see dominant selling pressure on cumulative delta, but it has not produced any meaningful downside result — sellers are active, yet unable to push the price lower. Additionally, a notable delta anomaly has formed around $86,000, suggesting the presence of a limit buyer.
A local long setup becomes valid if liquidity is swept below the local lows followed by a test of $86,000, with a stop-loss below $85,200. The upside potential is attractive — the next resistance zone we highlighted earlier becomes the primary target.
If no reaction appears at $86,000 and buyers fail to step in, we expect further downside movement toward a stronger support zone below.
Buying Zones:
• $86,000 (local selling absorption)
• $84,000–$82,000 (volume anomalies)
Selling Zones:
• $90,000–$92,300 (high-volume zone)
• $94,000–$97,500 (high-volume zone)
• $101,000–$104,000 (accumulated volume)
• $105,800–$106,600 (local resistance)
This publication is not financial advice.
BTC UpdateUpdate on my BTC analysis from June where I forecasted a price reversal in bitcoin as it was reaching the peak of this channel.
As expected a sharp decline in the price of BITSTAMP:BTCUSD has occurred and is reaching a key level as outlined on the chart.
Large institutional buying has taken place over the last 2 months with the majority of Bitcoin buyers being long term holders. Volatility within the markets is the focus and position sizing needs to be adjusted to meet this.

BTCUSDT - Signal#BTCUSDT - Signal
H4 - Formation of the 3rd wave + trendline breakout. Stop loss beyond the high of the 1st wave.
Entry: 86129.47
TP: 83947.38 - 81145.35 - 78858.86 - 75356.76
Stop: 89430.81

BTC: About to Surge SoonBTC's bottoming-out signal has appeared—right now we just need to be patient and trade time for space. We can keep trying to buy below 900K, hold firmly, and wait for the subsequent rally to push it back above 120,000.
Today's BTC Trading Strategy:
BTCUSDT buy@86000-87000
TP:90000-92000
I send out accurate signals and strategies the moment they’re available every day—don’t miss out on profit opportunities!

SELL NOW BTCUSD!!BTCUSDT completed +2,000pips from my sell limit order on recent post on btc today we have trend continuation zone looking at price to made a sharp rejections off this poi to 80k......

Bitcoin – Approaching Key Resistance at 90,000Since the recent drop, Bitcoin has been forming higher highs (HH) and higher lows (HL), showing a solid 8–10% recovery. This structure suggests buyers are regaining control, but now price is approaching a major test.
The next key level is the 90,000 resistance zone:
Bullish Scenario:
If BTC breaks above 90,000, momentum could accelerate as more traders add longs. This would open the door for a clean move back toward the 95,000 level.
Bearish Scenario:
If price fails to break 90,000, a rejection would likely send BTC back to the 85,000 support zone.
If 85,000 does not hold, the next liquidity levels lie at 83,000–81,000.
Overall, Bitcoin is recovering well, but the 90,000 level will determine whether the rally continues or a deeper correction begins.
BINANCE:BTCUSDT

BTC Bullish with Compression RiskBTC/USD – Intraday Institutional Analysis (Athena Protocol v7.3)
Exchange: Binance
Current Price: ~87,602
Current Time: 01:42 UTC-5
Timeframe Provided: 90m
1. Market Bias: Mild Bullish (with compression risk)
Basis for Bias
Goldbach Levels
– Price is hovering above the 6561 PO3 midline cluster.
– Algo-1 and Algo-2 at the nearest PO3 levels show BR → FV and OB → RB, suggesting bullish rotation but not explosive.
– The 27 & 81 PO3 rows in particular show bullish recovery patterns (-RB, FV, -OB).
Volume Profile
– Visible Range POC at ~86.9K has acted as a magnet but is now acting as soft support.
– Large high-volume node at 87.3K–87.6K indicates acceptance.
– Low volume inefficiency above 88.1K → potential bullish magnet if reclaimed.
Session Volume Profile
– Multiple sessions printing higher value area lows.
– Current sessions building value slightly higher, showing slow accumulation.
CVD
– CVD is rising subtly while price is flat → hidden absorption from buyers.
– No aggressive delta imbalance but enough to indicate demand.
COT Data
Week-on-week:
– Longs +364, Shorts –292 → net +452 (bullish shift).
– Shorts remain dominant, but decreasing for two weeks straight.
– This implies shorts are covering, enabling upside expansions.
Macro Catalyst Snapshot
– FOMC members remain cautious but no new aggressively hawkish pressures.
– Trump’s recent energy-dominant policy talk lifted risk appetite.
– Crypto sentiment neutral-positive after ETF inflows resumed.
________________________________________
2. Strategic Interpretation
BTC is in a compression box between 87.0K and 88.3K.
This is classic ICT accumulation before a displacement move.
– CVD supports bullish continuation.
– COT supports longer-term bullish shift.
– Volume profile shows inefficiencies ABOVE.
– Goldbach models show bullish rotation signals.
Bias: BUY only.
(Shorting here is asking to get executed like a liquidity piñata.)
________________________________________
3. Smart Money Trade Levels
A. Aggressive Buy Limit
Entry: 87,180 – 87,260
SL: 86,720
TP1: 87,950
TP2: 88,430
TP3: 89,200
Rationale:
– This sits on the upper boundary of the prior session POC.
– CVD support forming beneath this.
– Micro liquidity resting just below — offers a perfect “tap and go” level.
Win Probability: ~63%
High RR but exposed to fakeouts.
________________________________________
B. Conservative Buy Limit
Entry: 86,880 – 87,000
SL: 86,450
TP1: 87,600
TP2: 88,300
TP3: 89,600
Rationale:
– This is exactly at the major visible range POC.
– The strongest structural support on your chart.
– Aligns with Goldbach PO3 cluster (6561 row).
– Offers best protection vs liquidity raids.
Win Probability: ~71%
This is your safest actionable play for today.
C. Very Safe Buy Limit
Entry: 86,150 – 86,300
SL: 85,650
TP1: 87,200
TP2: 88,000
TP3: 89,300
Rationale:
– Deep liquidity pool + LVN pocket.
– Would clear out all stop clusters under current structure.
– Perfect institutional “grab then go”.
– Best RR but may not fill if BTC squeezes early.
Win Probability: ~78%
Highest probability if filled, lowest chance of getting filled.
4. Why These Playbooks Work
Technical Confluence
– CVD hidden divergence suggests absorption, not distribution.
– COT shows large players reducing shorts.
– Visible range profile showing thick demand under price.
– Session profiles creeping upward = accumulation.
– Goldbach Algos show bullish rotation at multiple PO3 zones.
Macro Confluence
– No major bearish catalyst on deck.
– ETF flows return → structurally bullish.
– Market building risk appetite post-FOMC stability.
5. Optimal Execution Window
– London Open → NY AM Session (8:30–11:00 EST).
– Avoid late NY and Asia except for limit-fill traps.
BTC right now is like a bodybuilder doing a slow inhale before the deadlift—everything is coiled, tense, and seconds away from a directional explosion.
Just don’t be the guy shorting the deadlift bar. They always get flattened.
This report is educational, not financial advice.

BTC ShortNice short opportunity in BTC. Targets on the charts. As there is no volume, we hope this can happen. DYOR

BTC: Buyer Zone Holds the PressureDaily buyer zone shows a successful test; 2H chart points to active buyer initiative with a target at 88,519.
This analysis is based on the Initiative Analysis (IA) method.
Hello, traders and investors!
On the daily timeframe, a buyer zone has formed at the end of the seller initiative. Yesterday, this buyer zone was tested by a seller bar on declining volume, which looks more like a test rather than active selling.
On the 2-hour timeframe, we have a sideways range with an active buyer initiative, and the nearest target is 88,519.
Yesterday, the seller attempted to push the price lower on increased volume, but the move stalled within the key volume area (87,000–86,000) of the daily buyer candle — the candle that formed the buyer zone on the daily chart.
Wishing you profitable trades!

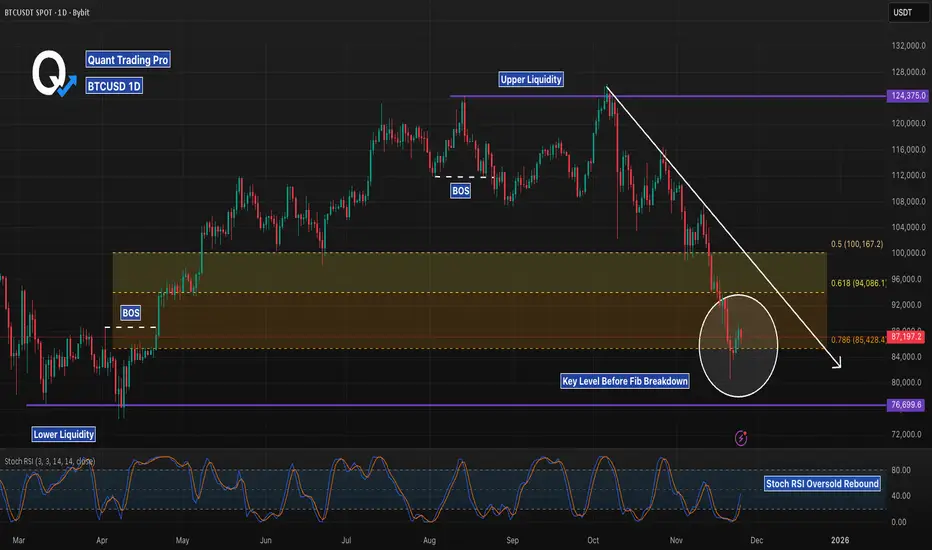
BTCUSD 1D – Testing 0.786 Support, But Is This a Real Reversal?Bitcoin has returned to a major higher-timeframe decision point: the 0.786 Fibonacci retracement, sitting inside a broad demand block that has already produced one sharp wick rejection. This zone combines three powerful confluences — a deep pullback level, prior accumulation structure, and proximity to sweeping lower liquidity from earlier this year.
Price broke structure twice on the way down, showing clear bearish momentum, but the current candle cluster suggests sellers are slowing as demand attempts to step in. A reclaim of the 0.618–0.65 range would signal strength and open the door for a revisit toward the mid-range around 100K. Failure to hold the 0.786, however, exposes the untested liquidity zone near 76.7K — a level that aligns with previous liquidity sweeps.
Stoch RSI is attempting a rebound from oversold territory, hinting at a possible short-term bounce, but trend context remains bearish until a confirmed BOS to the upside forms.
This is a pivotal zone for BTC — the next few daily candles will determine whether this is a macro higher-low or the beginning of a deeper breakdown.