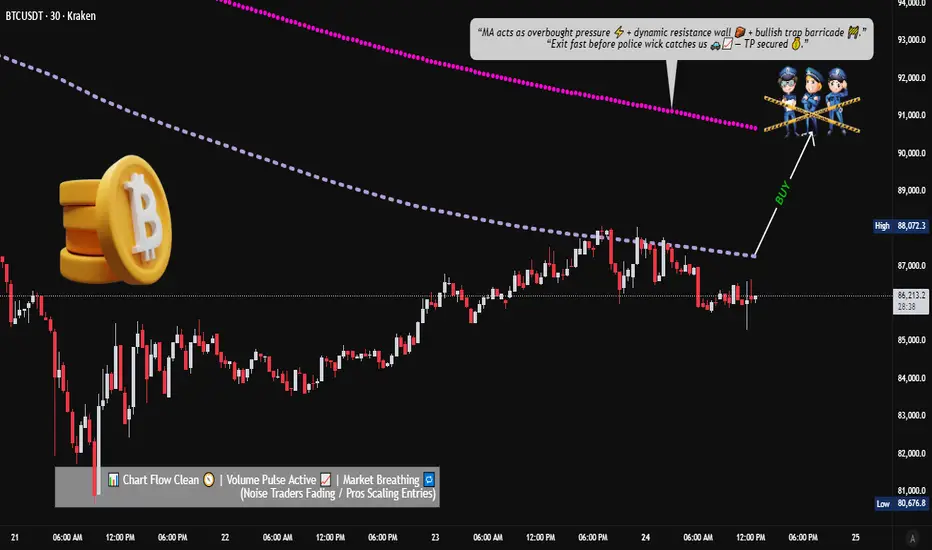
Bitcoin MA Breakout Setup: What Traders Should Watch Now📈 BTC/USDT – “BITCOIN VS TETHER” | Crypto Market Opportunity Blueprint (Day Trade)
🔥 Bullish Breakout Roadmap for Active Day Traders
🧭 PLAN:
Price is attempting a bullish breakout above key moving averages. Once price clears $88,000, momentum buyers may step in and drive a continuation leg upward.
🎯 ENTRY (Breakout Confirmation):
▶ Enter at any price level AFTER a clean moving-average breakout above $88,000.
Look for strong candle closes + volume expansion.
🛑 STOP–LOSS (Risk Management First):
⚠️ This is MY thief-style SL: $84,000
Dear Ladies & Gentlemen (Thief OG’s) — manage your own risk according to your playbook.
This is only my SL, not a rule. You’re free to adjust based on your own risk appetite.
💰 TARGET:
Moving averages align as a dynamic resistance zone, combined with overbought conditions and potential bull-trap signals.
Secure profits responsibly.
▶ Target: $90,800
Again — Dear Ladies & Gentlemen (Thief OG’s), this TP is MY personal level.
Book profits your own way, at your own risk.
🔍 Related Crypto Pairs to Watch (Correlation + Key Notes)
1️⃣ ETH/USDT (Ethereum)
Highly correlated with BTC in bullish phases
Strong ETH movement often front-runs or confirms BTC breakouts
Watch for ETH strength → may add confidence to BTC breakout trades
2️⃣ BTC.D (Bitcoin Dominance)
Rising BTC dominance = Capital flowing into Bitcoin → Supports bullish continuation
Falling dominance = Altcoins gaining share → BTC breakouts may weaken or turn choppy
3️⃣ TOTAL / TOTAL2 (Crypto Market Cap Charts)
Confirms whether capital is entering the entire crypto market
TOTAL rising with BTC strength = broad market confidence
TOTAL flat/dropping during BTC’s rise = possible bull trap
4️⃣ SOL/USDT (Solana)
Solana often moves aggressively when BTC breaks out
Sharp SOL rallies can signal strong risk-on momentum across majors
5️⃣ USDT.D (USDT Dominance)
When USDT dominance drops → Traders moving out of stablecoins → Bullish risk appetite
When it spikes → Smart money hedging → BTC breakout may fail
6️⃣ BTC/USDT Perp Funding Rate
Positive & increasing funding = heavy long side → Potential squeeze
Neutral funding = healthy breakout
Negative funding = breakout might be fueled by short covering
📊 Market Tone:
BTC continues to show strong buyer interest, but resistance pockets remain.
Trade mechanically. Don’t chase candles. Let structure confirm itself.
Trade ideas
Is the #BTC rally over?📊Is the #BTC rally over? 📈
🧠From a structural point of view, the short structure at the daily level is still intact, and the ideal target area has not yet been realized, which means that the adjustment at the daily level is not over yet. So I think the current rise is just a rebound stage, but it has not yet touched the resistance zone near 93,000, so I think there is still the possibility of continuing to rebound.
➡️Therefore, we can look for some short-term support to participate in some long positions, such as around 83400-84400.
⚠️Note that short-term bulls are in a contrarian stage, so please be sure to do risk management.
🤜If you like my analysis, please like 💖 and share 💬 BITGET:BTCUSDT.P

BTC - UPDATE: #BITCOIN - update: Bull retest ongoing - What are the key levels to watch?? 👀
For now, prices follow my previous outlook nicely!
Monthly correction still ongoing; momentum & trend remain bearish 📉 - But Monthly support are around the corner!
Let's keep it simple, here, I see a retest of the previous key support (88k) area with another bearish structure.
🟥If bulls are unable to push above 88.5k then prices will likely fall toward a new low, 79,000 --> 74,000 area! 📉🎯
A weekly candle close under 82,000$ could be a bad event (LL breakout weekly). (Holding for now).
🟩Bull scenario:
A consolidation above 79,000$ - 78,500$ would be very positive and could lead to another ATH if the monthly momentum remain stable! 📈
🟨Technically, We could also see a sideway phase starting inside the 76,000|79,000 - 100,000$ mark (monthly levels).
Currently bulls must push above 88.5k - 90k resistances.
Then --> 93 - 94k retest likely 🎯
Sum up:
Chart remain clearly bearish Under 89k --> Likely 76 - 74k or even 69k - 70k next. I think that's better to not HOPE for bull reaction yet, and wait for clean bull reversal signs.
#DYOR before investing.

Long in short Given the structure of the last 24 hours and the presence of a reversal in the range of 82200 and 85800 to create resistance against this reversal, the price could rise to the area drawn in the image. If you have a short position according to the previous analysis, you can exit and re-enter within the mentioned range.

Bitcoin Analysis: Return to Test the 70K Support BTC has officially lost the critical 90K support level and is now getting magnetized toward the POC (Point of Control) of the 70K–90K range, which sits around $83K.
We are now trading back inside this major fluctuation zone. The 70K–72K area is historically significant — it was the cycle top resistance previously, and now acts as crucial support.
🔮 Outlook:
Since entering this range, a retest of the lower boundary is highly probable. I expect BTC to drop toward the 70K–73K support/resistance level.
⏳ Timing:
This move might not happen immediately. We could see consolidation or choppy price action around/above the POC for a few days or weeks before the final leg down to test the support.
#Bitcoin #BTC #Crypto #Trading #TechnicalAnalysis #POC #SupportAndResistance

BTC — Weekend Recovery? (Because Why Not)Alright, here’s the situation:
I still think BTC has room to slide lower…
BUT a little weekend recovery bounce is totally on the menu too. 🍽️
And honestly — if we’re gonna try something slightly questionable,
the weekend is the perfect time.
Low liquidity, no ETF outflows, no institutional adults in the room…
Just pure, unfiltered crypto chaos. 😌
So yeah, let’s poke the market and see if BTC wants to behave.
Could we catch a nice weekend bounce?
Could it dump straight through the floor instead?
Absolutely on both counts. 😅
Let’s see. Stay safe degens. 🧡📉🔥
BTCMissed the fib level 0.618, looks like we are in a continuation of the downtrend. Or a while when sp500 was pushing higher btc was not following. It formed a bearish flag, expect continuation downward. There is quite a bit of liquidity above 88k.

24/11/25 Weekly OutlookLast weeks high: $96,057.33
Last weeks low: $93,034.53
Midpoint: $80,642.73
Has Bitcoin found its low, or is there more downside to come?
After yet another brutal week of downtrend BTC tags $80,000 before bouncing back towards the weekly range midpoint at $88,000, a +10% bounce. It's important to note that back in April during the Tariff War sell-off, the $80,000 area was the origin of the subsequent move up to $110,000. So historically this area should provide support when retested as it has initially.
What this does mean to me, the high time frame trend has shifted from bullish with areas of choppy rangebound consolidation before the next leg up, to now a new lower high ($108,000 rejection) which confirmed the 1d 200 EMA as resistance, and much lower low ($80,000 last weeks low) which confirms a bearish flip.
For me this week it's about finding out if the bottom is already in or if not, where will it be? In terms of bullish target should the bottom already be in, it's the $98,000-$100,000 area. This key s/r level has been an important battleground since December '24, it's a big even level too so psychologically important, and the origin of this 20% sell-off. Fear & Greed Index currently sits at 19 but hit as low as 11 over the weekend, the lowest so far this bull run. These factors have me leaning towards the local bottom is in.
However, if the bottom is not in then $74,000 comes into play, the Tariff war low. That would complete a full retrace of this years move up to $126,000 (-40% from high). The current weekly low sits at -36% move which is the largest of the bull run so far but not uncommon in previous cycles.
Good luck this week everybody!

TradeCityPro | Bitcoin Daily Analysis #230👋 Welcome to TradeCity Pro!
Let’s move on to today’s Bitcoin analysis. A new week has finally begun, and Bitcoin may once again start a strong momentum-driven trend.
⏳ 1-Hour Timeframe
Yesterday, Bitcoin continued its corrective upward move and retraced up to the 0.5 Fibonacci level.
✨ This level is extremely important — both in Fibonacci analysis and across many technical styles — and it can determine how the next major price wave forms.
✔️ For now, the price has been rejected from this level and has made a small downward move.
If the bearish movement continues, we can consider opening a short position on Bitcoin.
💥 Breaking 85,209 will be the first confirmation of a bearish trend.
Breaking 82,214 will be the main confirmation that a new downward trend has begun.
📊 If the market continues deeper corrections to the upside, the main resistance zone remains 89,000.
🔔 A stabilization above 89,000 will be the first confirmation of a new bullish trend beginning.
The full confirmation of a bullish reversal will come only after the 93,555 level is broken.
❌ Disclaimer ❌
Trading futures is highly risky and dangerous. If you're not an expert, these triggers may not be suitable for you. You should first learn risk and capital management. You can also use the educational content from this channel.
Finally, these triggers reflect my personal opinions on price action, and the market may move completely against this analysis. So, do your own research before opening any position.

$BTC Dead-Cat Bounce?Bitcoin tapped 88k after a sharp drop from 80.6k, showing a short-term recovery off the recent low. Relief rallies like this are common and don’t instantly confirm a bullish reversal.
On the 8-hour chart, price is starting to form a mini-range at this zone, similar to what we saw after the November 5 drop. The key area to watch now is the 84–82k region, we have a CME gap that might get filled around 84k as well. Any bounce from here has room to retest 90k or even push toward the yearly open at 94–96k.
However, the broader downtrend structure stays intact until CRYPTOCAP:BTC can reclaim the 94–96k zone.

Analytics: market outlook and forecasts
WHAT HAPPENED?
Last week, the medium-term downtrend continued, and we reached the next significant volume support zone - $88,000-$82,000.
On November 21, the daily candle closed at the largest volume, comparable to the dump on October 10, 2025. However, there was no equally significant price movement, which indicates an active struggle between buyers and sellers within the framework of this candle.
WHAT WILL HAPPEN: OR NOT?
At the moment, there is an initial rebound. However, consumer activity remains weak so far, so a retest of the lower levels is possible. There are strong volume zones above, which may become targets for buyers this week.
We expect a test of the $84,000-$82,000 volume anomaly zone, either from current prices or after the test of the first resistance zone of $90,000-$92,300 (volume zone). Then we can expect a more confident resumption of buys with the potential to move towards $95,000.
If buys from the designated zone don’t resume, a test of the $74,600 level is likely with the prospect of reaching lower price levels.
Buying Zones
$97,000–$93,000 (high-volume zone)
$88,000–$82,000 (high-volume zone)
Selling Zones
$101,000–$104,000 (accumulated volume)
$105,800–$106,600 (local resistance)
$109,500–$110,700 (accumulated volume)
$112,400–$113,300 (accumulated volume)
$114,700–$115,700 (accumulated volume)
$120,900–$124,000 (high-volume zone)
IMPORTANT DATES
Macroeconomic developments this week:
• Tuesday, November 25, 7:00 a.m. (UTC) — publication of German GDP for the third quarter of 2025;
• Tuesday, November 25, 13:30 (UTC) — publication of the basic index of retail sales and their volume, as well as the US producer price index for September;
• November 25, Tuesday, 3 p.m. (UTC) — publication of the CB U.S. Consumer Confidence index for November;
• November 26, Wednesday, 1 a.m. (UTC) — announcement of the New Zealand interest rate decision;
• Wednesday, November 26, 10:00 a.m. (UTC) — UK autumn budget forecast;
• Wednesday, November 26, 13:30 (UTC) — publication of US GDP for the third quarter of 2025, as well as the number of initial applications for unemployment benefits in the United States;
• Wednesday, November 26, 15:00 (UTC) — publication of the basic price index of personal consumption expenditures and sales data new housing in the USA in September;
• Friday, November 28, 13:00 (UTC) — German consumer price index for November is published.
*This post is not financial recommendation. Make decisions based on your own experience.
#analytics

BTC: Start Going LongAfter experiencing a sharp decline, BTC has now begun to show signs of stopping the fall. It will not see another continuous downward trend in the short term and is gathering momentum waiting for a rise. This is currently an excellent opportunity to buy.
BTC Trading Strategy for Today:
BTCUSDT Buy @ 81000 - 83000
TP: 90000 - 92000
With 15 years of focus on trading, I will provide accurate signals and strategies every day to help you achieve stable profits in the market. Don’t miss the daily analysis.

BTC, "A breakout first ... then absoloute fear"We’re looking at Bitcoin on the 4H timeframe, and what we’re seeing right now is just a pullback within a bearish structure.
Is the volume supporting this move up?
Definitely not.
That tells us this push higher is most likely caused by short liquidation, not genuine buying or fresh long positions entering the market.
My expectation?
BTC could fake-break the 90K level, dance around that zone for a bit, and then roll over again—
but this time, not as aggressively as before.
I’ve marked the target area for you on the chart, and I’ll keep updating as the structure develops.
If there’s any coin you want analyzed, drop it in the comments.
Your support helps me deliver even deeper, more accurate breakdowns and be your roadmap in this market.
Thanks for being here — appreciate every one of you.

BTC: Is it possible we are forming HEAD & SHOULDERS on D1 ??If we zoom back a bit on Daily BTC chart we can see it might be possible that we will have another leg formation as a right shoulder for Head and Shoulders pattern.

BTCUSDT: Elliott Wave 5 Completed – Road to $60k-$70k Support?Technical Breakdown: Analyzing the daily chart structure, Bitcoin appears to have completed a major 5-wave impulsive cycle within a long-term ascending channel. The recent peak marks the termination of Wave (5), coinciding precisely with the upper channel boundary. The RSI indicator also suggests overextended conditions, signaling a potential trend exhaustion.
Projected Path (The Blue Line): Following the completion of the motive phase, a corrective structure (A-B-C) is anticipated:
Relief Rally / B-Wave: We may see a short-term bounce or a "Bull Trap" retesting the $95,000 - $106,000 zone. This area serves as a critical supply zone.
Corrective Leg Down: Rejection from the highs should trigger a deeper correction towards the dynamic support of the channel.
Key Levels to Watch:
Resistance Zone: $95,000 - $106,000
Target / Support Zone: $60,000 - $70,000. This zone represents the confluence of the lower channel trendline and previous structural support, offering a high-probability area for a long-term bounce.
Conclusion: While the macro trend remains bullish, the risk/reward ratio at current levels is unfavorable. Traders should exercise caution and look for the completion of the corrective phase near the $60k-$70k region for optimal re-entry opportunities.
Disclaimer: This analysis is for educational purposes only and does not constitute financial advice. Always manage your risk.

BTC/USDTFollowing the OTE pullback, price has corrected into the discount zone.
If the market provides proper confirmation signals, this area may offer valid long opportunities.

BTC market snapshotI’m expecting a price pause on BTC soon — the probability is high. On the daily timeframe we’re extremely oversold, and many altcoins are showing clear bullish divergences, which usually signal at least a slowdown.
I don’t rule out a deeper move toward the $60k–70k range, especially with the current frustration around the stock selloff and large players exiting MSTR. If we can hold the $80k zone, BTC has a good chance to enter a wide consolidation range between $80k and $108k. If we fail to hold it, the probability of a crypto winter increases sharply — with a real chance of a deep panic sell.
For now, I’m leaning toward the long side. I’m long on ETH: I think Ethereum might partially decouple from BTC thanks to the staking ETF narrative, and alts may also show strength once BTC stabilizes.

$BTC Update – Quick & HonestStill bearish on Weekly & Daily.
Only 30-min & Monthly are holding green.
I know trading against higher TF trend is dangerous but here’s why I stayed calm & even bought the dip for members.
1- Weekly bounce zone + Monthly higher low
2- Weekly untested bullish Order Block + dynamic trendline support
Daily close below 83.4–85.6k = real trouble.
Till then → low volume, sideways, waiting for a trigger.
30-min flipped bullish yesterday → I posted free update here instantly.
Exact buy entries, SL & TPs → given in exclusive group.
That’s it. No hype, no bullshit, just levels & logic.

Next Move Bitcoin Is 72.5K the Reversal Zone ?BTCUSD is still evolving inside a W-X-Y-X-Z complex corrective structure which is typical after a strong bullish leg this formation indicates that the market is still correcting but without showing any signs of a deeper bearish reversal
Based on my analysis Bitcoin seems to be targeting the $72,500 level which aligns with
A major liquidity zone
A relevant harmonic extension
The probable completion area for wave Z
A historically significant dynamic support zone
If price reaches this level and reacts with clean bullish signals rejection, divergence, momentum recovery this could mark the end of the corrective pattern and trigger a new bullish impulse
As long as BTC stays above major support levels the mid-term bullish structure remains intact.
I am closely watching the $72,500 zone as the key level where the correction might end and upside continuation could begin

BTC 1 week analysisbtc will take support from this area and 70% chance are the reversal going to happen from this area. we need to see how the BTC will react from this area.

BTC temporary recovery - short term this week📌 BTC Weekly Outlook Update — Plan Remains on Track
Bitcoin continues to follow the expected roadmap with precision. The recent price action confirms a corrective move to the upside before resuming the larger bearish structure.
📍 Current Structure & Price Behavior
BTC has shown a short-term bullish retracement after forming a temporary low. However, the overall outlook remains bearish as price continues to trade below key moving averages and under the major downtrend line.
Price is now heading toward the resistance area between 94,300 and 100,780 USD, where the following confluence exists:
Previous support turned resistance
Fibonacci retracement zone
Trendline rejection zone
Liquidity pool
This area remains the most important zone to watch early this week.
📈 Expected Move — Still Valid
The original plan remains unchanged:
Short-term move upward into the supply zone at 94K → 100K.
Rejection and continuation of the downtrend.
Price targets the Fibonacci 1.618 extension zone at ~80,000 USD.
🎯 Key Target: Fibonacci 1.618 (≈ 80,500 USD)
This level is crucial as it aligns with:
✔ A major demand zone
✔ The 1.618 Fibonacci extension
✔ A deep liquidity sweep level
✔ Potential cycle correction completion
This area is expected to act as the macro support level where buyers step in aggressively.

DeGRAM | BTCUSD continues to decline below $85k📊 Technical Analysis
● BTC/USD continues to move within a broad descending channel, rejecting the dynamic resistance line multiple times and forming lower highs.
● Price is failing to reclaim the 88–90K resistance zone, and the structure points toward a continuation lower into the 82–80K support region as momentum weakens.
💡 Fundamental Analysis
● Bitcoin remains under pressure as risk sentiment cools and ETF inflows slow, with stronger USD liquidity weighing on crypto.
✨ Summary
Resistance: 88–90K. Targets: 82K → 80K. Medium-term bearish bias while below channel resistance.
-------------------
Share your opinion in the comments and support the idea with a like. Thanks for your support!

BItcoin Short Term Analysis (4H)As we had already identified Bitcoin’s support zone in previous analyses, this area is still valid.
To assess Bitcoin in the lower timeframes, there are two possible scenarios:
One is that it starts moving upward from the current prices, and the other is that it revisits the green zone once more, forms a double bottom, and then moves toward the red target.
A daily candle closing below the invalidation level will negate this analysis.
For risk management, please don't forget stop loss and capital management
When we reach the first target, save some profit and then change the stop to entry
Comment if you have any questions
Thank You
