BTC at Key Support Zone - Bullish Setup in Progress?BTC at Key Support Zone - Bullish Setup in Progress?
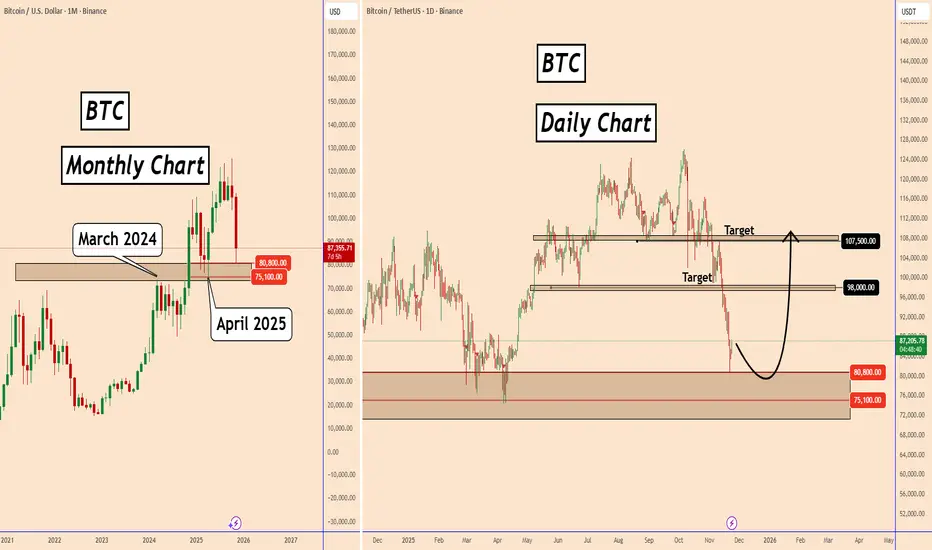
Bitcoin has reached a major long-term support zone between 75,100 – 80,800, an area that previously acted as strong support in March 2024 and April 2025 on the monthly timeframe. The current monthly candle is testing this zone again, suggesting that buyers may step in to defend this historically important level.
On the daily chart, BTC has formed a sharp decline toward this support area, but the recent reaction indicates early signs of accumulation. If buyers continue to hold this zone, a mid-term recovery could develop.
As long as the 75,100 support holds, BTC maintains strong potential for a medium-term rebound. However, a clean break below this zone would invalidate the bullish outlook and expose deeper downside.
Key Levels to Watch:
Support: 75,100 – 80,800
Target 1: 98,000
Target 2: 107,500
You may find more details in the chart!
Thank you and Good Luck!
❤️PS: Please support with a like or comment if you find this analysis useful for your trading day❤️
Trade ideas
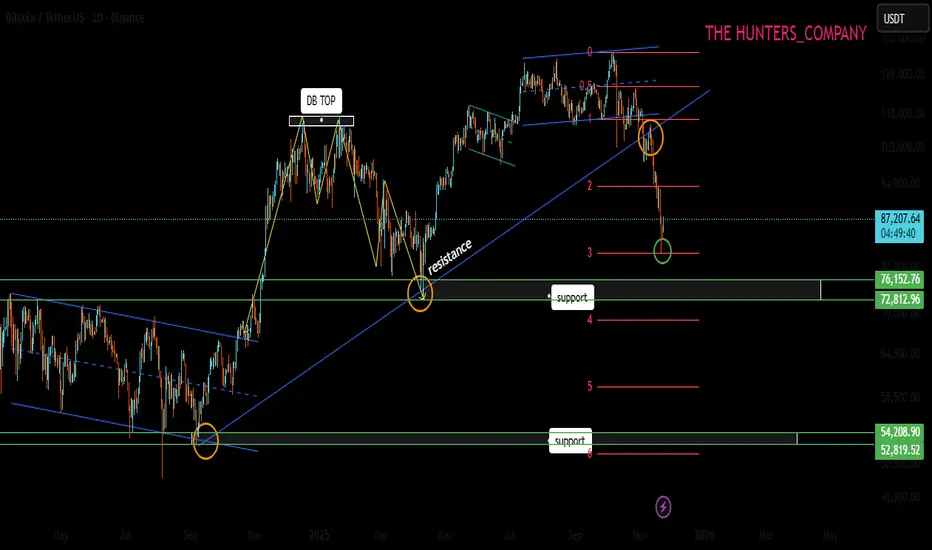
BITCOIN : Where is the price floor (full analysis)Hello friends
Well, the fall in Bitcoin has really scared the market these days, and that's why we had a sharp fall, as it turned out.
Well, if we examine the past price, you will see that there has always been an upward trend and sometimes we have had price corrections, and this is completely normal.
Before this drop, Bitcoin formed a double top pattern and the price corrected, and was again supported by the area indicated by buyers, and the price hit a higher ceiling.
But at the price ceiling, we witnessed weakness in buyers and, more importantly, a rounding of the price, which caused a heavy drop to 80,000. Now, after this sharp drop, the price is unlikely to go straight back up and make a new ceiling.
Now, after this strong spike by sellers, we can expect a descending range or channel.
What do we need to climb to?
Well, obviously the price needs to recover and buyers need to provide good support for the price, and first of all we see a range or channel, and then if they can break the channel or range, buyers can hope for a new ceiling. Otherwise, the price pivots we identified are the most important supports that the price can reach over time.
So, can we say that the rise is over?
No, nothing can be said with certainty. Maybe the price will bottom out at 70,000 to 80,000 and buyers will come in.
But in order to minimize the risk, we must move forward with the market and according to market behavior, not predict...
For this reason, it is not possible to say at this time that the price will go to a new ceiling from here because we do not see any buyers!!!
What is the solution?
Well, let's be logical: when the price goes down and Bitcoin becomes cheaper, better opportunities for buying are available to us, and we should take advantage of this situation and not enter the price ceiling emotionally and suffer losses.
Finally,
We need to see what the buyers' reaction is and if they want to support, then we can enter safely, not now that the Sharp price is falling.\
Be sure to observe risk capital management and do not get excited.
*Trade safely with us*
BTCUSDT.P - November 24, 2025Bitcoin recently formed a short-term ascending channel, showing improving momentum after a strong prior selloff. Price is currently consolidating near 86,900, with key support at 85,900 and 84,400, and resistance at 88,100 and 91,900. A breakout above 88,100 would signal additional bullish momentum toward 91,900, while any failure to hold above the rising trendline could trigger a retest of lower support levels. The current structure suggests neutral to slightly bullish momentum in the immediate term.

BTCUSDT: Trend in 4-H time frameThe color levels are very accurate levels of support and resistance in different time frames.
A strong move requires a correction to major support and we have to wait for their reaction in these areas.
So, Please pay special attention to the three accurate trend, colored levels, and you must know that SETUP is very sensitive.
BEST,
MT

A possible mid-term path for BTCUSDTWe may see a short-term move up to form the right shoulder. If that plays out, a corrective C-wave could follow. Under this scenario, a target below $47,000 comes into view.

Bitcoin Bearish FlagBitcoin's bearish flag is clearly visible on the hourly chart. It's also evident on the 4-hour chart. I expect a downward breakout to reach 74,000.
This is not investment advice. These are my notes to myself.


BTC/USD/ Bullish. Trend Read The captionSMC Trading point update
Technical analysis of summary of this BTC/USDT H1 chart:
---
Overall Bias: Bullish Short-Term
The chart shows a bullish continuation structure after mitigation of the Fair Value Gap (FVG) and support from EMAs.
---
Key Technical Points
Price retested and respected the FVG zone
Located around 85,300 – 86,000 area, acting as demand.
Price above EMA 50 (blue) and approaching EMA 200 (black)
→ Indicates building bullish momentum and potential trend reversal if EMA 200 breaks.
Structure
Higher lows forming
Price breaking minor structure highs
Strong bullish impulse candles
Target Zone Target highlighted near 90,000 – 90,100
---
Trade Idea Concept
Entry Idea:
Look for retracement back into the FVG/EMA zone for continuation long (mitigation + breakout strategy).
TP Target:
90,000 – 90,100 resistance and liquidity level
Invalidation / Stop:
Clean break below 85,300 demand zone would negate the bullish setup.
---
Smart Money Concept Perspective
FVG used as institutional demand
Liquidity grab below previous lows during correction phase
Targeting premium pricing near EMA 200 and liquidity pool
Mr SMC Trading point
---
Summary
BTC is showing strength and continuation potential. As long as price stays above 85,300–86,000 zone, the path of least resistance is upward toward 90,000.
---
Please support boost 🚀 this analysis

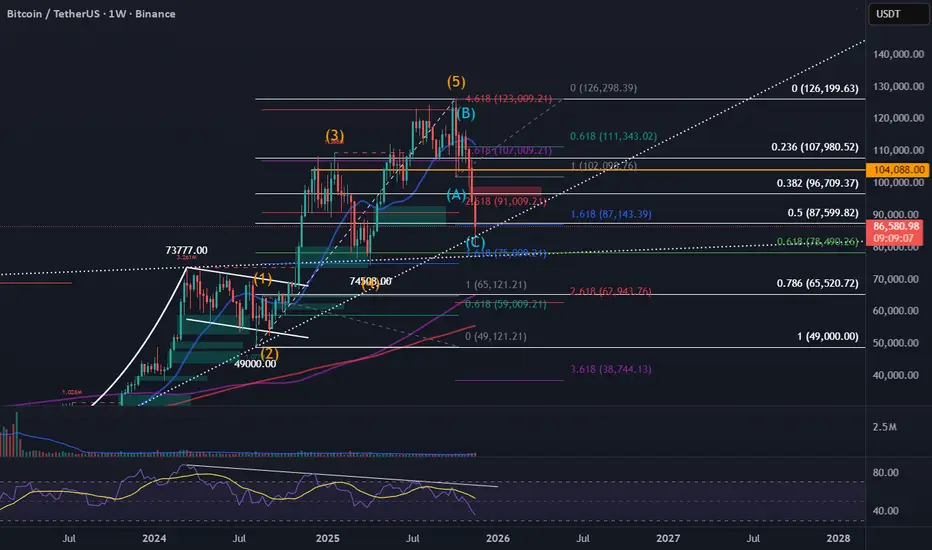
Bitcoin Macro Wave Count – Deep ABC Correction Into Key Fib SuppThis chart provides a long-term Elliott Wave and Fibonacci confluence analysis for Bitcoin on the weekly timeframe.
After completing a full 5-wave impulsive structure, BTC appears to have entered a corrective ABC pattern, with Wave (C) extending sharply into major support levels. Current price action is testing a powerful cluster of Fibonacci retracements and extensions, including the 1.618, 0.618, and a long-term ascending trendline.
Expection: weekly candle closing above 87,143 and go upwards.

BTC Is Falling Freely – Every Pullback Is Just a Trap!Bitcoin is currently entering a phase where every bounce is seen as a selling opportunity . Market sentiment has turned cautious as news continues to lean negative: BTC has broken its lowest level in six months around $86,000 , and reports indicate that a major whale has exited a position worth $1.3 billion . When big money pulls out, the market struggles to stay stable.
Observing price action, BTC is moving steadily downward with lower highs forming continuously . Every time the price attempts to rise, it gets pushed down immediately, showing that sellers are fully in control of the market. Upper price zones are consistently rejected, proving that buying pressure is not strong enough to create any meaningful reversal.
The most reasonable scenario now is that BTC may stage a technical bounce toward $93,700 , but it is likely to encounter strong selling again and continue falling toward the major target around $76,800. Any upward move during this period is just a pullback to sell , not a signal of a real trend reversal.
In short, negative news + bearish technical structure are strongly aligned, so for short-term traders, it’s best to sell with the trend , wait for price to pull back before entering, and avoid catching bottoms when the market has no clear reversal signals yet.
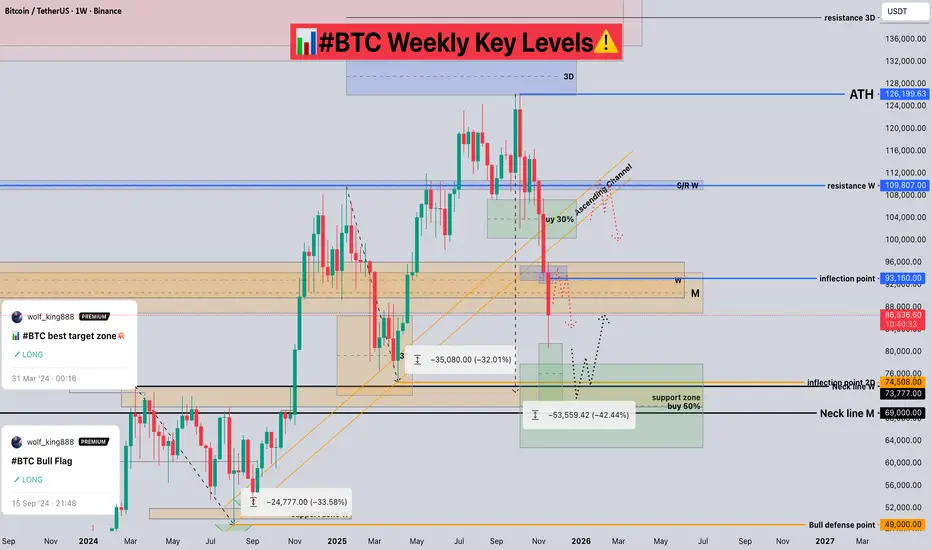
#BTC Weekly Key Levels📊#BTC Weekly Key Levels⚠️
🧠From a structural perspective, we are approaching the key weekly support level around 74508, which is also an ideal target area for a bearish structure. Therefore, if the price reaches this level directly, we can confidently enter the market.
➡️The recent resistance level is around 93000. If we break through the turning point of 93160 first, we might look for long trading opportunities after a pullback.
⚠️It's nearing the end of the month, so let's be patient. ☕️
🤜If you like my analysis, please like💖 and share💬
BINANCE:BTCUSDT
LongAccording to the analysis of the waves and the help of the Gann method, it can be expected that the price will return to the green zone again.
This is my personal opinion. Please don't use it as your trading criteria. Good luck

Retracement To Original ConsolidationWe are Bearish in BTC but This Move We have Take Buy Stops Liquidity To Expand bearish
~Price Is Seeking SSL/1M/1W
~+OB Is Pd Area Entry

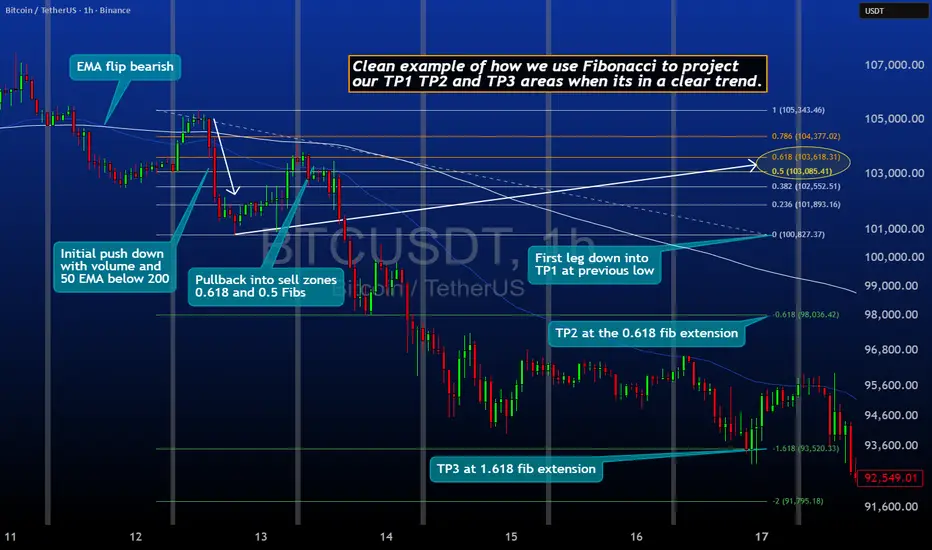
BTC Hourly Fibonacci PlayClean example of how we use Fibonacci to project our TP1 TP2 and TP3 areas when price is moving in a clear trend.
✓ Pullback aligns with structure
✓ Impulse leg sets the Fib anchor
✓ Extensions give precision on each target
✓ Trend flow stays intact while sellers push through levels
Perfect breakdown of how BTC respects Fib zones on lower timeframes.
If the price does not reach 88360, the drop will reach 76225.There is a reversal zone between the two lines a, b, which is activated by the price crossing 76225, currently a support was created if this zone was activated in the last 24 hours, which is the purpose of this price increase at this stage. In the next 3 days, the price will fall below 80000.

BTC breakdown will touch 69,000$ till March 2026As u see in my video i predicted the BTC price moves until 2027. So it will touch 69,000$ till March 2026 and will go down till 58,000$ July 2027 before starting a bold bullish. Also, guys I'm looking forward to know ur opinions on this.

BTC Loses 50 EMA: Can the 10 EMA Hold?#BTC/USDT has slipped below the 50 EMA, which was acting as dynamic support. However, price is now showing a small bounce around the 100 EMA. If Bitcoin manages to hold this level, we could see a healthy rebound from here.
But if it fails to maintain this support, further correction in the coming days becomes likely.
DYOR, NFA
Please hit the like button if you like it, and share your views in the comments section.


SELL BTCPrice tapped into the previous distribution zone and reacted from the 0.786–0.88 premium levels, showing clear signs of exhaustion.
A clean CHoCH formed on the lower timeframe, followed by a pullback into the mitigation zone where short positions become valid.
The entry is placed at the retest of the supply zone, with a stop above the recent sweep and targets reaching the lower liquidity levels around the 0.0 Fibonacci extension.
This setup follows:
Premium pricing for short positions
Liquidity sweep of the previous high
Break of structure (CHoCH)
Retracement to the imbalance + supply zone
If price maintains below the mitigation zone, continuation to the downside is expected.

Final 2025 Forecast for BTCUSDT 23rd November 2025 (Updated)Same idea as previous post, just zoomed in to see the potential gyrations towards to move towards ~$128k and hopefully beyond ✌️
1. Friday session dip to around ~$81k
2. Pump to around ~$87k over the weekend
3. Dump down to ~$80k for Monday Trap
4. Black Friday Pump to ~$89k
5. Max Pain Dump to $79k
6. Final pump to ~$128k to end the cycle
If we are lucky and price pullbacks from ~$128k and then exceeds it. Here are the targets I would be looking at;
Target #1 $140k-$145k,
Target #2 $170k-$175k
Target #3 $200k-$205k
This of course could be 100% wrong so remember (as always) to ruthlessly ✂️ cut your losers when wrong, and hold ✊ onto your winners when right.

TradeCityPro | Bitcoin Daily Analysis #229👋 Welcome to TradeCityPro!
Let’s dive into the Bitcoin analysis. Today, the market has made a deeper upward correction and is moving towards higher resistance levels.
⏳ 1-Hour Timeframe
After the downward move to the 82,214 zone, Bitcoin started a range and correction phase, and yesterday, it ranged between 82,214 and 85,209.
✨ After the price began to correct, a higher low was formed at 83,680, which allowed buyers to show some strength, and now the price has stabilized above 85,209.
✔️ This upward move continued to the 0.382 Fibonacci level, which I consider to be the first resistance level Bitcoin has reacted to.
⭐ If the price starts to drop from here and can stabilize below the 85,209 level, bearish momentum will return to the market, and we can get the first confirmation of a new downward wave.
🧮 The main confirmation for the start of this new wave will come after breaking the 82,214 level. Until then, any short position we open will be an early trigger.
🎲 Overall, Bitcoin has a very large support zone on the weekly timeframe, and this zone is between 75,000 and 90,000, where the price is currently located.
🔭 As long as the price is in this range, all positions are risky. Personally, I will reduce my risk, as traders’ win rates tend to decrease in such range-bound areas.
📊 For long positions, it’s still too early. I will wait until the price stabilizes above 89,604. This will be the first sign of buyer strength. The main confirmation for the bullish trend will come after stabilizing above 93,555.
❌ Disclaimer ❌
Trading futures is highly risky and dangerous. If you're not an expert, these triggers may not be suitable for you. You should first learn risk and capital management. You can also use the educational content from this channel.
Finally, these triggers reflect my personal opinions on price action, and the market may move completely against this analysis. So, do your own research before opening any position.

BTC LONGExpecting Long on BTC
If D1 will be closed bullish engulfing today.
ENTRY - 87000 with H1 confirmation (entry +/- 1-5K).
SL - on the chart
TP - on the chart
GOOD LUCK!
