Bitcoin Bitcoin highlighting recent price movement, supply–demand zones, trend structure, and potential trade planning.
Recently, Bitcoin experienced a sharp drop from the upper zone near 90K, breaking below the rising trendline and entering a corrective phase. After this strong bearish candle, price fell into a lower demand zone, where buyers stepped in again. This created a temporary support area around 84K – 82K
Resistance Zone: Around 90K – 92K shown in the red area. This is the region where sellers previously dominated and pushed the price down Bitcoin is now trading around $87,300–$88,000, where price is retesting a previous breakdown area. This zone acts as both resistance and a decision point.
If You find it helpful please like and comments for this post and share thanks.
Trade ideas

BTCUSDT Long: Demand Line Holds — Path Toward 96,500 Opens UpHello, traders! BTCUSDT is respecting the Triangle Demand Line after completing a full bearish cycle inside the descending channel earlier. Sellers maintained control for an extended period, pushing price steadily lower until it reached the pivot point near 88,800, where buyers finally stepped in and broke the bearish structure. This pivot zone became the foundation for a new bullish sequence, with price forming higher lows along the Triangle Demand Line. After the breakout from the descending channel, BTCUSDT entered a consolidation Range, where multiple fake breakouts occurred on both sides. This range acted as a transition phase before buyers regained momentum. Following the range, price made another bullish attempt, but faced resistance near the 96,500 Supply Zone — an area where sellers have shown strong activity in the past.
Currently, BTCUSDT is moving toward the Triangle Demand Line once again, retesting it as support. As long as buyers defend this trendline and price remains above the Demand Zone at 88,800, the bullish structure stays intact.
My scenario: if the trendline holds, BTCUSDT may bounce and continue moving toward the 96,500 resistance, which remains the main upside target for the current bullish leg. A clean breakout above 96,500 would open the path for stronger continuation. However, if price fails to hold the demand line, a corrective pullback toward the lower demand region becomes possible. For now, the market structure remains bullish while price respects the Triangle Demand Line. Manage your risk!

Bitcoin's daily chart on fire
Daily time frame with a medium-term view
1. Market trend:
Downward trend
2. Supports and resistances:
Support levels:
1- 84.646
2- 76.236
3- 67.672
Resistance levels:
1- 100.889
2- 110670
3- 123.410
3. Technical tools and indicators:
The RSI oscillator has reached near the oversold zone again after a short-term rest, and if it enters the oversold zone, it could signal further price declines.
4. Price patterns:
No specific pattern is observed.
5. Trade volume:
The trading volume is increasing in the downward trend.
Market scenarios ahead:
- Price increase scenario (bullish):
For the bullish scenario, we need the price to close above 100889; in that case, the targets of 110670 and 123410 are accessible.
- Price decrease scenario (bearish):
If the candle closes below the price of 84646, we enter the bearish scenario, in which case the targets of 76236 and 67672 are accessible.
Final note:
This view is merely a personal analysis, and the responsibility for trading transactions rests entirely with the trader. Always consider proper and safe risk management.
#Technical_Analysis #Financial_Markets #closetrader

The Bell Curve: Understanding Normal Distribution in TradingMost traders have seen the “bell curve” at some point, but very few actually use it when they think about risk and returns.
If you really understand the normal distribution, you’re already thinking more like a risk manager than a gambler.
1. What is the normal distribution?
The normal distribution is a probability distribution that describes how values tend to cluster around an average.
If you plotted a huge number of outcomes (for example, daily returns or P&L per trade), the shape you’d get would often look like a symmetric bell :
- Most observations are close to the center.
- As you move away from the center in either direction, outcomes become less frequent.
- Extreme gains and losses are possible, but they’re relatively rare.
Mathematically, a normal distribution is usually written as N(μ, σ):
μ (mu) is the mean – the average outcome.
σ (sigma) is the standard deviation – a measure of how widely the outcomes are spread around that mean.
In trading terms:
If your returns roughly follow a normal distribution, you should expect many small wins and losses clustered near zero, and only occasional large moves in either direction.
2. Mean (μ): the “drift” of your system
The mean is the point at the center of the distribution. On a chart of returns, this is where the bell is highest.
If μ > 0, the bell is shifted slightly to the right → your system is profitable on average.
If μ < 0, it’s shifted to the left → your system slowly loses money over time.
For a trading strategy, μ is basically your edge. It doesn’t need to be huge. Even a small positive mean return, if it’s consistent and combined with disciplined risk management, can compound strongly over the long run.
3. Standard deviation (σ): volatility in one number
The standard deviation controls how wide or narrow the bell curve is.
- A small σ gives a tall, narrow bell → outcomes are tightly clustered around the mean.
- A large σ gives a short, wide bell → outcomes are more spread out, with bigger swings away from the mean.
Think of σ as a statistical way to describe volatility:
- For an asset: how much its price typically moves relative to its average change.
- For your strategy: how much your returns or daily P&L fluctuate.
Two systems can have the same mean return but very different σ:
- System A: μ = 0.2%, σ = 0.5% → relatively smooth ride.
- System B: μ = 0.2%, σ = 2% → same edge, but a wild equity curve and deeper drawdowns.
Same average, totally different emotional and risk profile.
4. The 68–95–99.7 rule
One of the most useful features of the normal distribution is how predictable it is. Roughly:
- About 68.2% of observations lie within ±1σ of the mean.
- About 95.4% lie within ±2σ.
- About 99.7% lie within ±3σ.
So if daily returns of an asset were approximately normal with:
- Mean μ = 0.1%
- Standard deviation σ = 1%
Then under that model you’d expect:
- Roughly 68% of days between –0.9% and +1.1%
- Roughly 95% of days between –1.9% and +2.1%
- Only about 0.3% of days beyond ±3%
Anything far outside that ±3σ range is, in theory, a very rare event. In practice, that’s often the kind of day everyone remembers.
5. Why this matters for traders
Even with all its limitations, the normal distribution is a powerful framework for thinking about risk:
Position sizing
If you know (or estimate) the standard deviation of your returns, you can form an idea of what “normal” daily or weekly swings look like, and size positions so those swings are survivable.
Stop-loss logic
Stops that sit right in the middle of the usual noise (within about ±1σ) will get hit constantly.
Stops closer to the ±2σ–3σ region are more aligned with “something unusual is happening, I want to be out.”
Expectation management
Most days and most trades will fall inside the “boring” part of the bell curve.
Understanding that prevents you from overtrading while you wait for the edges of the distribution – the bigger opportunities.
6. The catch: markets are not perfectly normal
Real markets often break the textbook assumptions:
- Returns tend to have fat tails → extreme moves happen more often than a normal distribution would predict.
- Distributions are often skewed → one side (usually the downside) has more frequent or more severe extreme events.
That means:
- A move that looks like a “5σ event” under a normal model might actually be something that happens every few years.
- Risk models based strictly on normal assumptions usually underestimate crash risk.
- Strategies like option selling can look very safe when you only think in terms of a normal distribution, but they are very sensitive to those fat tails.
So the normal distribution should be treated as a baseline model, not as reality itself.
7. Quick recap
The normal distribution is the classic bell curve that describes how values cluster around an average.
It’s parameterized by μ (mean) and σ (standard deviation).
Roughly 68% / 95% / 99.7% of observations lie within 1σ / 2σ / 3σ of the mean in a perfectly normal world.
Markets only approximate this; they usually show fat tails and skew, so extreme events are more common than the simple model suggests.
Even with those limitations, it’s a very useful tool for thinking about returns, drawdowns, and the range of outcomes you should be prepared for.
EcoByG Bitcoin Daily Analysis #1 — Daily BTC Market UpdateWelcome to My Analysis.
Now, let’s break down today’s Bitcoin structure.
We can clearly see that Bitcoin has risen from the accumulation zone at 84K, moved up toward the 93K level, and is currently stuck there.
The 93K–96K area is the liquidity zone for sellers, which makes it a difficult region to break through.
To push past this level, Bitcoin either needs a whale-driven move, or we need to see stronger volume inflows.
From a broader perspective, the current range is between 84K and 94K. For a confirmed breakout and to say that the market structure has turned bullish.
we need Bitcoin to close several 4-hour candles above 96K.
On the other hand, if we want to consider a safe scenario for a move downward, then price must continue below 84K.
RSI shows us that when price reached 94K, momentum slowed down, indicating that BTC wants to take a breather. This is a reasonable area for consolidation before potentially continuing its movement in the upcoming sessions.
⚠️ Risk Alert ⚠️
Futures are not beginner-friendly. These triggers require solid experience.
Before using them, study risk management and practice with the learning content here.

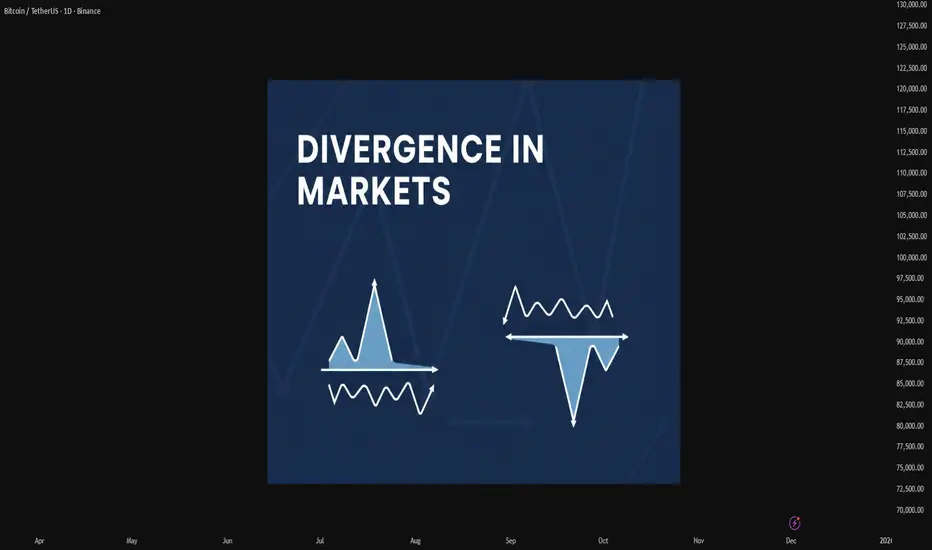
Mastering Divergence in Technical AnalysisIn technical analysis, a divergence (also called a “momentum divergence” or “price/indicator disagreement”) is one of the most powerful early warning signals available to traders. In simple terms, divergence occurs when price and a momentum indicator (such as RSI, MACD, or Awesome Oscillator etc.) move in opposite directions.
This disagreement often signals that the current trend is losing strength and that a pause, pullback, or full reversal may be approaching.
1. What Is Divergence?
Normally, in a healthy trend:
In an uptrend, price makes higher highs and momentum indicators also make higher highs.
In a downtrend, price makes lower lows and momentum indicators also make lower lows.
A divergence appears when this alignment breaks.
Typical example with RSI or MACD:
Price makes a higher high,
But the indicator makes a lower high.
This tells us that, although price has pushed to a new extreme, the underlying momentum is weaker. Smart money may be taking profits, and the late participants are driving the final leg of the move.
2. Types of Divergence
There are two main families of divergence:
Regular (classic) divergence – often associated with potential trend reversals.
Hidden divergence – often associated with trend continuation after a correction.
Within each family, we have bullish and bearish versions.
2.1 Regular Bullish Divergence – Potential Trend Reversal Up
This suggests that sellers are still pushing price to new lows, but momentum is no longer confirming the strength of this selling pressure. The downtrend is weakening and a bullish reversal may develop.
Context where it’s most powerful:
After a prolonged downtrend.
At or near a higher-timeframe support level (daily/weekly support, major demand zone, trendline, or Fibonacci confluence).
2.2 Regular Bearish Divergence – Potential Trend Reversal Down
This signals that buyers are still able to push price higher, but each new high is supported by less momentum. The uptrend is aging, and a bearish reversal or deeper correction becomes more likely.
Context where it’s most powerful:
After a strong, extended uptrend.
Around major resistance levels, supply zones, or upper trendlines.
2.3 Hidden Bullish Divergence – Trend Continuation Up
Here, price structure still shows an uptrend (higher lows), but the indicator has overshot to the downside. This often appears during pullbacks within an uptrend, suggesting that the correction is driven more by short-term emotion than by real structural weakness.
Interpretation:
Hidden bullish divergence indicates trend continuation. Bulls remain in control, and the pullback may provide an opportunity to join the uptrend at a better price.
2.4 Hidden Bearish Divergence – Trend Continuation Down
Price structure still favors the bears (lower highs), but the indicator has spiked higher, often due to a sharp counter-trend rally. This suggests that the bounce is corrective rather than the start of a new uptrend.
Interpretation:
Hidden bearish divergence favors continuation of the downtrend and often appears before the next impulsive bearish leg.
3. Which Indicators to Use?
Divergence can be spotted on many oscillators, but the most commonly used are:
RSI (Relative Strength Index) – very popular for spotting overbought/oversold zones and divergences.
MACD (and its histogram) – useful for trend and momentum, especially on higher timeframes.
Stochastic Oscillator – often used in range-bound environments.
Awesome Oscillator, CCI, etc. – alternative momentum tools, depending on your preference.
The concept is the same: price and indicator should generally confirm each other. If not, you have a divergence.
4. Timeframes and Reliability
Divergences can be found on all timeframes, but their reliability increases with higher timeframes:
On M5–M15, divergences are frequent but often short-lived. Better for scalpers.
On H1–H4, signals have more weight and can lead to multi-session moves.
On Daily/Weekly, divergences can mark major tops and bottoms, but they may take longer to play out.
A good practice is to:
Identify major divergences on higher timeframes (H4, Daily).
Refine entries on lower timeframes (M15, M30, H1) using structure and price action.
5. How to Trade Divergences (Practical Framework)
Divergence by itself is not a complete trading system. It is a signal of potential imbalance, which should be combined with:
Key levels (support, resistance, supply/demand zones).
Trend structure (higher highs/lows or lower highs/lows).
Price action confirmations (reversal candles, break of structure, etc.).
Risk management (position sizing, stop loss, invalidation level).
6. Common Mistakes When Using Divergences
- Trading every divergence blindly.
Not every divergence leads to a big reversal. Many will result in only minor pullbacks.
- Ignoring the trend.
Regular divergences against a strong trend can fail multiple times before a real top or bottom forms. Hidden divergences are often more reliable in trending markets.
- Forcing divergences where they don’t exist.
Only connect clear, obvious swing highs and lows on both price and indicator. If you have to “stretch” the lines, the signal is probably weak.
- No risk management.
A divergence is just a probability edge, not a guarantee. Always define invalidation and manage position size accordingly.
7. Best Practices
Combine divergence with market structure (trendlines, channels, higher highs/lows).
Use higher-timeframe context and drop to lower timeframes for refined entries.
Pay attention to confluence:
Divergence + key level + candlestick signal is stronger than any single factor.
Keep a trading journal of divergence setups, including screenshots from your charts. Over time, you will see which conditions work best for your style.
Divergences are not magic, but they are one of the cleanest ways to see when price and momentum disagree. Used correctly, they can:
Help you avoid entering late in a trend,
Alert you to potential reversals before they are obvious to the crowd, and
Provide high-probability continuation entries via hidden divergences within strong trends.
Lingrid | BTCUSDT Major Resistance Rejection. Potential Sell BINANCE:BTCUSDT perfectly played out my previous trading idea. Price has broken sharply below the pullback channel after failing to sustain momentum into the 93,000 resistance zone — a heavy confluence of the mid-channel trendline and the broader descending structure. This rejection confirms another lower high, reinforcing the dominant bearish sequence visible since early November. The breakdown signals a shift back into trend continuation mode, with sellers retaking control after a corrective rally.
As long as CRYPTOCAP:BTC trades below 90,000–92,000, the downside path points toward the 81,000 support, where the previous bottom formed and where a potential double-bottom setup may emerge. Momentum remains pressured, and liquidity below the recent swing low increases the probability of a sweep toward 81,000, and possibly deeper into the buying zone.
➡️ Primary scenario: continuation lower → targets 81,100.
⚠️ Risk scenario: a breakout above 93,800 would neutralize the bearish outlook.
If this idea resonates with you or you have your own opinion, traders, hit the comments. I’m excited to read your thoughts!

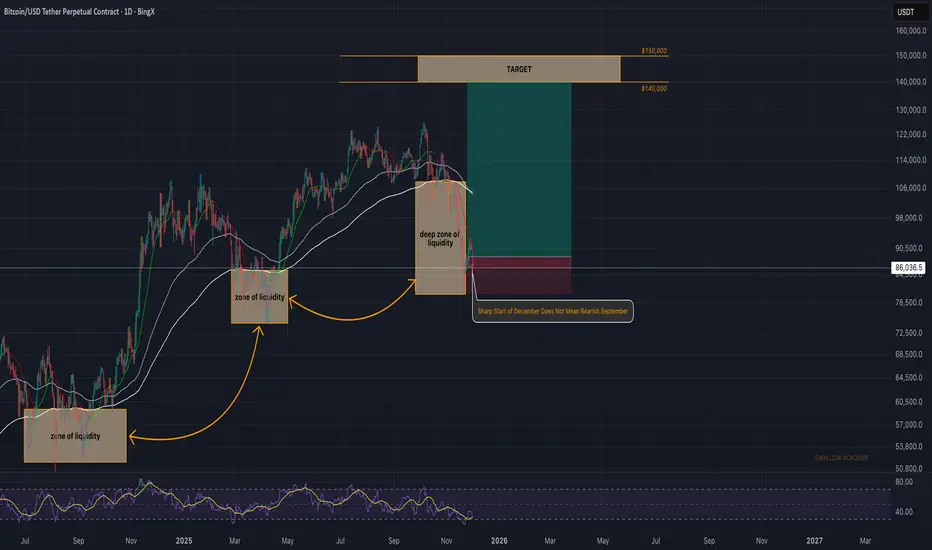
Bitcoin (BTC): Sharp Start of Dec Does Not Mean Bearish DecBitcoin had a rough start to the month but this does not change a thing for now. EMAs are still far away from the market price and we are looking for the price to recover in a matter of a week or two.
As long as buyers hold the ground around 80K, this is our game plan: long until EMAs ($105K) and then look for a breakout.
Swallow Academy
TradeCityPro | Bitcoin Daily Analysis #241👋 Welcome to TradeCity Pro!
Let’s move on to today’s Bitcoin analysis. The market is currently in a downward correction phase.
⏳ 1-Hour Timeframe
Yesterday, Bitcoin corrected down to 91,974, and as I mentioned, the bullish momentum the market had was gone.
🔔 Now the correction has become deeper, and the price has fallen to 90,421.
✔️ The last candle we saw shows strong seller dominance, and with the high selling volume, it could very well be the beginning of a new downward move.
💥 The RSI oscillator, after resetting yesterday, has now dropped all the way to the 30 level, with the possibility of breaking below it and entering the oversold zone.
💫 If that happens, given the strong selling pressure and powerful red candles, the probability of a drop toward lower levels will increase significantly.
🧩 One area the price hasn’t reacted to properly is 89,082.
🎲 This level used to be very important for Bitcoin, but recently the price hasn’t respected it much.
⭐ If the price again fails to react to this level on the next move down, we can conclude that this support has weakened.
⚖️ However, in my opinion, if buyers are going to step in, this level is not a bad candidate for a reaction.
🔭 If Bitcoin gets supported at 89,082 and moves upward, it will form a higher low compared to 85,220, which increases the probability of a bullish structure forming.
☘️ But if 89,082 breaks, the downward move toward 85,220 will begin, and that could even signal the start of the next major bearish wave on the daily timeframe.
❌ Disclaimer ❌
Trading futures is highly risky and dangerous. If you're not an expert, these triggers may not be suitable for you. You should first learn risk and capital management. You can also use the educational content from this channel.
Finally, these triggers reflect my personal opinions on price action, and the market may move completely against this analysis. So, do your own research before opening any position.

Are you people crazy? Did you not learn from the 2022 crash?I didn't think it was necessary to publish anything, at least until next year. It was clear to me, and it's even clearer now, that BTC is on the path of decline. Yet, since the end of November I've started hearing rumors of a bull run, that BTC has hit the bottom and will now FOR SURE go back to 127,000...
Either you've all gone crazy, or someone is trying to get retail investors to buy so they can happily dump in their faces.
I won't name names, but one of these con-artists has a name that start with M and ends with K.
Keep your hands on your ass; DON'T BUY!
The market is going down and will stay down until at least January.
And if by chance there should be a pump back up to 127,000, don't be amateurs; wait to get back to the top and then sell, even your grandmother.
And for the love of God; if you use perpetuals, have at least the decency to buy AND sell at the same time, keeping your SL very, very, far from the Fair Price.
Why is going down? Well, i have another name for you: it starts with T and ends with P. If you want to measure how healty is the market keep an EYE on the POTUS Coin.
A lot of people already lost a lot of money.
Be smart; crypto ARE NOT for betting junkies.
Bitcoin Momentum Building — Bullish Plan Activated!BTC/USDT — “BITCOIN VS TETHER”
Crypto Market Opportunity Blueprint (DAY / SWING Trade) 💹✨
🔥 Plan: Bullish plan confirmed
The structure is supported by a Hull Moving Average (HMA) pullback, behaving like a clean re-accumulation phase — showing buyers quietly loading before the next expansion wave.
This pattern typically appears before trend continuation legs, especially when volatility compresses after a strong impulse.
🎯 Entry
📌 YOU CAN ENTRY AT ANY PRICE LEVEL
(Structure shows strength across multiple levels with buyers defending dips.)
🛡️ Stop Loss
⚠️ This is thief SL @ 86000
Dear Ladies & Gentleman (Thief OG's), adjust your SL based on your own strategy & personal risk tolerance.
🔍 Important:
I am not recommending to use only my SL.
It's your own choice — you can make money then take money based on your own risk.
🎯 Target
Price is moving into a zone where the moving averages act as a strong resistance, combined with overbought conditions and potential trap formation, so escaping with profits is wise.
📌 Our target @ 98000
Again — Dear Ladies & Gentleman (Thief OG's):
I am not recommending to set only my TP.
You can make money then take money at your own risk.
📡 Related Pairs to Watch (Correlations & Key Behaviors)
Below are correlated assets that help confirm BTC/USDT’s flow, momentum, and broader crypto market direction. These are presented in $ format for TradingView tagging.
1️⃣ BINANCE:ETHUSDT (Ethereum)
Strongest beta-pair to Bitcoin.
When BTC shows re-accumulation, ETH often leads the breakout earlier.
If ETH breaks major resistance first → increases confidence in BTC continuation.
2️⃣ BINANCE:SOLUSDT (Solana)
High-momentum asset; reacts faster than BTC.
If SOL pumps aggressively while BTC consolidates → indicates risk-on sentiment across crypto.
Good for measuring market confidence.
3️⃣ BINANCE:BNBUSDT (BNB)
Acts as a market stability indicator.
If BNB stays firm above key moving averages, liquidity remains strong across the crypto market.
Helps confirm medium-term bullish structure.
4️⃣ BINANCE:ETHBTC (Ethereum / Bitcoin Ratio)
A critical relative-strength indicator.
If ETHBTC drops → capital rotates into BTC dominance, supporting your Bitcoin bullish plan.
If ETHBTC rises → broad alts strength, but BTC may not accelerate instantly.
5️⃣ CRYPTOCAP:TOTAL2 (Altcoin Market Cap)
When TOTAL2 rises with BTC → marketwide confidence.
When TOTAL2 stagnates but BTC rises → BTC-only rally (typical before big breakouts).
Useful to detect inflow distribution.
6️⃣ TVC:DXY (US Dollar Index)
Inverse correlation with Bitcoin.
If DXY weakens → supports BTC bullish continuation.
Important for swing traders taking multi-day positions.
7️⃣ CRYPTOCAP:USDT.D (Tether Dominance)
When USDT.D drops → money flowing from stablecoins into crypto.
When USDT.D rises → risk aversion.
Perfect tool for confirming if BTC demand is real.
📈 Summary Insight
Together, BTC’s HMA pullback + re-accumulation structure, rising momentum across correlated pairs, and declining defensive indicators build a high-probability bullish continuation environment for the next expansion wave.


BTCUSDT.P - December 7, 2025Price is consolidating in a sideways range after a sharp prior decline, forming an ascending triangle-style squeeze against short-term resistance around 90,300–90,500. A break and sustained hold above this ceiling would likely trigger a continuation move toward the higher resistance band near 92,200–92,400, aligning with the marked long scenario. Failure to clear resistance followed by a break of the rising trendline and support near 89,200–89,300 would favor the short scenario, exposing the lower support zone around 87,300–87,600.

Bitcoin (BTC) Update, Bearish Rejection?Bitcoin continues to struggle beneath the $94,000 resistance zone, with multiple failed attempts to break above it. The region aligns with daily resistance, the 0.618 Fibonacci, and VWAP, making it a critical barrier.
With weak bullish volume and rising rejection pressure, BTC risks rotating back toward the next major support at $78,430, which lines up with the weekly high-time-frame support and channel low.
Key Points:
- BTC consolidating below $94,000 with repeated failed breakouts
- Heavy resistance from 0.618 Fib, VWAP and daily level
- Losing the point of control could trigger downside acceleration
What to Expect:
If BTC breaks below the point of control, expect a flush toward $78,430. Bulls need strong volume to reclaim $94,000 and shift momentum.

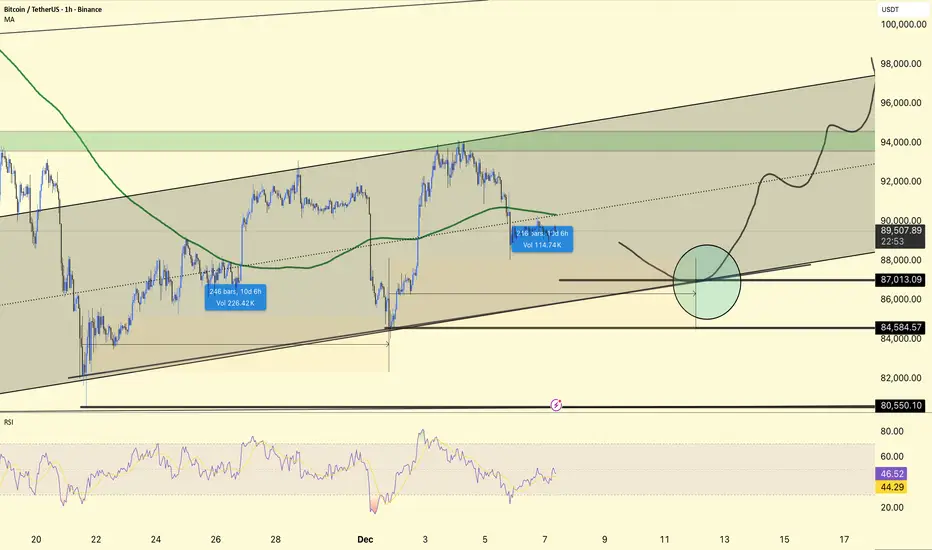
#BTC 4HOUR CHART UOPDATE !!BTCUSDT is still trading within an ascending channel, now pulling back towards the mid-lower portion of the structure after failing to sustain above 90k on the latest push.
The price has rolled over from the upper half of the channel and is heading towards the main confluence zone around 87,000–88,000, where the lower channel line, previous horizontal support, and your marked circle align.
84,584 and 80,550 remain the next downside reference supports; holding above 87k maintains the short-term bullish channel, while a break below 84,584 would increase the risk of a deeper correction towards 80k.
A decline into the 87k area, followed by basing and a continuation back towards 92k–94k, and if buyers defend the channel as drawn, possibly to the 96k–98k channel top.
The RSI is mid-range rather than overbought, so there is room for another leg down or a sharp bounce to test support; using 87k–84.5k as the main invalidation band for aggressive longs fits within the current 4H structure.
DYOR | NFA,
TradeCityPro | Bitcoin Daily Analysis #238👋 Welcome to TradeCity Pro!
Let’s move on to today’s Bitcoin analysis. The market is currently in a correction phase after the bearish leg it experienced yesterday.
⏳ 1-Hour Timeframe
After the drop Bitcoin made, even fake-breaking the 85,220 level,
✔️ the price has started its correction, reaching up to 87,088.
🔔 During this correction, a Head & Shoulders pattern has formed, with the activation trigger being the 87,088 level.
💥 If this pattern gets activated, deeper corrections could follow.
The next resistance zone to watch is 89,082.
📊 Market volume has increased with the start of the new week, but during this correction, the volume is decreasing. This indicates that the downtrend still holds strength, and the likelihood of the trend continuing remains high.
💡 In this case, we can open a short position either after a fakeout at 89,082 or by confirming a Dow Theory breakdown.
The main short trigger right now is the 85,220 level.
📈 For a long position, breaking 89,082 is a risky trigger.
Personally, I prefer to wait for more confirmation before deciding to enter a long position on Bitcoin.
❌ Disclaimer ❌
Trading futures is highly risky and dangerous. If you're not an expert, these triggers may not be suitable for you. You should first learn risk and capital management. You can also use the educational content from this channel.
Finally, these triggers reflect my personal opinions on price action, and the market may move completely against this analysis. So, do your own research before opening any position.

BTCUSDT — Correction Ending? Potential Bullish ContinuationAccording to signals from my custom indicator, the recent correction appears to be approaching its end.
Although the indicator itself is not shown on the chart, the analysis here is based on the same reversal conditions that it typically detects.
The market is currently holding above a key local support area, forming a potential higher low — a structure that often precedes bullish continuation. Price reacted similarly in previous cycles, where a series of higher lows led to upward momentum.
Key points of my analysis:
My custom indicator suggests that the corrective phase is weakening.
Price is stabilizing near support, showing reduced selling pressure.
Previous market swings formed similar patterns before moving higher.
A breakout above the nearest resistance zone could confirm the continuation of the uptrend.
This scenario reflects one possible outcome based on indicator-derived signals and market structure.
I will update the idea if conditions change.

TradeCityPro | Bitcoin Daily Analysis #244👋 Welcome to TradeCity Pro!
Let’s move on to Bitcoin analysis; with the start of the new week, the market has taken a fresh trend.
⏳ 1-hour timeframe
Yesterday on Bitcoin, we had two very important levels that the price was fluctuating between.
⭐ The resistance zone 90022 and the support 88890 were the areas where breaking either of them could give us a position.
💥 The first position we could open yesterday was a short, which after breaking 88890 made a sharp move that would reach our target as well, but afterward the price started a bullish move, and after the previous bearish move turned into a fakeout, a lot of bullish momentum entered it.
💧 After this move, the 90022 trigger also activated, and Bitcoin moved upward to the 91447 area.
🧩 Overall, yesterday was a very volatile day, because after reaching 91447, Bitcoin corrected to near 88890, and then again moved upward.
🎲 But today Bitcoin was struggling with the 91447 zone, which it has so far managed to break, and with a bit of momentum and a slight slope, it is moving upward.
⚡️ We can see this trend weakness inside the RSI; the shape of the candles also shows a lot of trend weakness, but volume still doesn’t have a strong divergence with the bullish trend.
✔️ If this weakness continues, the probability of a fake break of 91447 and the start of a new bearish move increases a lot.
🔔 But if Bitcoin keeps its momentum and the move continues, the next zone the price can react to will be 93609.
❌ Disclaimer ❌
Trading futures is highly risky and dangerous. If you're not an expert, these triggers may not be suitable for you. You should first learn risk and capital management. You can also use the educational content from this channel.
Finally, these triggers reflect my personal opinions on price action, and the market may move completely against this analysis. So, do your own research before opening any position.

BTC recovers ahead of interest rate announcementBTC Daily Chart – Short Analysis
Bitcoin is still trading inside a bearish structure, staying below key moving averages and the descending trendline.
Main resistance: $100,000 – $102,000
This zone aligns with the 0.5 Fibonacci level and previous support turned resistance → high probability of rejection.
Current move: Price is bouncing, but no bullish confirmation as long as it stays under $102k.
Expected scenario:
BTC may retest the $100k–$102k zone, fail to break it, and continue downward.
Downside target: $83,700 – $84,000
This level matches liquidity and trendline confluence.
Conclusion:
Trend remains bearish unless BTC breaks and closes above $102k.

BTCUSDT.P - December 6, 2025Price remains in a short-term downtrend, respecting a descending trendline while failing to establish any higher swing highs. The current rebound shows weak momentum, suggesting a potential retest of the 87.5k–86.9k support region before any meaningful reversal attempt. A sustained break above 91.2k resistance would be required to confirm bullish structure, while a drop below 85.7k would likely extend the bearish leg. Overall, the market is consolidating within a corrective structure, awaiting a decisive breakout.

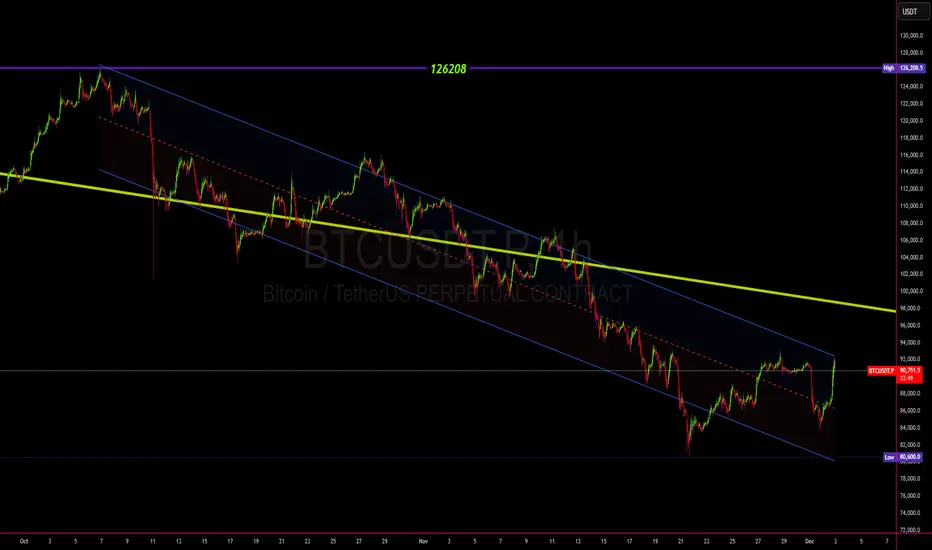
BTCUSDT – Regression Channel Breakout Before the Next Drop🟣 BTCUSDT – Regression Channel Breakout Before the Next Drop
Since October 6th, Bitcoin has been moving inside a downward regression channel.
Recently, the price touched the upper boundary of the channel, signaling a possible end of the current correction phase.
📈 A short-term bounce toward the $94,000 level is still possible,
but afterwards, Bitcoin is likely to start its next bearish wave targeting the $75,000 zone.
🔸 Key Resistance: $94,000
🔹 Key Target Zone: $75,000
Mid-term trend remains bearish as BTC prepares for another downward leg.
📘 What is a Regression Channel and Why It Matters?
A regression channel is a powerful analytical tool that automatically combines what many indicators try to show individually — such as trend strength, momentum shifts, and volatility ranges.
It’s built using linear regression, which means it mathematically calculates the “average path” of price movement, along with upper and lower boundaries that represent standard deviations from that average.
In simple terms:
➡️ It already reflects what tools like MACD, RSI, and moving averages are trying to capture — but in a single, visual, and statistically balanced structure.
That’s why breaking out of a regression channel often signals a major shift in trend direction or volatility expansion.
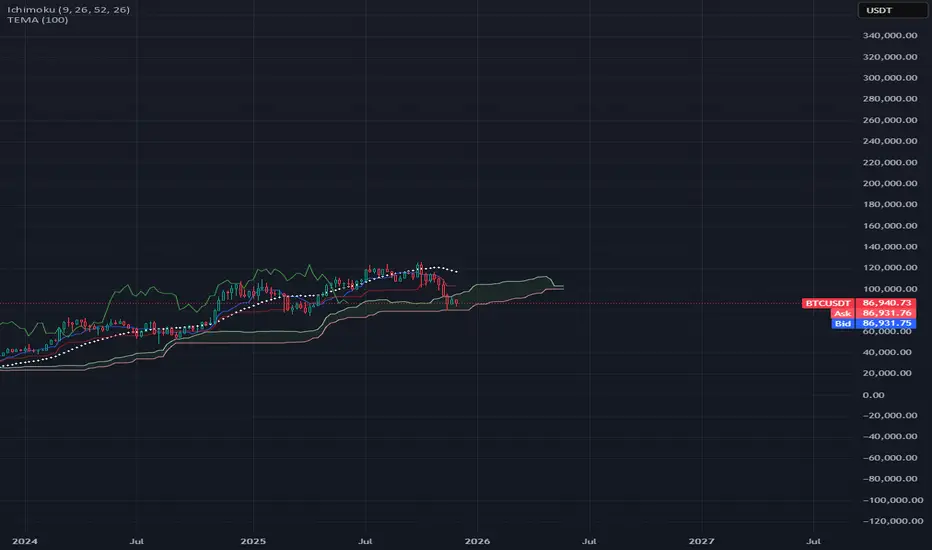
BTC target is $100KBTC is technically forming a double bottom on the daily timeframe (a trend-reversal pattern). The target sits around 100K. With the upcoming Fed meeting and a potential rate cut, we could break out toward 105K, and I wouldn’t rule out a move to 110K — a test of the 50/200-day MAs — as the market shifts into short-trend expectations.

BTCUSD Technical Analysis (30m)This post provides an analytical breakdown of BTCUSD using the 30-minute timeframe (30m), leveraging our proprietary technical indicator: the Trend Break Target (TBT) Indicator.
Market Structure Shift and Indicator Activation
The current analysis focuses on a significant change in the market structure observed on the 30m chart. The TBT indicator was programmed to detect and react to specific conditions that signify a high-probability continuation or reversal.
Activation Signal: The indicator was activated and the price targets were subsequently generated following the closing of the specific candle indicated by the arrow on the chart. This close confirmed the necessary structural change (e.g., a break of resistance/support, or a specific pattern completion) required by the TBT's underlying logic. This market structure shift (MSS) provides the foundation for the calculated price objectives.
Calculated Price Targets (TBT Forecast)
Based on the activation of the Trend Break Target Indicator, the following potential price objectives have been calculated. These targets represent areas where price action is statistically likely to find resistance, profit-taking activity, or a high-probability exhaustion point for the current move.
🎯 Target 1 (T1): $90,400
Significance: This is the immediate and most probable objective, often representing a minimum measured move following the structure break.
🎯 Target 2 (T2): $91,450
Significance: A secondary, extended target that comes into play if bullish momentum persists and T1 is cleanly surpassed and held.
🎯 Target 3 (T3): $92,709
Significance: The final, ambitious target representing the full potential move calculated by the TBT model based on the initial structure shift. It acts as the high-end projection for the current impulsive wave.
Disclaimer
Note: This analysis is based on a proprietary indicator and should be used for informational and educational purposes only. Always manage your risk effectively, use appropriate stop-loss orders, and conduct your own due diligence before making any trading decisions. The crypto market is highly volatile, and actual price action may deviate from projected targets.
