BTCIn my opinion this area will rebound the price to the previous top because it supported with FVG & Order block the price stay at this area for accumulation it’s not financial advisor it’s just my personal opinion
Trade ideas

Why Retailers lose 90%? Smart Money doesn't allow to follow!Hello. If you’re curious about trading or you’ve tried to beat the markets ? Think what smart money has been doing again and again.
Disclaimer:
This post is dedicated solely to educational content and community-driven insights. All information shared here—including strategies, trade setups, and opinions—are for informational purposes only and should not be considered as financial, investment, or trading advice.
Viewers are solely responsible for their own investment decisions.
Trading and investing in financial markets involve risk, and the channel will not be held responsible for any losses or damages incurred as a result of actions taken based on the content presented.
Please consult with a qualified financial advisor before making any investment decisions.
In this post you will learn:
1. How to read price action, not just indicators.
2. How to follow the smart money, not the crowd.
3. Real statistics, live examples, and honest warnings. The discipline needed to turn a trading account into long-lasting wealth.
4. If you’re ready to stop searching for shortcuts and finally learn what works from first principles, understand this post.
Let’s begin at the root: What is trading?
It is the act of buying and selling financial instruments, like stocks, currencies, commodities, or derivatives, with the sole aim of making a profit which has the ability to impact the economy of a country is now accessible to anyone with a mobile phone.
You might wonder, how does trading influence an entire economy?
Trading adds massive liquidity to financial markets, allows companies to raise capital for expansion, and lets investors participate in a country’s growth story. However, wild or speculative trading can sometimes trigger volatility, even a crisis, impacting jobs and industries across the economy.
So when it is available to everyone, why do Most Fail? Why It’s Not for Everyone?
Here’s the catch — trading isn’t everyone’s cup of tea. Statistics are brutal: Nearly 90% of retail traders lose money over time. Only about 10% manage to survive, and an even smaller fraction thrives long-term. So, if you’re looking for an easy way out or quick money, trading might not be for you.
Honestly, if you want guaranteed results and dislike uncertainty, it’s better to focus your energy elsewhere — that’s the hard truth.
At the same time, Who Thrives in Trading?
It is one of the toughest jobs in the world — tougher than rocket science or open-heart surgery, because here, the enemy is your own psychology. Those who succeed have discipline, patience, and adaptability. If that excites you, then let’s continue.
Moving forward, Why Most Retail Traders Lose?
Let’s talk about indicators and patterns. Have you ever wondered why there’s a flood of free tools online, each claiming to unlock profits? If these tools worked, wouldn’t everyone be rich? The harsh reality is Big institutions and banks have the resource to track all algorithms and setups of every petty retailer. Indicators are often designed to manipulate the masses, helping big players—smart money—feed off smaller, retail traders. Most of these strategies look good on paper, but fail miserably upto 50% in real trades.
Let me explain further with A Live Example: How Smart Money Profits from Retailers:
Whenever retail traders enter a popular selling zone, their collective stop losses are clustered just above that zone. The smart money—hedge funds and institutional players—can see these clusters. Smart money already has the expertise and resources to track down the cluster of stop losses. They push the price up briefly, either by buying pressure or hedging, triggering retail stop losses and buying those positions at a discount. The losing retail traders exit in panic, while the smart money enjoys the rebound.
So, the common man’s entry price often becomes the rich man’s exit, and the provider of liquidity is the one who loses.
Thus, The Statistics emphasise on Rich Get Richer, Poor Get Poorer.
Statistics don’t lie. The top 1% of traders control over 80% of the wealth because they understand market psychology, price action, and institutional flow. Most retail traders keep chasing easy profits, only to end up as “fuel” for the professionals. The famous saying, “In trading, money flows from the impatient to the patient,” is very real.
In all these circumstances, Can Retail Traders Ever Win?
Is there any hope for retailers to win consistently? Yes, but only with the right approach!
Forget about magic indicators, secret patterns, or the latest news flash—institutions can manipulate all that. But there’s one thing nobody can manipulate: price itself.
Stop chasing the crowd, imagine them as a school of fish. Instead, hug the belly of the big sharks—blend in with institutional flow and study pure price action.
Why Price Action is King?
Why trust price action? Because price is the total of every force—news, sentiment, manipulation, and truly valuable information. If you can read the footprints left by smart money, you’ll stop getting tricked by the bread crumbs distributed to unsuspecting retailers.
Stop losses of retailers are literally profits for institutions. A retailer’s entry, without proper analysis, often becomes a signal for big players to do the opposite. Follow price—not noise.
Drop a comment sharing your own trading journey, mistakes, or burning questions.

BTC Outlook: 90K Zone Retest PossibleBTC Outlook: 90K Zone Retest Possible
BTC has entered a strong reaction zone around 82–85K, which historically acts as a demand block. The initial bounce from this area suggests buyers are stepping in again.
Key Reasons a Move Back to 90K Is Possible:
1. Strong Demand Zone (82–85K)
BTC is showing clear absorption of selling pressure. This is typically the first step before a reversal toward higher resistance levels.
2. Market Structure Reversal Pattern
Your chart indicates a potential W-bottom / reclamation setup. Once BTC holds above 85.6K, momentum usually shifts bullish.
3. Liquidity Above (88–90K)
There’s a large cluster of untapped liquidity at 88–90K where previous breakdowns occurred.
Market makers are incentivized to push price back up to that zone.
4. 90.3K = First Major Resistance Target
The yellow line at 90,370 aligns with:
HTF resistance
Former support flip
Liquidity target
Perfect location for a retest.
Scenario Path (Matches Your Green Projection):
Bounce from 82–85K
Break above 85.6K reclaim
First target → 87K
Pullback / consolidation
Final push → 89.5K–90.3K

BTC Weekly — Break Below the 50W MA: Expect Choppy Range Before ⚠️ Not Financial Advice
Bitcoin has broken below the 50-week moving average (50W MA), a key long-term trend indicator. Historically, losing this level often leads to a choppy consolidation phase before a new direction is chosen.
🔍 Outlook
🔸 Sideways chop near 80K is likely in the short term.
🔹 Potential bounce toward 90K to retest the 50W MA / MA ribbon from below.
🔻 If rejection occurs, BTC may continue lower toward the 60K support zone.
📌 Summary
Break of 50W MA → range around 80K → possible retest at 90K → failed retest could target 60K.
⚠️ This is not financial advice — just my personal analysis.

BTC relief bounce ?There should be a relief bounce in this area :
- RSI and STOCH are oversold and hidden bullish divergence.
- BTC at order block W area.
- Sentiment is so extreme fear for days.
- Fair value gap.
- There isn't a significant pullback so far in this drawdown. There is no significant short liquidation yet.
- Price always retests the 200DMA every time it breaks through it even in bear market.

BTCSince my first forecast regarding the BINANCE:BTCUSDT.P decline 2 months ago, the asset has dropped by 27%.
As of today, my global outlook on the market remains bearish. The first significant target is 78,200.2. Once reached, it will be necessary to assess the character of the price movement there.
While we move toward this target, the entire market will also likely head down. This creates excellent opportunities to profit, as the market is moving rather than standing still.
Subscribe to not miss updates.

Bitcoin daily analysisBitcoin daily analysis. After a strong break of the dynamic trend line and a pullback to it at 115, it is now moving downwards. Important support areas are drawn on the chart. The probability of a rebound from these areas is high.

btc Based on the current Bitcoin chart, I believe that Bitcoin has attempted to reach the upper boundary of its channel but may not succeed. It is likely to reverse its upward trend and shift to a downward trajectory near the $120,000 mark.
"It’s possible that altseason might be starting soon."

$BTC USDT 2D NEW CHART UPDATECRYPTOCAP:BTC USDT 2D NEW CHART UPDATE ✅
📌The fall that started with the CRYPTOCAP:BTC rising wedge breakout is still ongoing.
📌It has completed all the targets in my previous analysis.
📌 CRYPTOCAP:BTC could see a bullish reversal from the limits I have marked below (70k - 73k), if that happens, CRYPTOCAP:BTC will cross the 100K mark again 🔥🚀

BTCMy view on CRYPTOCAP:BTC has shifted. It looks like we are forming a descending channel and a small breakdown is playing out. Overall this will trap bears and create the illusion that the market is finished, but structurally it sets up a powerful rally to the upside.

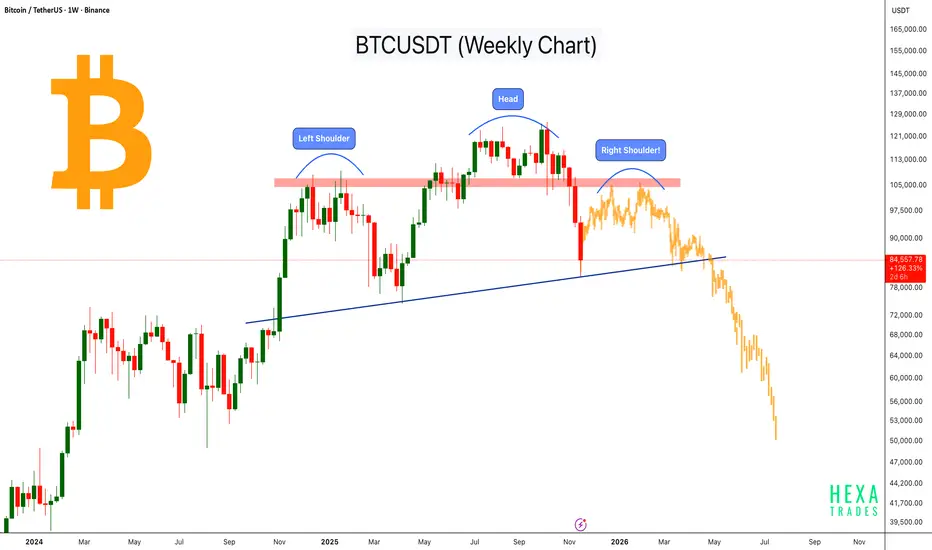
Bitcoin’s Macro H&S Structure Building Up!Bitcoin is developing a potential Head and Shoulders pattern on the weekly timeframe, a classic bearish reversal structure. The price has repeatedly rejected the major resistance zone marked in red, indicating strong selling pressure.
As of now, the left shoulder and head are already formed, and based on the current structure, the right shoulder could form within the next 1–3 months if BTC continues to face resistance near this zone $100k- $107k
Price is currently hovering near the long-term ascending trendline (neckline), which will play a key role in determining whether this pattern completes and confirms.
The yellow candles represent a forecast, illustrating a possible scenario if the right shoulder forms and the neckline breaks.
Key Highlights
- Left shoulder and head are already formed; right shoulder may form in the next 1–3 months.
- Strong rejection from major resistance, similar to classic H&S structures.
- Ascending neckline acting as final support.
- Yellow candles are only a forecast, not actual price data.
- Pattern confirmation requires a decisive break below the neckline.
This is an early-stage macro pattern, and traders should watch how BTC reacts around the resistance zone and the neckline in the coming weeks.
Cheers
Hexa
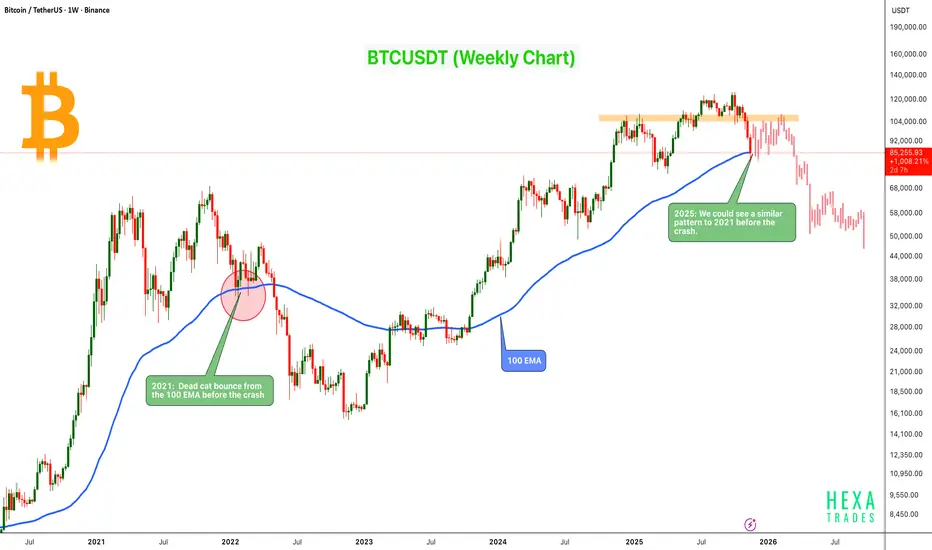
2021 vs 2025: Bitcoin Showing a Similar Macro StructureBitcoin is showing a price structure very similar to the 2021 macro top, where BTC formed a dead-cat bounce from the 100 EMA before beginning a major correction.
On the current cycle, BTC is once again testing the 100 EMA, and the price reaction looks very similar to the 2021 pattern: a brief bounce followed by continued downside pressure.
Key Points:
- 2021 Pattern: BTC bounced from the 100 EMA before the macro crash.
- 2025 Price Action: Showing a similar bounce and reject structure at the same weekly EMA.
- Major Weekly Resistance: Market showing exhaustion and lower-high structure, just like previous cycle tops.
- Potential Dead-Cat Bounce: We could see a bounce toward the $100K–$107K zone before the downtrend continues.
- Possible Repeat Scenario: If BTC fails to hold above the 100 EMA, history suggests a deeper correction may follow.
Cheers
Hexa
BTCUSDT 4H, aggressively sold off!We’re looking at BTCUSDT on the 4H timeframe.
After a strong bullish leg, BTC has been aggressively sold off from the upper supply zones and is now sitting inside the first major demand area.
🔑 Key zones on the chart (approx.):
4H FVG (supply): 95,000 – 97,500
Current demand zone / upper OB: 82,500 – 85,500
Major lower demand zone: 72,000 – 77,000
Price is at a decision point, and I’m mainly watching three scenarios:
Scenario 1 – Relief long into the 4H FVG
If price holds inside 82.5K–85.5K
and on the lower timeframes (15m / 1H) we get a clear bullish CHoCH + clean long OB,
BTC can easily print a relief rally toward the 95K–97.5K 4H FVG.
This would be a decent short-term long opportunity,
but as long as the 4H structure remains heavy and impulsively bearish,
I still treat it as a counter-trend move, not the start of a fresh macro bull leg.
Scenario 2 – Pullback to FVG and continuation down
My main working scenario:
BTC bounces from the current demand zone,
Fills the 4H FVG around 95K–97.5K,
Shows strong rejection + wicks + reversal candle + bearish CHoCH on LTF,
Then starts the next leg down toward the 72K–77K major demand zone.
For me, any serious swing/position longs make more sense down there,
not in the middle of this aggressive repricing move.
Scenario 3 – No strong bounce, straight flush to 72K–77K
If the current demand around 82.5K–85.5K completely fails
and we don’t see any meaningful bullish structure on lower timeframes,
BTC can simply bleed directly into 72K–77K without a big relief move.
In that case,
trying to long every little dip in the middle of the dump is basically fighting the flow.
I’d rather wait patiently until:
Either we get a proper relief rally into the 4H FVG (Scenarios 1–2),
Or price flushes into 72K–77K and gives a high-quality long setup from there.
🧠 Overall view (our style):
We’re in a distribution / repricing phase, not a clean trending leg.
Big, conviction longs for me belong closer to 72K–77K, not here.
Any long from current levels is tactical, short-term and LTF-based,
with tight risk and clear invalidation – not a “close your eyes and hold” type of trade.

BTCUSDT.P - November 22, 2025Bitcoin is in a pronounced downtrend, with price action consistently making lower highs under the descending trendline and currently trading below both resistance levels at 86,313 and 88,214. Recent momentum remains bearish, with sellers actively defending rallies and price targeting the marked support band near 78,800–79,000; unless price recovers above 86,313 resistance, expect further weakness and trend continuation.

BTCUSDTBitcoin could correct to $65,000 and then resume its upward trend, potentially rising to the $700,000 range.
Hassanhosseinzadeh

Liquidity Hunt: How Whales Move the MarketEver wonder why prices always seem to drop just below your stop loss before bouncing back? It’s not bad luck; it’s liquidity in action. The big players are prowling, hunting for stops, and if you don't understand where they’re lurking, you might just be their next target. Liquidity definition refers to how easily an asset can be bought or sold without significantly affecting its price, and in the world of crypto, this dynamic can make or break your trade. Let’s dig into how these whales work the market and how you can avoid becoming their prey.
What is Liquidity?
Liquidity meaning refers to how easily an asset can be bought or sold without affecting its price. In the context of crypto, it's crucial to know that high liquidity means less slippage, while low liquidity can lead to sharp price moves. Market liquidity is essential for smooth trading, but it also creates opportunities for big players to manipulate price action by targeting stop losses.
Liquidity Risk and Big Players
Liquidity risk arises when there's not enough liquidity to execute trades efficiently, especially during volatile periods. Big players exploit these conditions by pushing prices through key support and resistance levels, triggering stop orders and capturing liquidity. This is why it’s vital to be aware of where liquidity is concentrated — big players often target areas with many stop losses, trapping retail traders in the process.
Tools to Analyze Liquidity
Volume Indicators: Use tools like Accumulation/Distribution or On-Balance Volume (OBV) to spot surges in volume that may indicate manipulation or big players entering the market.
Bitcoin Liquidity Heatmap: A Bitcoin liquidity heatmap shows where large buy and sell orders are placed, helping you avoid areas where liquidity is likely to be targeted by whales.
Liquidity Ratio Formula: Another great tool which helps measure market depth and liquidity. You can calculate it as:
A higher ratio indicates that there is more buying pressure, suggesting the market is more liquid and less prone to manipulation. On the other hand, a lower ratio signals more sell orders, which could expose you to increased liquidity risk and higher chances of price manipulation by big players.
Price Action: Watch for candlestick patterns like pin bars or engulfing candles near key support or resistance levels to anticipate price reversals after stop hunts.
Conclusion
While tools like volume indicators and Bitcoin liquidity heatmaps can help, always stay vigilant. Use wider stop losses to avoid getting trapped at key levels, and stay cautious during periods of low liquidity when whales are most active. This article isn’t trading advice — always DYOR and trade responsibly.

i don't know what i am doing i don't know what i am doing but looks very bullish by mid 2025 to late 2025 in shaa allah


BTC(based on NEo wave)everything is ok with flat.
time of wave B is more than wave A and wave C is making a beautiful impulse wave.
bitcoin price under 74500$ is a bear trap!

Will this date come true?This is not fundamentally unbelievable, especially with the manipulation of governments in the crypto market
What is completely clear to us activists is the manipulation of absurd markets with great temptation by the yellow-haired doll and the child politicians and child killers around him.
Although I am not active in this market, I feel sorry for you, despite this cesspool soaked in the blood and hearts of the people of the world!
These numbers may not be realized, but the much blood that has been spilled on the ground will rise and the consequences will drown it.
The freedmen will definitely win.
And I must say, this analysis may expire after a while:
Good luck
MJ.REZAEI

So What now ??Hey everyone,
let's cut the noise and talk seriously about where Bitcoin (BTC) is at right now.
For months, I've been saying what a lot of people didn't want to hear: the ideal trading range for BTC has to be somewhere in the $40,000 to $60,000 zone.
I got mocked, ignored, and even straight-up cursed out for saying that when the price was flying high. Everyone was chanting "$100k, $200k!" and acting like gravity didn't exist.
Well, look where we are now. BTC is roaming around $80-85k, a significant drop from those all-time highs.
The future feels... well, unknowable to those who only looked up.
But for those of us who kept one foot on the ground, this pullback isn't a shock; it's a return to a healthier balance.
🧐 Why the Fall Happened: No Magic Money Tree
The drop didn't come out of nowhere. It's a combination of simple market mechanics and shifting sentiment. Let's break down the three big reasons why the party ended:
1-The $100k+ Support Just Wasn't There:
Let's face it, sustained price action above $100k requires an insane amount of new, constant capital. The demand just couldn't keep pace with the towering valuation. When the buying dried up, the price had to correct to a level where new investors saw value again, or where old holders decided to take profits. The market ran out of steam, and the volume needed to hold those upper levels simply wasn't there.
2-Long-Term Holders Got Tired of Waiting:
You call them "Diamond Hands," but even the most dedicated long-term holders (LTHs) have a breaking point. After a massive run-up and then an extended period of stagnation at the top, many LTHs started thinking, "This is good enough." Taking profit after a multi-year hold is a natural part of the market cycle, and when enough big wallets decide to cash out, it creates a powerful selling pressure that crushes the price floor.
3-The Altcoin Allure:
The ETH Factor: As BTC got super expensive, the percentage return on a $1,000 price move started to feel insignificant. At $100k, a $1k move is just 1%. Meanwhile, competitors like Ethereum (ETH) offered a more appealing risk-to-reward ratio. When $1,000 means a 3-5% gain on a mid-level price, traders and even institutions start to migrate to where the potential for profit is mathematically greater. Traders are profit-driven, and ETH offered a more "profitable range" for active players.
🔮 What Now? The Balance of Waves
So, what's next? More brutal crashes? Unlikely. What we are likely entering is a period of choppy, sideways consolidation—a return to that healthy $40k–$60k range over time, or at least a deep, volatile consolidation between $60k and $85k as the dust settles.
This is the cycle: Euphoria leads to Correction, which leads to Consolidation.
The fall won't be a straight line. It will continue in waves—sometimes up, sometimes down. We'll see dead-cat bounces that trick new money into buying, followed by more downside.
The goal for the market now is to find a new balance between risk and profitability. This balance isn't found at the peak; it's found in the middle ground.
Why? Because the standard profitable range for retail and even whales is when smaller price differences still mean meaningful percentage gains.
Remember the Math:
At $100,000, a $1,000 move is 1%.
At $50,000, a $1,000 move is 2%.
At $30,000, a $1,000 move is ~3.3%.
The lower range offers a higher percentage return for the same absolute dollar change, making it a much more attractive area for accumulating or trading. The price needs to drop to where the perceived risk of a further fall is balanced by the reward of those higher percentage gains.
🧭 So What now ??:
Trade the Range, Ignore the Noise
The days of easy 10x returns might be on pause, but the opportunity for smart, methodical trading is back. We are entering a trader's market, not a HODLer's dreamland.
Stick to your charts, define your support and resistance, and trade the range, not the rumor. The market is giving us a second chance to accumulate at realistic prices. Don't waste it by listening to the ghosts of "$200k."
Good luck , Good hunt and Trade safe guys !

BTCUSDTHi
CRYPTOCAP:BTC is correction from ATH but if couldn't keep level (110.000$) we see more downtrend and I think deep bear-trend to 80.000$.

Bitcoin’s Drop From $125K: A Healthy Correction?The recent decline is largely a correction after BTC’s massive rally from $17K (Oct 2023).
Based on Fibonacci levels, the next key supports sit at $85K, $70K, and $60K — with $70K looking especially strong to me.
And yes… Bitcoin is officially 4-digit again.
#Bitcoin #BTC #CryptoAnalysis #Fibonacci #CryptoMarket
