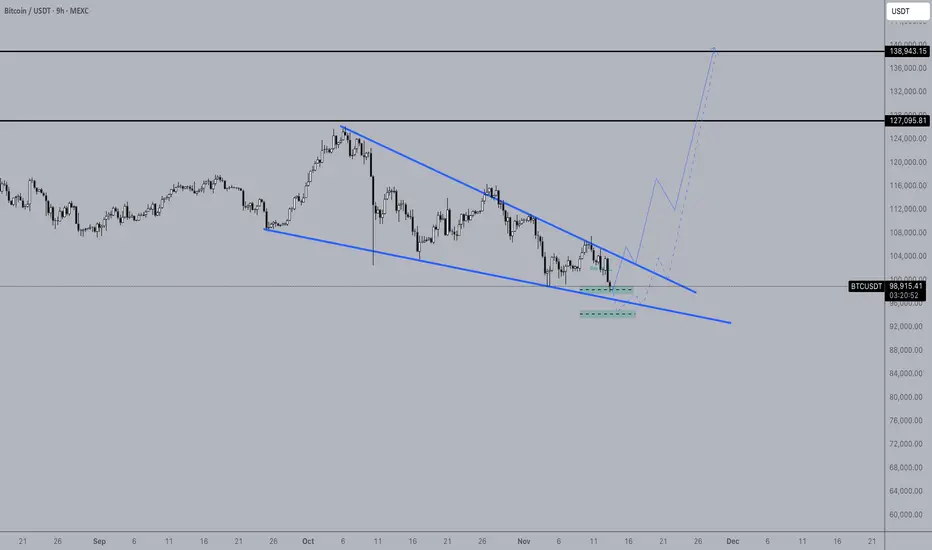
Análise BTC 13/11Okay my friends, two targets set, 1st at 155k, and second at 177k. I believe in the 2nd target at 177k. Let's go for it.
We can't miss the bottom of this widening, otherwise we'll be aiming for the 85-89k region.
Let's go for it!
Trade ideas

ESTUDO BTC 13/11Okay my friends, two targets set, I believe in the 2nd target at 176k. Let's go for it.
We can't miss the bottom of this widening.
Let's go!

2022 Bitcoin Crash will come back again BTC entered bearish territory.
BTC is losing steam after failing to reclaim the upper trend channel. Price broke below the short-term rising structure and continues to show weakening momentum, with RSI rolling under mid-range and MACD printing a steady bearish shift. Volume also confirms the slowdown: demand is thinning while sellers are starting to dominate.
If this corrective structure plays out, BTC could revisit the major support block near $72K–$75K, which aligns with the previous consolidation range and the 0.382 Fibonacci retracement. This area represents the most logical liquidity zone before any attempt at trend continuation.
Structurally, the macro bull trend remains intact, but the current setup favors a controlled pullback over immediate expansion. Watching how BTC behaves on the retest of broken support/resistance will determine whether a deeper sweep into the high-$60Ks is still on the table.
Market is shifting from acceleration to stabilization, preparing the next macro move.

BTC bull, now if; but when.Two "G brev" zones that will hold BTC and push it to 150k+
Either bulls from here, or a bit lower before BTC rocket launches, taking ALTs to stratosphere.
- Source?
Me brev.
BTC DECODED ANALYSIS (COULD SAVE YOUR MILLIONS)🚨BTC has two very strong skip DECODED supports at $96,800 and $94,100. However, by creating a higher low, it seems BTC will eventually test its quarterly support levels which I mentioned in my earlier post on October 29th 2025🚨
Skipped supports always wait to be tested.
This message is for educational purposes only.
Always DYOR.

Bitcoin Bearish Reversal SetupBitcoin is showing a potential bearish setup as the price approaches the central resistance zone. A rejection from this area could lead to a downward move toward the 101,500 target level, with selling pressure expected below the trendline.

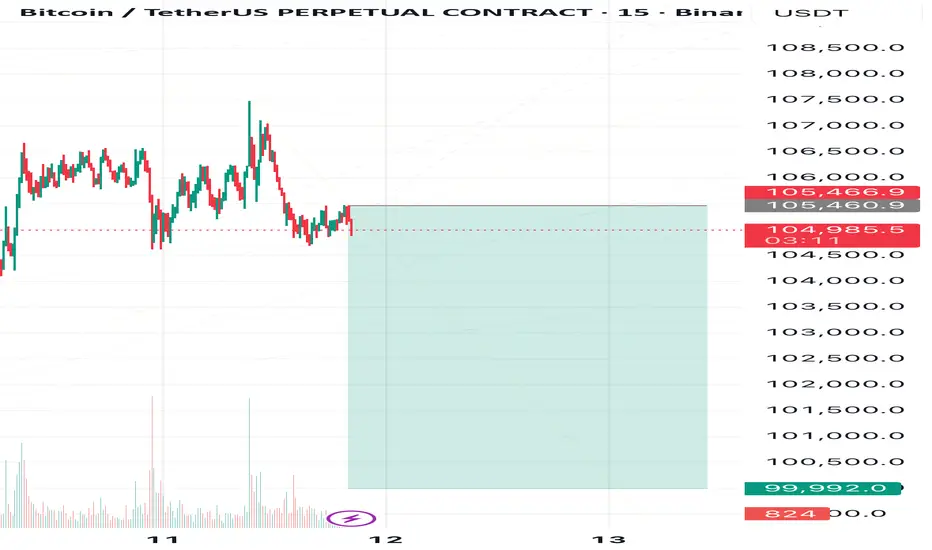
Bitcoin’s Slide to the 100K SideI expect Bitcoin to decline toward 99,999🎯
❌Invalidation Zone: above 105,565.
⚠️This is not a signal — make your own decisions and always trade with stop-losses!)
What’s your view on this setup?
💭Share your thoughts in the comments and follow to stay tuned for what’s next!
98000,96000,92000 None of them hold BitcoinAccording to the survey, all support points are bullish and there is no support until the 8254700 point, Bitcoin will enter the 80000 channel without stopping in the 90000 range in the next 6 days.

BTC/USDT Analysis. The scenario didn’t materialize — waiting for
Hello everyone! CryptoRobotics trader-analyst here, and this is your daily market update.
Yesterday, the expected bounce from the $104,700–$104,100 zone did not materialize. Buyers failed to regain control, and Bitcoin fell sharply toward the more significant support at $102,000–$100,000 (volume anomalies), which triggered an immediate reaction.
However, the market structure still does not favor buyers: sellers continue to produce local results, while buyers show weak follow-through on every correction, despite a few confident candles.
Price has now tested the seller’s mirror zone at $102,900–$103,600 and is pulling back. A repeated test of $102,000–$100,000 remains likely — this is where buyers might show strength again.
Still, the most conservative long setup requires a break of the local downtrend: a breakout and consolidation above $105,400. Only after a retest of this level should we look for long opportunities with a proper risk–reward profile.
Buy zones:
• $102,000–$100,000 (volume anomalies)
• $97,000–$93,000 (volume area)
Sell zones:
• $105,800–$106,600 (local resistance)
• $109,500–$110,700 (accumulated volumes)
• $112,400–$113,300 (accumulated volumes)
• $114,700–$115,700 (accumulated volumes)
• $120,900–$124,000 (volume area)
This publication is not financial advice.
BTCUSDT.P - November 13, 2025BTCUSDT.P has formed a consolidation base above $101,600, indicating accumulation and potential for further upside toward the $103,685 partial profit zone and the $105,297 profit level.
A decisive close above $103,700 would confirm bullish momentum continuation, while failure to hold above $100,700 could expose the pair to renewed selling pressure toward $99,200.
Risk Assessment: Moderate — The price structure suggests potential bullish recovery from oversold levels, but the setup remains vulnerable to downside continuation if support near $100,700–$100,000 fails to hold. Traders should consider moving stops to breakeven once the $103,685 level is reached to manage risk effectively.

BTCUSDT Review November 13 2025Short-term price movement ideas.
The price has tested the daily short FVG, from which we received volume confirmations, and we are now sitting inside a daily zone of interest. From this area, further downside continuation is expected.
At the moment, we have two potential scenarios for a downside move:
A rejection from the current 4H zone, provided we get confirmation on the 1H timeframe.
A sweep/manipulation of the 4H high, followed by confirmation on the 1H chart as well.
Be flexible, adapt to the market, and the results will come quickly. Good luck to everyone.

btc_long_1y_morninghi
you can inter 101600 long to 103600
with stop loss 99600
please protect yourdelf your money health,...
thanks
i am a loser dont trade with a loser signal

BTC 1H chat 13 Nov 2025Currently, on the 1-hour timeframe, BTC appears to be forming a Head and Shoulders pattern. At the moment, we’re seeing a potential upward movement as the price may retest the 105K–107K level before making its next major move.

Retracement is loadinghi every one
happy Yalda night to all humans around the world
in my opinion btc should retrace to 0.5 fibo area even may touch the 0.618 area
but the most important thing is that we are in a bullish phase and selling trades are not allowed , i suggest to keep calm and buy the dip on 80k and 74k .

bulls are here what do you think guys ?
will btc hold current bull run ? i guess btc community can count on uptrend at least to 34K
please share ur opinions and support us with your boosts and comments

Market Makers Manipulation on BitcoinIs this the end?
Im of the belief theres still a good chance its not. Not with so much institutional interest.
But what Im sure of is that the market makers are manipulating these prices.
Yesterday was a prime example of the MMs pushing the market up in London, straight into a vector candle recovery area before dumping it back down in NY.
Our MM three wave theory says we should have one more level down but I'll be on the look out for a final damage dump under 100k to take out everyones stops and buy those last bags at these prices.

BTCprice has flushed out week hands from high leverage longs. however market is showing strength and we are ready for the next leg up. checking the order flow and liquidation clusters, next liquidation is at the upside.
Demand Zones (Support):
$98,000 - $100,000 - MAJOR DEMAND ZONE (multiple bounces, high volume)
Entry Zone 1: $99,000 - $101,500 (CURRENT - Aggressive)
Entry Zone 2: $97,000 - $99,000 (Pullback - Ideal)
T1: $101,950,000 (+4.5% from current) - Take 30% off
T2: $102,500 (+9%) - Take 40% off
T3: $103,000 (+13%) - Take 20% off
final Tp: 105k
STOP LOSS: $96,500

$BTC Bullish Consolidation or Setup for Breakout?BINANCE:BTCUSDT CRYPTOCAP:BTC Bullish Consolidation or Setup for Breakout?
Current trend: BTC is in a tight bullish consolidation after a sharp pullback, holding above the key 101.5K support zone like a champ 🛡️. It's respecting that purple support line beautifully, with buyers stepping in on dips—classic accumulation vibes.
Hold support? High probability yes, as volume spikes on greens show conviction. Breakout above 107.5K resistance? Imminent if we close above it this session 🚀—could ignite a quick 3-5% pump.
Dip risk? Mild, maybe to 100K if macro FUD hits, but oversold RSI (around 35) screams bounce potential.
Target: Short-term 110K on breakout; longer 115K if momentum builds.
Indicators I'm eyeing: RSI for oversold pops, MACD histogram turning positive, and 50 EMA as dynamic support 📊.
#BTCBreakout #CryptoTrading #AltcoinPioneers

BTC Playbook: Buy Floors, Fade 104k Until Confirmed__________________________________________________________________________________
Market Overview
__________________________________________________________________________________
Bitcoin faded from 104k and is cycling back into layered demand near 100.4k, with higher timeframes still constructive while intraday pressure and a risk‑off overlay dominate.
Momentum: Range with downside skew after a sharp 104k rejection and tests of 100,409 and the 99k pocket.
Key levels:
- Resistances (HTF): 102,900–103,300; 103,900–104,050; 105,600–106,000
- Supports (HTF): 100,409; 99,490; 98,760–98,944
Volumes: Very high on intraday (30m–2H); normal on 1D.
Multi-timeframe signals: 1D/12H Up; 6H/4H/2H/1H Down. HTF structure stays constructive, but LTF pressure and the risk‑off overlay cap bounces into 104k–106k.
Harvest zones: 100,400 (Cluster A) / 98,800–98,900 (Cluster B) — ideal dip‑buying areas for inverse pyramiding with confirmation.
Risk On / Risk Off Indicator context: Neutral sell bias; it currently contradicts the HTF Up filter, so treat bounces as tactical until it flips.
__________________________________________________________________________________
Trading Playbook
__________________________________________________________________________________
The dominant posture is tactical: buy confirmed dips into floors and fade weak tests of overhead supply while the macro overlay stays risk‑off.
Global bias: Cautious long into floors while HTF trend is Up; invalidate the dip‑buy thesis on sustained closes below 98,760.
Opportunities:
- Buy: Reactive long at 100,409 or 99,490–98,760/98,944 on a ≥2H bullish close; targets 102,000 then 104,045; risk below the engaged floor.
- Breakout: Acceptance above 104,045 with rising volume → add toward 105,600–106,000.
- Tactical sell: Fade 103,900–104,050 or 105,600–106,000 if rejected and Risk On / Risk Off stays neutral‑sell.
Risk zones / invalidations: Loss and acceptance below 99,490 opens 98,760; daily acceptance below 98,760 invalidates dip‑buying until reclaimed. Acceptance above 106,000 invalidates shorts.
Macro catalysts (Twitter, Perplexity, news): Fed liquidity rhetoric turning supportive; CPI/UST auctions can swing risk; geopolitical overhang keeps the risk tone fragile. Strong daily ETF inflows recently help spot demand but need persistence.
Harvest Plan (Inverse Pyramid):
- Palier 1 (12.5%): 100,400 (Cluster A) + reversal ≥2H → entry
- Palier 2 (+12.5%): 96,400–94,400 (-4/-6% below Palier 1) → reinforcement
- TP: 50% at +12–18% from PMP → recycle cash
- Runner: hold if break & hold first R HTF (103,900–104,050)
- Invalidation: < HTF Pivot Low 99,800 or 96h no momentum
- Hedge (1x): Short first R HTF on rejection + bearish trend → neutralize below R
__________________________________________________________________________________
Multi-Timeframe Insights
__________________________________________________________________________________
Overall, HTF remains constructive while LTFs are in a corrective downswing pressing demand steps.
1D/12H: Uptrend filter intact; price rotating back into 100,409 and the 99k ladder; acceptance back above 104,045 would re‑open 105,600–106,000.
6H/4H: Down within HTF Up; clean lower‑highs from 105k with buyers defending 99,490 and the 98,760–98,944 cluster; look for reversal signals there.
2H/1H/30m/15m: Down with very high sell volume; squeezes likely if 100,409 is reclaimed swiftly; failure risks a stop‑run into 99,490 → 98,8k.
Major confluence: Tight demand at 98,760–98,944 aligns with aggregate value; 100,409 is the line‑in‑the‑sand; 104,045 is the primary trigger above.
__________________________________________________________________________________
Macro & On-Chain Drivers
__________________________________________________________________________________
Macro liquidity tone is turning supportive, but near‑term event risk and a risk‑off equity regime keep the overlay defensive.
Macro events: Fed officials flagged reserves nearing “ample” and a technical easing bias; CPI and UST auctions can jolt risk; geopolitics maintains a risk premium.
Bitcoin analysis: Strongest daily US spot ETF net inflows in a month aided spot demand, while a derivatives long flush reset froth; 104k is the overhead decision zone; 100,409 and 99k are key defenses.
On-chain data: Short‑Term Holder stress and seller‑exhaustion reads favor reflex bounces near 100k; structurally, a durable reclaim above prior highs remains unconfirmed.
Expected impact: If ETF flows persist and CPI doesn’t shock, acceptance above 104,045 tilts the path toward 105,600–106,000; if 100,409 fails, a run into 99,490 → 98,8k is likely before stronger dip‑bids.
__________________________________________________________________________________
Key Takeaways
__________________________________________________________________________________
BTC is rotating within a range under 104k, pressing two‑step demand around 100.4k and 99k.
- Trend: Neutral with downside pressure while Risk On / Risk Off stays neutral‑sell.
- Setup: Buy confirmed dips at 100,409 and 99,490–98,760/98,944; add on 104,045 acceptance.
- Macro: Fed liquidity tone helps, but CPI and geopolitics can flip the tape quickly.
Stay patient, define risk at the floors, and let the market hand you the next move rather than forcing one.

BTCUSDT.P - November 11, 2025BTCUSDT.P is showing potential for a short-term bearish continuation after breaking below the ascending trendline support near $105,300. The pair has lost upward momentum, indicating potential downside movement toward the $103,530 partial profit zone and the $102,039 profit level. A stop level is positioned around $107,473–$107,714, marking the invalidation area for this bearish setup.
Risk Assessment: Moderate — The breakdown from trendline support favors further downside, but a sustained recovery above $105,600–$106,000 could signal a failed breakdown and shift sentiment back toward bullish consolidation.

Bitcoin long from 101k Npoc is located at that region.
I think that is a great level for a bounce up.
let this fomc conference finish , and things will start setting up.
BTCUSDT.P : positionHello friends
Given the decline we had, the price has now made a good floor and is supported, but it is still early for confirmation. We must let the resistance break and form a higher ceiling for us.
Everything is clear and transparent. If you have any questions, ask.
Don't forget risk and capital management.
*Trade safely with us*

BITCOIN TO $130,000 - $140,000Hello! It's me again!
My friends, it seems that BTC's price action is clearly indicating its trend and direction. Of the last five candles on the weekly chart, four have shown a very clear indication: there are buyers on the downside, it has remained above the 55-week moving average, and we've seen very strong support around $103,000.
It's also true that the uptrend on the weekly chart is already quite worn out. It has been quite long and has remained solid until now; however, this could be the bullish move that ends the trend.
At the moment, the technical analysis is simple and very clear: we are within the lower range of an upward move (I bought at $109,900 six weeks ago and I plan to hold since the movement is clear).
In conclusion, Bitcoin will be looking for the $130,000 range and, at most, $140,000. The final upward move is about to begin.
See you later! And remember, this isn't advice, it's just an opinion.
