Bitcoin is copying the previous cycle and is beginning a bearishBitcoin is copying the previous cycle and is starting a bearish cycle.
We are approaching a zone that typically forms after breaking the 365-day MA.
From that support zone, we bounce back toward the previous resistance area.
But that level is nothing more than a bull trap waiting for us, and after that everything turns into hell.
Believe in the cycles when everyone else is lying
Trade ideas


BTC Market & Sentiment Analysis – Nov 20 2025Market & Macro Sentiment (Nov 20 2025)
Facts: After a record high near $126k in October, BTC has dropped below $90k — a drawdown of ~30% that wiped more than $1 trillion from crypto market value and triggered a “death cross” (50-/200-day MAs) noted in the news. This drop coincides with falling inflows and growing outflows in spot ETFs, tighter Fed rate expectations and a broader risk-off move.
View: This is no longer a “local pull-back”, it looks like a full deleveraging/reset phase. Downward momentum is stronger than a healthy correction.
Social activity & sentiment (LunarCrush)
Facts: LunarCrush metrics show a Galaxy Score≈67 (moderately bullish), positive sentiment≈76% (slightly below the ~79% average), ≈289k mentions in the last 24h versus ~160k average, ≈101k unique creators and social dominance≈30% versus ~17% average. Activity and dominance are near records.
View: The price action is risk-off, but social chatter is hysterical rather than capitulating — record engagement while sentiment only drifts from euphoria to cautious bullish. This mix of panic in price and strong narrative interest often lays the groundwork for medium-term contrarian ideas, though not an immediate reversal. If activity stays high while price consolidates or dips, we could see an “accumulation under negative noise” phase forming the base for the next leg up.
Derivatives, ETFs & leverage
Facts: Media coverage highlights falling inflows and the pivot to outflows in spot ETFs, the “death cross” on daily charts, tighter Fed rate expectations and broad risk-off across equities/AI. Billion-dollar liquidations show that leverage plus ETF flows and macro factors have all hit in one direction.
View: It’s not that speculators have left – there was too much leverage. Until ETF outflows reverse and funding/perpetual curves normalize, rallies are more likely to be short squeezes than a sustainable trend.
Polymarket expectations
Long-term (2025): In March 2025 Polymarket assigned ~51% probability of ≥$120k in 2025 (40% ≥$130k, 27% ≥$150k, 17% ≥$200k). By mid-summer those odds rose to ~75% for ≥$120k, 55% for >$130k and 33% for >$150k. Spring–summer sentiment was clearly extended-bull, and those levels were eventually hit.
Current (end-2025): Markets now give ≈62% probability that BTC finishes 2025 under $90k, reflecting a reset from spring’s “120‑150k+ is almost inevitable”. Earlier markets (spring 2025) gave <<10% for $200k by end-March and weighted scenarios ≤$75k.
View: Polymarket participants are pricing a drawn-out correction, but they haven’t ruled out a new ATH later. If BTC ends the year above $90k, expectations could swing back quickly, offering an interesting trade against the current consensus.

Is Bitcoin still bearish? (1D)In response to the question of whether Bitcoin is still bearish | the answer is yes.
After the drop, Bitcoin has reached a strong support zone, where it’s currently reacting and consuming lower supports. A rejection from the red zone is expected.
However, keep in mind that due to the high volume of short positions, the red zone might even experience a fakeout before the drop continues.
A daily candle closing above the invalidation level would invalidate this analysis.
For risk management, please don't forget stop loss and capital management
Comment if you have any questions
Thank You

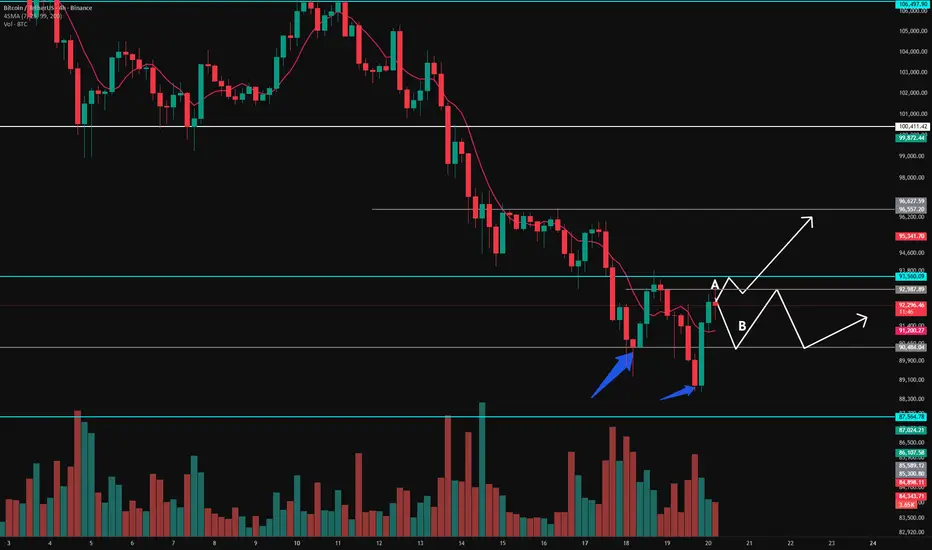
“Two Soft Rebounds at 90k — Is the Tide Turning?”BTC’s been moving in a slow, heavy drift lately, but the chart finally gave us something to pay attention to around that 90k zone 💎. We tapped that level twice — not with explosive rejections, more like soft kicks — but both times price refused to stay below. That tells me buyers aren’t fully awake, but they’re not gone either 🧘♂️.
The whole area is acting like a shallow support shelf, not strong but still holding the flow. And with the market chilling under that big supply box near 100k, the structure feels like it’s sitting between two waves: a weak floor below, and a heavy ceiling above 🌬️📉📈.
From here, the chart leaves space for two clean scenarios:
✨ 1. A push-up toward 100k:
If buyers step in even a bit, price has a smooth lane back into that orange zone. No major resistance in the middle — just open water.
🔥 2. A slide toward 86k:
If 90k stops catching price, the next real demand pocket sits around 86k. That’s where the chart actually thickens and buyers historically show up.
Right now it’s a calm stretch — market’s floating in neutral water, waiting for someone to make the first move 🌊.
So what do you think?
Do those soft rejections from 90k open the door for a 100k retest, or is 86k the next wave we ride? 🏄♂️💬

BTCUSDT SHORT SETUP ( 20 NOV 2025 )If you have doubt on our trades you can test in demo.
BINANCE:BTCUSDT SHORT SETUP
📊 EP: 92577.29
💵 TP: 90707.79
❌ SL: 93495.25
Trade Ideas:
Idea is clearly shown on chart + we have some secret psychologies and tools behind this.
Trade Signal:
I provide trade signals here so follow my account and you can check my previous analysis. So don't miss trade opportunity so follow must.

New BTC planWe lost an important support level of $100,000, as a result BTC is in a clear downtrend, now I thinkg it's going to grab all the liquidity below of $85,000 level, anyway, I think we are in the end of one of the biggest corrections because if we take a look at previous downfalls, BTC usually falls around 30-40% after new peaks, and the same situation is hapenning here again, moreover, on 1-week chart BTC always bouncs back from EMA-100 level which meant continuation of a bullish trend

BITCOIN correlation with sp500Bitcoin Analysis – Correlation With S&P 500 Strengthening
Bitcoin has shown a tight correlation with the S&P 500 over the past several weeks. Yesterday, following Nvidia’s strong earnings and the resulting surge in U.S. equity markets, BTC made a corrective move but formed a clear double-bottom pattern, signaling potential bullish momentum for today.
From a technical perspective, BTC is holding above short-term demand and showing early signs of a rebound. If momentum continues, price could easily climb back toward the 95,500 zone, which aligns with previous structure, liquidity pockets, and minor resistance.
On the fundamental side, Bitcoin remains supported by:
Increasing inflows into spot ETFs, showing growing institutional demand.
Reduced selling pressure from miners after recent difficulty adjustments.
Improving risk sentiment in global markets as U.S. equities push higher.
If this positive environment persists and BTC holds above its intraday support, a move toward 95,500 is highly probable.

Bitcoin Daily Analysis – November 20 | Two Clear ScenarioHey everyone! Hope you're having an amazing and profitable day! 🌟
Today is Thursday, 20 November, and as always, here’s your fresh Bitcoin analysis.
The Fear & Greed Index is at 15 — which means the market is deep in extreme fear. 😨
And as we know… extreme fear often creates big opportunities.
🔍 A Very Important Note Before We Begin
This latest rejection from the $88K level happened while Bitcoin dominance was rising —
meaning BTC led the move upward, not altcoins.
This detail matters a lot for today’s scenarios.
Now let’s break everything down 👇
🟥 Scenario A — Bullish Structure Building (Risky but High Potential)
Looking at the 4H timeframe, yesterday’s rejection was actually stronger than the previous one.
But here’s the interesting part:
The sellers’ attack was weaker
→ smaller candles
→ lower volume
The bullish engulfing candle we formed afterward was stronger AND higher volume than the last one.
So… is this enough to go LONG immediately?
👉 No. It’s not.
Because on the daily timeframe, sellers still have control,
and I need buyers to prove their strength one more time before entering.
✔️ What I need to see:
If Bitcoin creates a 1-hour higher low,
and then breaks the previous rejection high,
I will open a long position, even though it’s a bit risky.
Why?
Because this level has huge potential if buyers step in.
If we get that setup, I expect a reaction at higher resistance levels —
but I will try to hold the position as long as buyers stay in control.
❓ What if price pumps without building a clean structure?
No problem.
I already have a long position on ASTER,
and if another altcoin inside my strategy gives me an entry setup,
I’ll take that instead.
Still, I prefer to take one controlled long here,
even if I get stopped out — that’s part of the plan.
🟦 Scenario B — The Market Goes Sideways & Ranges
If Bitcoin decides to range in this area until the end of the week,
then two things are very likely to happen:
$90,500 will get tested
$93,500 will also get tested
And whichever level breaks after the range
will give us an excellent entry — long or short.
💥 What if a sharp drop happens?
If Bitcoin dumps sharply from here,
I won’t open any short on BTC itself.
Instead, I’ll look to short altcoins,
because they fall harder and faster than Bitcoin during panic.
And of course, I’ll keep risk small and stops even smaller.
🧠 Overall Market Approach
Right now, the market isn’t in a condition where I want to take big risks.
And that’s exactly what I recommend to you as well:
👉 Avoid emotional trades
👉 Respect your risk management
👉 Focus on survival, not perfection
Opportunities always come —
but only traders who stay in the market long enough can catch them.
Thank you so much for reading today’s analysis! 🙏
Wishing you a day full of profits, clarity, and blessings! 💛✨
Stay disciplined, stay patient, and stay sharp.
Good luck, traders! 🚀📊
BTCBitcoin has once again reached a new low and rebounded from there. The price is attempting to maintain the $90,000 level, which is a crucial point. The key resistance level to surpass is around the $95,000 area.

It Needs a Correction in 6MMy annotations are very simple, and they speak for themselves. The market is over-extended in 6M temporality and needs a correction, the first red candle in 6M in a long time is confirming this.

The Future of Global Trade in an AI-Driven Economy1. AI Will Redefine Supply Chains into Intelligent, Self-Optimizing Systems
Traditional supply chains rely on manual forecasting, physical documentation, and human-driven coordination. In contrast, AI-driven supply chains are forecast-based, automated, and self-correcting.
Key Transformations
Predictive demand forecasting
AI models analyze billions of data points—consumer behavior, climate patterns, geopolitical risks, and market trends—to predict demand more accurately than human experts.
Real-time supply chain visibility
AI-powered sensors, IoT devices, and satellite data will track shipments globally, allowing companies to respond instantly to disruptions such as natural disasters, port congestion, or political events.
Autonomous logistics
Self-driving trucks
AI-assisted cargo routing
Automated warehousing and robotic picking systems
These innovations will slash transportation costs, shorten delivery times, and reduce human errors.
Optimization of global trade routes
AI algorithms will determine the most cost-efficient and lowest-risk routes based on weather conditions, fuel prices, geopolitical risks, maritime traffic, and customs regulations.
The result is a global supply chain that behaves almost like a living organism—constantly learning, adapting, and optimizing itself.
2. AI Will Accelerate the Shift Toward Digitally Delivered Trade
Global trade traditionally revolved around physical goods such as oil, textiles, machinery, and electronics. However, AI is boosting the share of digital trade—software, cloud services, algorithms, AI models, digital IP, and data flows.
How AI Expands Digital Trade
AI models and algorithms become exportable products.
Businesses offer AI-as-a-service (AIaaS) across borders.
Data becomes a valuable traded commodity.
Virtual goods, digital design, and generative content enter global markets.
Cloud computing and remote AI processing remove the need for physical shipping.
This means global trade will increasingly rely on data flows instead of cargo flows, reducing logistical barriers and creating new global dependencies based on digital infrastructure rather than physical resources.
3. Countries Will Compete Not for Natural Resources, but for Data and AI Capabilities
Historically, global trade dominance depended on:
Oil reserves
Industrial capacity
Cheap labor
Military power
In an AI-driven economy, data, computing infrastructure, digital talent, and innovation ecosystems become the new sources of competitive advantage.
Winners in the AI Economy Will Be Countries That:
Possess large and clean datasets
Have advanced semiconductor manufacturing
Attract top AI talent
Provide strong digital infrastructure (5G/6G, cloud, quantum computing)
Maintain innovation-friendly regulatory environments
Build strong AI-driven industries like fintech, robotics, and biotech
This shift could widen the gap between AI leaders (such as the US, China, South Korea, Japan, and parts of Europe) and developing countries lacking digital readiness. However, AI also creates new opportunities for emerging economies to leapfrog by integrating AI into agriculture, manufacturing, logistics, and services.
4. AI Will Transform Trade Finance and Cross-Border Transactions
The global trade finance system is traditionally slow, paperwork-heavy, and vulnerable to fraud. AI and digital technologies such as blockchain will modernize this ecosystem.
Transformations in Trade Finance
Automated verification of invoices and shipping documents
AI can verify authenticity and detect irregularities within seconds.
Fraud detection and risk assessment
Machine learning models analyze transaction data to prevent financial crimes and reduce credit risk.
Smart contracts
Trade agreements can automatically execute when conditions are met, improving trust between international partners.
Faster cross-border payments
AI enhances digital payment systems such as UPI cross-border, CBDCs (Central Bank Digital Currencies), and blockchain-based remittances.
The result is a frictionless, error-free, and transparent global financial environment.
5. AI-Driven Manufacturing Will Reshape Global Trade Patterns
As AI and automation become mainstream, manufacturing will be less dependent on low-cost labor. This has major implications for global trade.
Key Impacts
Reshoring of manufacturing
Developed economies may bring back factories because AI-enabled robots can produce goods cheaply without relying on offshore labor.
Customized production
AI and 3D printing allow companies to manufacture goods closer to consumers, reducing the need for long-distance shipping.
Supply chain diversification
Firms will use AI to identify and reduce overdependence on a single country, potentially reducing China’s dominance in some areas.
Rise of “smart factories”
Countries like India, Vietnam, Mexico, and Indonesia could emerge as global manufacturing hubs if they adopt AI-driven robotics and automation rapidly.
Thus, trade flows will shift toward nations that combine digital capabilities with industrial strengths.
6. AI Will Drive New Trade Policies and Digital Regulations
Governments globally are drafting policies around AI governance, data privacy, digital taxation, and ethical AI. These regulations will significantly influence global trade.
Key Policy Areas
Data sovereignty (who owns data?)
Cross-border data flow restrictions
AI safety and ethical standards
Digital services taxes
AI intellectual property rights
Fair access to AI infrastructure
Countries adopting compatible digital regulations will integrate more deeply into global trade networks, while fragmented regulations may create digital barriers.
7. Risks and Challenges in AI-Driven Global Trade
While AI promises huge benefits, it also introduces several challenges.
1. Digital inequality
Countries that lack AI infrastructure may fall behind, widening global inequality.
2. Job displacement
Automation may reduce certain traditional jobs across manufacturing, logistics, and administration.
3. Geopolitical tensions
AI, data, and chips are becoming the new battlegrounds for global power competition.
4. Cybersecurity threats
AI-enhanced cyberattacks could disrupt trade, steal intellectual property, or target critical infrastructure.
5. Dependence on AI systems
Over-reliance on algorithms may lead to systemic failures if AI models malfunction or are manipulated.
Managing these risks is crucial for achieving sustainable, inclusive AI-driven economic growth.
Conclusion: The AI-Driven Future of Global Trade
The future of global trade in an AI-driven economy will be characterized by speed, automation, intelligence, and connectivity. Goods will move more efficiently, digital products will dominate international commerce, and countries with advanced AI ecosystems will shape global economic power.
AI-enabled supply chains, predictive analytics, autonomous logistics, and digitized trade finance will make global trade more seamless and resilient. However, the benefits will not be evenly distributed unless nations invest in digital infrastructure, skills development, ethical AI practices, and international regulatory coordination.
The Global Trade Market Is ShiftingDynamics, Drivers, and the Future of International Commerce
The global trade market is undergoing one of the most significant transitions in modern economic history. For decades, globalisation shaped the world’s economic landscape—reducing trade barriers, integrating economies, and enabling companies to expand across borders with unprecedented ease. However, the world is now witnessing a shift marked by geopolitical tensions, supply chain disruptions, rising protectionism, technological transformation, and new regional economic alliances. This shift does not signal the end of global trade; rather, it marks the evolution of a more complex, diversified, and strategically fragmented global trade system.
This transformation is influencing industries, governments, businesses, investors, and consumers, creating both risks and opportunities. Understanding these shifts is crucial for anyone engaged in global business, financial markets, policymaking, or strategic planning.
1. From Hyper-Globalisation to Strategic Globalisation
Between the 1990s and early 2010s, globalisation accelerated rapidly. Countries pursued free trade agreements, multinational corporations expanded production worldwide, and emerging economies—especially China—became major manufacturing hubs.
However, the model of “hyper-globalisation” began to slow after 2015 due to:
geopolitical conflicts
rising economic nationalism
trade wars (notably U.S.–China)
global pandemic disruptions
technological competition
As a result, economies are shifting from traditional globalisation to strategic globalisation—a system where trade decisions focus on resilience, security, and long-term stability rather than just cost efficiencies.
2. Geopolitical Tensions and the Rise of Fragmented Trade Blocs
One of the most significant forces shaping global trade is geopolitics. Rivalries between major powers—especially the U.S., China, and the EU—are influencing global supply chains and trade flows.
Key geopolitical drivers:
U.S.–China strategic decoupling
Both countries are reducing their dependence on each other in technology, manufacturing, and investment sectors.
Russia–Ukraine conflict
Resulted in major disruptions in energy, grains, and fertilizers, forcing Europe and Asia to diversify suppliers.
Middle East tensions
Affect global oil trade routes and shipping costs.
New alliances and mini-lateral agreements
Nations are forming smaller, strategic partnerships rather than large global agreements.
This geopolitical fragmentation is creating regionalization, where countries prefer trade within trusted or nearby partners.
3. The Reconfiguration of Global Supply Chains
The pandemic revealed the vulnerability of long, complex supply chains. Lockdowns, transport delays, and shortages of critical materials pushed companies to rethink their strategies.
New supply chain trends include:
Near-shoring – Moving production closer to end markets (e.g., U.S. companies shifting from China to Mexico).
Friend-shoring – Outsourcing to politically aligned nations (e.g., India gaining attention due to its stable relations with the West).
China+1 strategy – Businesses diversifying manufacturing to India, Vietnam, Thailand, and Indonesia.
Automation and digital supply chains – Enhanced efficiency using AI, robotics, and data.
This restructuring aims to build resilience, reduce risk, and increase production agility.
4. Technological Power Shifts in Global Trade
Technology has always influenced trade, but today its role is transformational. Countries that dominate critical technologies gain economic and strategic advantage.
Key technological drivers:
Artificial Intelligence (AI)
AI-driven optimisation in logistics, trade forecasting, port automation, and smart manufacturing is reshaping global competitiveness.
Semiconductor industry shifts
To reduce dependency on Asia, the U.S. and Europe are heavily investing in local chip production.
Digital trade and e-commerce
Cross-border digital services trade is growing faster than goods trade.
Blockchain and fintech
Transforming trade finance, supply chain verification, and international payments.
These technologies change not only how goods move but how value is created in the global economy.
5. Growth of Regional Economic Powerhouses
Regional groups are becoming stronger as economies diversify trade partners and reduce reliance on global structures.
Major regional blocs gaining momentum:
RCEP (Regional Comprehensive Economic Partnership)
Now the world’s largest trade bloc, covering East Asia and the Pacific.
EU integration strengthening after supply chain disruptions
USMCA replacing NAFTA, boosting North American regional manufacturing.
African Continental Free Trade Area (AfCFTA)
Creating a unified African market.
These regional arrangements highlight how trade is shifting from global dependence to regional consolidation.
6. Sustainable Trade and Green Globalisation
Climate change regulations are influencing global trade structures. Many economies are adapting by adopting sustainability-focused strategies.
Examples include:
Carbon border taxes (EU’s CBAM) increasing trade costs for carbon-intensive imports.
Demand for clean energy equipment (solar panels, lithium batteries, green hydrogen) reshaping global export flows.
Greener logistics such as electric freight vehicles, sustainable shipping fuels, and greener ports.
Countries that lead in green technologies are becoming new trade leaders.
7. Impact on Emerging Markets and Developing Economies
The shift in global trade is especially important for emerging markets. Nations like India, Vietnam, Indonesia, and Mexico are benefiting from diversification away from China.
Advantages:
Increased FDI in manufacturing
Job creation
Integration into global supply chains
Expansion in exports of electronics, pharmaceuticals, textiles, and automobiles
However, other developing economies may face challenges due to stricter sustainability standards, rising protectionism, and limited access to advanced technologies.
8. Implications for Businesses and Investors
The shifting trade landscape affects corporate strategy, market expansion, production costs, and investment decisions.
Key implications:
Companies must diversify supply chains to reduce geopolitical risks.
Investors are shifting capital into markets benefiting from trade realignments.
Trade-dependent industries like automotive, electronics, chemicals, and energy are re-evaluating global operations.
Currency volatility and commodity price fluctuations will influence global trade profitability.
Businesses that adapt to these changes will gain competitive advantage.
9. The Future of the Global Trade Market
The global trade market is not shrinking—it is being reshaped. The future will involve:
More regional trade partnerships
Strategic, secure, and technology-driven supply chains
Increased role of AI and automation
Competition in green and digital technologies
More balanced trade flows across Asia, Europe, and the Americas
A shift toward economic security over low cost
Instead of a single global market led by one dominant nation, the future may feature multiple global trade hubs, interconnected but competitive.
Conclusion
The shifting global trade market reflects a world adjusting to new realities—geopolitical tensions, technological advances, environmental demands, and the need for resilient supply chains. This transition marks the evolution from old-style globalisation to a smarter, more secure, and strategically diversified trading system. Countries and businesses that adapt proactively to this new trade order will be best positioned to benefit from future opportunities.

Bitcoin Downtrend UpdateAlright friends, Bitcoin has confirmed its intention to move toward 86,000 and lower.
My previous forecast with the invalidation zone at 96,600 is still valid, but I decided to make a fresh post.
At the moment, my new invalidation level is 96,012.5.
From a broader perspective, I’m still expecting Bitcoin to reach 83,000.
But as I mentioned earlier, we first need to see 86,000 tested — because once that level is hit, Bitcoin may go into a correction before continuing toward 83,000 and below.
Yes-yes, I do expect it even lower, but more on that in the upcoming updates.
Make sure to follow so you don’t miss them

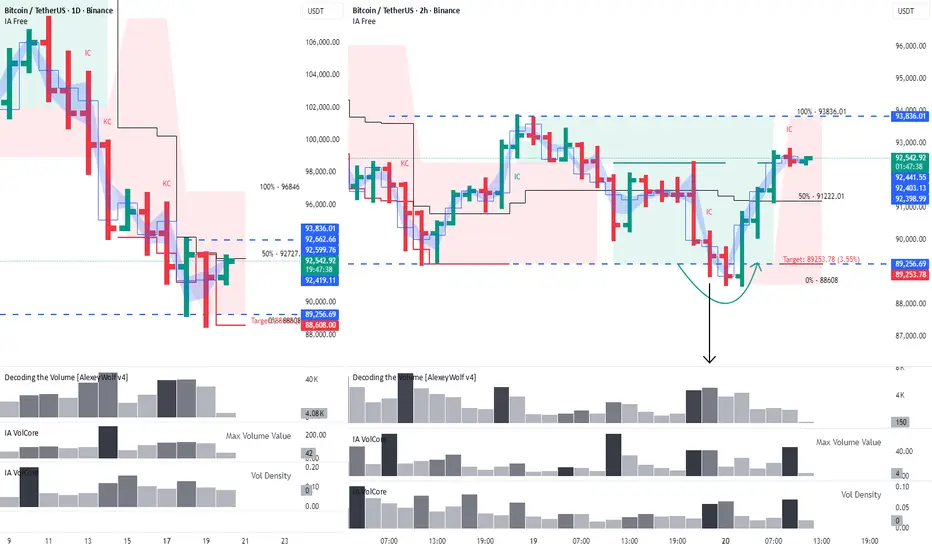
BTC: first signs of a slow reversal?The 89,256 level has slowed down Bitcoin’s decline.
Hello, traders and investors!
This analysis is based on the Initiative Analysis (IA) method.
First, price interacted with the level through a buyer candle with strong volume, and then again through a seller candle with declining volume on the daily timeframe.
On the 2-hour timeframe, the second interaction with this level turned out to be a manipulation of the lower boundary of the range that has formed on 2H.
The target of that manipulation has already been reached, but we may still see price move toward 93,836.
Reaching this level would be a good signal that at least a temporary pause in the downtrend is forming — and possibly the early stage of a reversal, although likely a slow one.
Wishing you profitable trades!
Prepare BTC Long
Btc broke important Daily trendline which means market turns into bearish trend
but swing HL still remain and i think this is last chance for long
im waiting sell volume decrease and at least dogi or engulfing candle show up in support zone
Dont make mistake go under 4H timeframe, just stay watch at least daily or higher tf candle

Bitcoin Breakdown or Hidden Re-Accumulation? BIG MOVE Loading…@MagicPoopCannon Vibes
“Bitcoin Breakdown or Hidden Re-Accumulation? BIG MOVE Loading… ⚠️
Bitcoin just tapped a critical structural level inside the macro channel — and this chart shows exactly where the real liquidity vacuum sits.
Price failed to reclaim the upper regression band and is now sliding toward the mid-channel + major demand zones.
My mapped levels:
📌 85,019 → First liquidity pocket
📌 78,082 → High-probability reaction zone
📌 69,458 → Final sweep before a potential mega-reversal
A break below the key mid-channel zone could trigger a full liquidity hunt before any strong bullish continuation.
But if BTC flips the 104–105K region with conviction, we may see the type of explosive breakout that legends like @TradingShot, @CryptoBullet, and @MagicPoopCannon often highlight.
⚠️ This setup is high-confluence, high-volatility, and high-reward.
If this plays out, it will be remembered.
Drop your thoughts below — do you expect the sweep, or the breakout?
👇🔥 Let’s make this chart viral.

BTC – UTAD locked in at $126K → short the rips : Revised BTC – UTAD locked in at $126K → short the rips 🎯
Context
Wyckoff: BC → AR → ST → UT → UTAD @ $126K. Failure to accept above range = LPSY developing.
Auction/SMC: Rejected VAH $119.6K/bear OB $118.7–$122.0K. Liquidity pools stacked below $111.8K → $104K.
TA/Mean-reversion: 2D H&S + lower-highs; momentum rolling over; late Stage-2 extension reverting toward value.
Trade Plan (short bias)
Primary entry zone: $119.6K–$121.5K (sell rallies into UTAD supply).
Confirmation add: Lose/close < $118.7K (back inside value).
Invalidation: Daily acceptance > $121.5K; hard stop > $123K.
Targets – ladder out
$114.1K–$111.8K – first shelf / mid.
$108.9K–$107.2K – neckline/ICE.
$104.0K – composite POC magnet.
$100K – psych / VA-Low.
$95.1K → $90K – weekly support if momentum persists.
🔻 Extended path: $86–$82K zone → $73K final (weekly demand cluster highlighted on your 2D chart).
Risk & Management
Size in tranches; trail above lower-highs. If price reclaims $121.5K with volume, step aside—UTAD failure scenario.
One-liner:
UTAD at $126K + rejection under $120K hands control to sellers. I’m selling rips into 120–121.5K, adding on <118.7K, and scaling profits: 114K → 109K → 104K → 100K → 95/90K, with an extended glidepath to 86–82K and potentially 73K if the weekly breakdown accelerates.

BTC Long if this happenBTC breaked trendline and every buyer is here to trade
if smart money want to Buy btc this trades should SL
then whales will enter

BTC Most Honest Analysis You Will Ever Find - PS: Sorry BullsFeel free to argue against. Fire your best facts. I would love to hear them all.

BTC EOY ExpectationsFollowing my previous analyses, my first long attempt in the marked areas was invalidated as BTC pushed slightly lower. Now the price is in a zone where almost any scenario is possible heading into the end of the year.
My main thesis is that, since BTC failed to hold the Yearly Open, there is a strong possibility that the yearly candle could close as a doji/ bullish doji yearly close. This would accurately reflect the indecision and volatility that defined 2025. Under this narrative, a period of chop and range into late December would make sense.
On the monthly timeframe the candle has not closed yet and BTC still has a chance to respect the monthly trendline. I took a long position at the January Low because it is a historically important support and resistance level. My stop allows enough room for consolidation in a short term expected bounce and the initial reaction has shown healthy signs of demand.
My first upside target is current week Monday’s High. A more ambitious target is the Daily 200 EMA. BTC may fluctuate and consolidate before moving higher, although a strong reclaim in early December could shift the narrative in a more bullish direction.
To the downside the key levels remain the Weekly 100 EMA and the January Low. Overall I expect chop within the 90K to 110K range as the most likely environment.
There is also a bearish crossover between the Daily 50 EMA and the Daily 200 EMA. The last time this happened was in September 2023, right before a major bullish breakout. It is not a perfect comparison because the structure at that time was already showing clear consolidation, but it is still a useful observation for context.

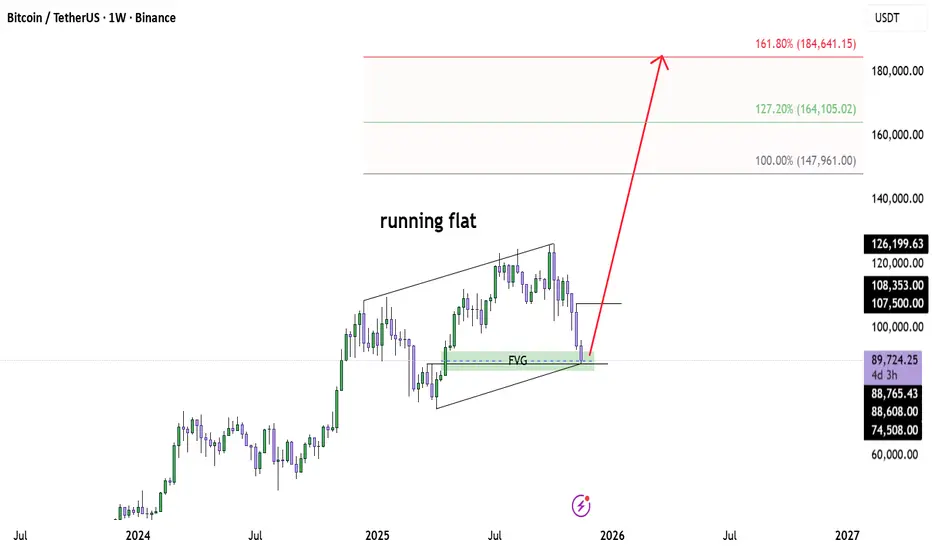
Bitcoin Macro Support Hit — Bull Cycle Ready to ExtendBINANCE:BTCUSD BINANCE:BTCUSDT
Bitcoin just tapped the weekly FVG + channel support, completing what looks like a running flat correction.
This zone has acted as a major demand area, and price reacted exactly where a higher-timeframe Wave 2 should finalise.
As long as BTC holds above this green support block, the bullish macro structure stays intact.
Upside targets for the next impulsive leg are:
147,961 (1.0 extension)
164,105 (1.27 extension)
184,641 (1.618 extension)
If this running flat is confirmed, Bitcoin may be entering a large Wave 3 — historically the most explosive phase.
Still watching weekly close for validation, but momentum is shifting.
⚠️ Disclaimer
This analysis reflects my personal view based on market structure and Elliott Wave principles.
It is not financial advice.
Always do your own research and manage your risk — the market doesn’t forgive careless entries.
I will buy BTC nowBitcoin is currently testing a major weekly support zone which forms the first strong buy area (Buy 1).
If this support is broken, a second strong buy zone (Buy 2).
A lower-probability scenario is a deeper correction toward (Buy 3), which is a major long-term support.
Summary:
Bitcoin is currently in a strong buying zone on weekly support, with medium-term upside targets extending toward 150,000$ and possibly 200,000$ and more to 1M (Why not)
