$BTC Bullish Consolidation or Setup for Breakout?BINANCE:BTCUSDT CRYPTOCAP:BTC Bullish Consolidation or Setup for Breakout?
Current trend: BTC is in a tight bullish consolidation after a sharp pullback, holding above the key 101.5K support zone like a champ 🛡️. It's respecting that purple support line beautifully, with buyers stepping in on dips—classic accumulation vibes.
Hold support? High probability yes, as volume spikes on greens show conviction. Breakout above 107.5K resistance? Imminent if we close above it this session 🚀—could ignite a quick 3-5% pump.
Dip risk? Mild, maybe to 100K if macro FUD hits, but oversold RSI (around 35) screams bounce potential.
Target: Short-term 110K on breakout; longer 115K if momentum builds.
Indicators I'm eyeing: RSI for oversold pops, MACD histogram turning positive, and 50 EMA as dynamic support 📊.
#BTCBreakout #CryptoTrading #AltcoinPioneers
Trade ideas

Bitcoin - New falling wedge! (no one talks about, must see)Bitcoin is forming a brand new falling wedge pattern no one really talks about! This falling wedge pattern is not complete, and it will take another week to see the whole pattern, but what we see now is the first skeleton of the pattern. Of course this is great because we can enter a short position on futures and speculate on the price decrease!
What is very interesting is that inside the falling wedge pattern we have a symmetrical triangle. This triangle recently broke down, and we saw a massive drop, but now the price is recovering, and soon we may see a retest of the triangle. That's also a great opportunity to short Bitcoin!
Currently Bitcoin is going up, but to me this is just a temporary pullback. I am pretty bearish, and I think we are going to go down! There is still an untested 2024-2025 trendline, so I expect Bitcoin to hit this trendline this or next week. I think this could be a good idea to open a long position if this happens.
What is the plan for November? I think Bitcoin is bearish, and we are going to hit 98k later this month. A lot of people may start to think that the bottom is in and that Bitcoin will go to a new all-time high; I disagree with this idea. I think there is more downside for Bitcoin.
Write a comment with your altcoin + hit the like button, and I will make an analysis for you in response. Trading is not hard if you have a good coach! This is not a trade setup, as there is no stop-loss or profit target. I share my trades privately. Thank you, and I wish you successful trades!

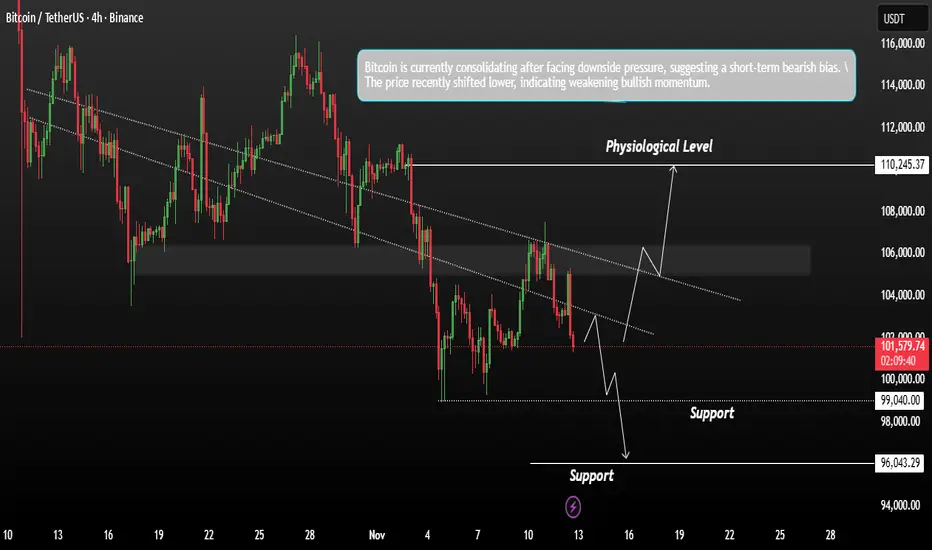
Bitcoin Price reacting scenario setup what should next ?Bitcoin is currently consolidating after facing downside pressure, suggesting a short-term bearish bias. The price recently shifted lower, indicating weakening bullish momentum.
From a macro perspective, U.S. stock markets surged on Wednesday as investors anticipated updates from the U.S. House and the ongoing government shutdown discussions. In contrast, Bitcoin fell from an intraday high near 105,000 to a weekly low around 101,000, marking a 3.4% decline.
If bulls manage to regain control and push the price above the current consolidation zone, a breakout could occur a sustained move above the new trendline may lead BTC toward 107,000–110,000 in the near term.
If the price continues to show weakness and fails to hold current support levels, a breakdown could occur In that case, BTC may revisit the 99,000– / 96,000 range as the next short-term downside targets.
You may find more details in the chart,
Trade wisely best of Luck.
Ps; Support with like and comments for better analysis Thanks for Supporting.
BTC Playbook: Buy Floors, Fade 104k Until Confirmed__________________________________________________________________________________
Market Overview
__________________________________________________________________________________
Bitcoin faded from 104k and is cycling back into layered demand near 100.4k, with higher timeframes still constructive while intraday pressure and a risk‑off overlay dominate.
Momentum: Range with downside skew after a sharp 104k rejection and tests of 100,409 and the 99k pocket.
Key levels:
- Resistances (HTF): 102,900–103,300; 103,900–104,050; 105,600–106,000
- Supports (HTF): 100,409; 99,490; 98,760–98,944
Volumes: Very high on intraday (30m–2H); normal on 1D.
Multi-timeframe signals: 1D/12H Up; 6H/4H/2H/1H Down. HTF structure stays constructive, but LTF pressure and the risk‑off overlay cap bounces into 104k–106k.
Harvest zones: 100,400 (Cluster A) / 98,800–98,900 (Cluster B) — ideal dip‑buying areas for inverse pyramiding with confirmation.
Risk On / Risk Off Indicator context: Neutral sell bias; it currently contradicts the HTF Up filter, so treat bounces as tactical until it flips.
__________________________________________________________________________________
Trading Playbook
__________________________________________________________________________________
The dominant posture is tactical: buy confirmed dips into floors and fade weak tests of overhead supply while the macro overlay stays risk‑off.
Global bias: Cautious long into floors while HTF trend is Up; invalidate the dip‑buy thesis on sustained closes below 98,760.
Opportunities:
- Buy: Reactive long at 100,409 or 99,490–98,760/98,944 on a ≥2H bullish close; targets 102,000 then 104,045; risk below the engaged floor.
- Breakout: Acceptance above 104,045 with rising volume → add toward 105,600–106,000.
- Tactical sell: Fade 103,900–104,050 or 105,600–106,000 if rejected and Risk On / Risk Off stays neutral‑sell.
Risk zones / invalidations: Loss and acceptance below 99,490 opens 98,760; daily acceptance below 98,760 invalidates dip‑buying until reclaimed. Acceptance above 106,000 invalidates shorts.
Macro catalysts (Twitter, Perplexity, news): Fed liquidity rhetoric turning supportive; CPI/UST auctions can swing risk; geopolitical overhang keeps the risk tone fragile. Strong daily ETF inflows recently help spot demand but need persistence.
Harvest Plan (Inverse Pyramid):
- Palier 1 (12.5%): 100,400 (Cluster A) + reversal ≥2H → entry
- Palier 2 (+12.5%): 96,400–94,400 (-4/-6% below Palier 1) → reinforcement
- TP: 50% at +12–18% from PMP → recycle cash
- Runner: hold if break & hold first R HTF (103,900–104,050)
- Invalidation: < HTF Pivot Low 99,800 or 96h no momentum
- Hedge (1x): Short first R HTF on rejection + bearish trend → neutralize below R
__________________________________________________________________________________
Multi-Timeframe Insights
__________________________________________________________________________________
Overall, HTF remains constructive while LTFs are in a corrective downswing pressing demand steps.
1D/12H: Uptrend filter intact; price rotating back into 100,409 and the 99k ladder; acceptance back above 104,045 would re‑open 105,600–106,000.
6H/4H: Down within HTF Up; clean lower‑highs from 105k with buyers defending 99,490 and the 98,760–98,944 cluster; look for reversal signals there.
2H/1H/30m/15m: Down with very high sell volume; squeezes likely if 100,409 is reclaimed swiftly; failure risks a stop‑run into 99,490 → 98,8k.
Major confluence: Tight demand at 98,760–98,944 aligns with aggregate value; 100,409 is the line‑in‑the‑sand; 104,045 is the primary trigger above.
__________________________________________________________________________________
Macro & On-Chain Drivers
__________________________________________________________________________________
Macro liquidity tone is turning supportive, but near‑term event risk and a risk‑off equity regime keep the overlay defensive.
Macro events: Fed officials flagged reserves nearing “ample” and a technical easing bias; CPI and UST auctions can jolt risk; geopolitics maintains a risk premium.
Bitcoin analysis: Strongest daily US spot ETF net inflows in a month aided spot demand, while a derivatives long flush reset froth; 104k is the overhead decision zone; 100,409 and 99k are key defenses.
On-chain data: Short‑Term Holder stress and seller‑exhaustion reads favor reflex bounces near 100k; structurally, a durable reclaim above prior highs remains unconfirmed.
Expected impact: If ETF flows persist and CPI doesn’t shock, acceptance above 104,045 tilts the path toward 105,600–106,000; if 100,409 fails, a run into 99,490 → 98,8k is likely before stronger dip‑bids.
__________________________________________________________________________________
Key Takeaways
__________________________________________________________________________________
BTC is rotating within a range under 104k, pressing two‑step demand around 100.4k and 99k.
- Trend: Neutral with downside pressure while Risk On / Risk Off stays neutral‑sell.
- Setup: Buy confirmed dips at 100,409 and 99,490–98,760/98,944; add on 104,045 acceptance.
- Macro: Fed liquidity tone helps, but CPI and geopolitics can flip the tape quickly.
Stay patient, define risk at the floors, and let the market hand you the next move rather than forcing one.

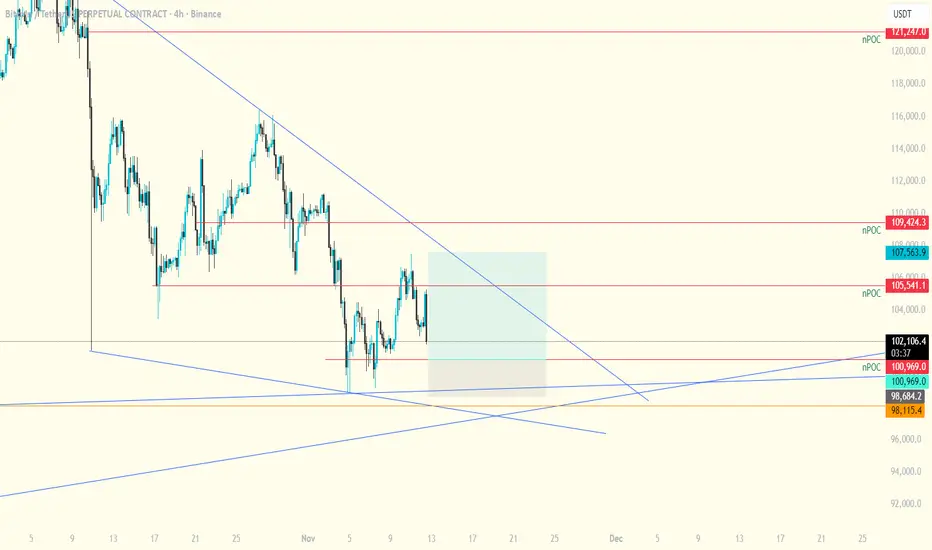
BTCUSDT.P - November 11, 2025BTCUSDT.P is showing potential for a short-term bearish continuation after breaking below the ascending trendline support near $105,300. The pair has lost upward momentum, indicating potential downside movement toward the $103,530 partial profit zone and the $102,039 profit level. A stop level is positioned around $107,473–$107,714, marking the invalidation area for this bearish setup.
Risk Assessment: Moderate — The breakdown from trendline support favors further downside, but a sustained recovery above $105,600–$106,000 could signal a failed breakdown and shift sentiment back toward bullish consolidation.


Bitcoin long from 101k Npoc is located at that region.
I think that is a great level for a bounce up.
let this fomc conference finish , and things will start setting up.
Bitcoin (BTCUSDT) Completing Corrective Wave C Bitcoin has completed a 5-wave impulse to the upside and recently finished an A–B–C corrective pattern. The Wave (C) has tapped into a key demand zone (highlighted in purple) that aligns with prior Wave 4 support and an inducement zone — a classic liquidity grab setup before a bullish reversal.
The structure suggests that BTC has completed its correction and is preparing for a long-term bullish continuation targeting new highs. The breakout of the descending channel confirms renewed buyer strength.
Long-Term Buy Opportunity (Bullish Reversal Setup)
Entry Zone: $101,500 – $103,000
Buy Confirmation: Break and retest of $105,000 zone (structure shift)
Target (TP1): $115,000
Target (TP2): $120,000
Target (TP3): $126,000 (major resistance / completion of next bullish leg)
Stop Loss: $97,000
Reasoning:
✅ Elliott Wave Context: Completion of corrective Wave (C) from the A–B–C structure signals potential trend continuation.
✅ Structure Break: Bullish break of structure (BOS) after descending channel breakout.
✅ Liquidity Sweep: Price swept liquidity below prior lows (inducement zone), indicating institutional accumulation.
✅ Demand Zone Confluence: Strong historical support from the previous Wave 4 base area.

BTCUSDT.P : positionHello friends
Given the decline we had, the price has now made a good floor and is supported, but it is still early for confirmation. We must let the resistance break and form a higher ceiling for us.
Everything is clear and transparent. If you have any questions, ask.
Don't forget risk and capital management.
*Trade safely with us*

TradeCityPro | Bitcoin Daily Analysis #218👋 Welcome to TradeCity Pro!
Let’s dive into the Bitcoin analysis. Today, the market has started another upward move.
⏱ 1-Hour Timeframe
Yesterday, after breaking the support zone, Bitcoin made a downward move to the 10,2489 level. Now, it has started another upward movement.
The price is currently facing resistance at the 10,5020 level, and as you can see, it has experienced a strong rejection from this level, which has caused the bullish momentum to fade from the market.
This rejection at the 10,5020 level makes it a very important zone. If this level is broken, it will act as a strong trigger for a long position.
The first trigger for a long position:
The first trigger for a long position is the 10,5020 level. The next main trigger, which is our primary long trigger, is at 10,6644.
For a short position:
If the downward momentum continues, we can open a short position when the 10,2489 level is broken.
However, as long as the price is ranging between 10,2489 and 10,5020, I prefer not to open any new positions.

BITCOIN TO $130,000 - $140,000Hello! It's me again!
My friends, it seems that BTC's price action is clearly indicating its trend and direction. Of the last five candles on the weekly chart, four have shown a very clear indication: there are buyers on the downside, it has remained above the 55-week moving average, and we've seen very strong support around $103,000.
It's also true that the uptrend on the weekly chart is already quite worn out. It has been quite long and has remained solid until now; however, this could be the bullish move that ends the trend.
At the moment, the technical analysis is simple and very clear: we are within the lower range of an upward move (I bought at $109,900 six weeks ago and I plan to hold since the movement is clear).
In conclusion, Bitcoin will be looking for the $130,000 range and, at most, $140,000. The final upward move is about to begin.
See you later! And remember, this isn't advice, it's just an opinion.

BTC/USDT Analysis. Probability of a New Growth Phase
Hello everyone! This is CryptoRobotics trader-analyst, and here’s your daily analysis.
Yesterday, Bitcoin fell below the previously mentioned delta anomaly zone around ~$104,500. At the local support near ~$103,300, the price paused, consolidated briefly, and bounced upward. Yesterday’s anomaly failed to produce a strong pivot, indicating seller weakness.
Today, the same anomaly zone was retested, but no selling continuation followed.
Based on current volume distribution and delta, long positions have greater potential. We’re watching for buying opportunities from the $104,700–$104,100 range, which now acts as a mirror support zone.
If BTC breaks through the $105,800–$106,600 resistance area, the next upside target lies near $110,000.
Buy zones:
$104,700–$104,100 (mirror zone)
~$103,300 (accumulated volumes)
$102,000–$100,000 (volume anomalies)
$97,000–$93,000 (volume cluster)
Sell zones:
$109,500–$110,700 (accumulated volumes)
$112,400–$113,300 (accumulated volumes)
$114,700–$115,700 (accumulated volumes)
$120,900–$124,000 (high-volume zone)
This publication is not financial advice.

$BTC - Market Update BINANCE:BTCUSDT | 8h
Key Levels:
local support: 102k
local resistance: 107k
After briefly dipping to $102k, Bitcoin rebounded toward $105k as U.S. shutdown concerns eased and risk appetite improved. However, if price forms another lower high and stalls again below the 107k resistance, momentum could quickly fade once more.
Holding 102k would be the first real sign of bulls slowly reclaiming control — but a clean break below that key support would likely open the door for another leg down toward the 94–90k zone.

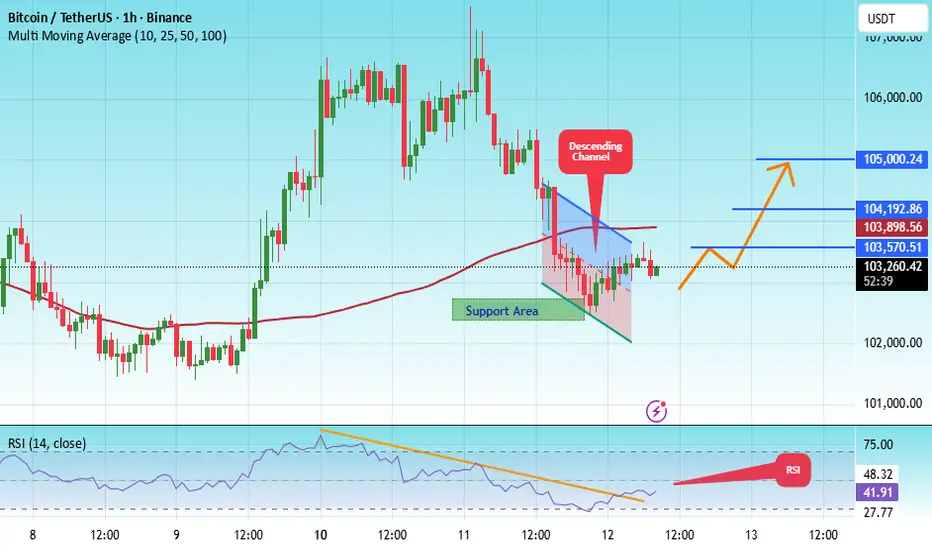
#BTC/USDT can give massive rally but breakout needed#BTC
The price is moving within an ascending channel on the 1-hour timeframe and is adhering to it well. It is poised to break out strongly and retest the channel.
We have a downtrend line on the RSI indicator that is about to break and retest, which supports the upward move.
There is a key support zone in green at 102474, representing a strong support point.
We have a trend to stabilize above the 100-period moving average.
Entry price: 103120
First target: 103570
Second target: 104190
Third target: 105000
Don't forget a simple money management rule:
Place your stop-loss order below the support zone in green.
Once the first target is reached, save some money and then change your stop-loss order to an entry order.
For any questions, please leave a comment.
Thank you.
BTC MARKET UPDATEThe bears couldn't push the price below 16800 Support. The price bounced from the 16800 support due to the massive BUY ORDER BLOCK and moved above the 17000 key level. If we notice the daily timeframe then the price is under the consolidation box for a long time, any movement outside this box with a strong confirmation will be massive (whether upside or downside) Trade Carefully and Stay Tuned!

Bitcoin Price Hits Historical Recovery BarrierBitcoin’s price is currently at $103,922, struggling to overcome the downtrend active for nearly two and a half weeks. The cryptocurrency has failed twice to breach this resistance, reinforcing the strength of bearish market sentiment.
At present, Bitcoin trades below $105,000 but remains above the $101,477 support zone. This area is likely to form a consolidation base amid persistent volatility and cautious investor behavior.
If bullish momentum strengthens, Bitcoin could break past $105,000 and challenge resistance near $108,000. Successfully flipping this level would mark the first significant recovery since October, signaling renewed optimism across the broader crypto market.

BTCUSDT Chart Analysis.
BTC has bounced sharply off the green demand zone near $100,000, a historic level for bullish reversals.
Price action shows consolidation and then recovery, similar to previous cycle bottoms, with a projected move toward resistance at $123,000–$124,700 if momentum continues.
The current structure favors a bullish continuation, but strong confirmation above recent highs is needed for further upside.
DYOR | NFA

$BTC performing bullish falling wedge** CRYPTOCAP:BTC performing bullish falling wedge**
`A bullish falling wedge is a chart pattern in technical analysis that typically signals a potential upward trend reversal or a continuation of an uptrend after a period of consolidation. It is considered a reliable bullish signal.`
\

BTC market snapshotBTC is forming a flag — a trend continuation pattern.
For the uptrend to resume, price needs to break above 108K, ideally above 112K.
Everything below these levels still fits short scenarios for me.
The monthly timeframe remains bearish.
📘 Flag Pattern Rules
1️⃣ Impulse before the flag (flagpole)
– Strong directional move with rising volume.
– At least several large candles in a row.
2️⃣ Correction (the flag itself)
– A small downward-sloping channel or rectangle against the main trend.
– Volatility and volume decrease.
3️⃣ Completion: breakout of the flag boundary
– Price moves beyond the channel in the direction of the initial trend.
– Breakout should be accompanied by increased volume.
4️⃣ Confirmation: retest or consolidation beyond the flag
– After the breakout, price holds above (for bullish) or below (for bearish) the flag line.
5️⃣ Target = length of the flagpole projected from the breakout point
– TP ≈ height of the impulse before the correction.

The Power of One Setup: Variety Kills ConsistencyMost traders chase new strategies, indicators, and secret signals. Progress rarely comes from adding more. It comes from mastering one thing deeply.
The fastest path to consistency is one setup traded a thousand times, until execution becomes automatic.
Every setup has a rhythm. Market conditions, timing, management. When you rotate through styles, you reset the learning curve repeatedly.
Specialization compresses uncertainty. You see the same context, the same triggers, the same mistakes, which tightens execution and accelerates feedback.
Switching setups leads to inconsistent entries, inconsistent risk, and mixed data. You cannot tell what actually works because the sample is polluted.
Professionals remove variables. They keep the market changing while the method stays constant.
Turn the setup into a rulebook.
• Market conditions: trend, range, volatility threshold, session.
• Structure: levels, pattern shape, invalidation logic.
• Entry: trigger candle, confirmation, timing window.
• Risk: stop location, size per trade, max daily loss.
• Management: partials, move to break even, trail or fixed target.
Mastery does not come from more information. It comes from repetition and refinement.
You do not need more strategies. You need fewer distractions.


TIME TO LONG BITCOIN (READ BELOW) Hey traders!
Here again. Since my last analysis a lot of things happened in $BTC. I've been shorting Bitcoin since 110 - 115K as you saw on my last analysis and now I think it's time to shift to a more bullish idea.
The last tho months were tricky. USA shutdown, liquidity contraction.. all the indicators led me to the bearish way. I'm not gonna lie, I thought all those liquidity tensions could blow up the entire markets on a mid term ( 1 - 5 months).
However, since the government is about to reopen again ( liquidity incoming) and the REPO MARKET seems to be healed from those FED massive injections, I decided to take the risk and try to profit from a bullish momentum.
What am I expecting?
One of my first targets are 110K on short term ( incoming days). Then I will close 10 - 20 % of my longs. After that, if martkets allows, another 30% will be closed above 116k level. The rest... ATH?
1st target - > 110K
2nd - > 116K
3rd -> ATH
Don't overtrade and staf saye. Momentum could shift anytime soon.

