Wyckoff ReaccumulationCurrent range looks like another reaccumulation range. Spring has just occurred and looking for a move back and then above the top of the range.
Bearish if we breakout then retrace forming an upthrust after distribution (UTAD).
Trade ideas

$BTC (DAILY): DEAD CAT BOUNCE up to $117k next in line?CRYPTOCAP:BTC has DEFENDED the key 200 MA so technically, it is STILL in a BULL MARKET.
#BTC did, however, put in a LOWER LOW on yesterday's DAILY candle close, so no LONGS for me.
Having said that, I'm expecting a DEAD CAT bounce up to $117k next, and this is my bias until it closes below the 200 MA. Then I will flip like a coin and become bearish. 200 MA is my BULL/BEAR boundary, in a nutshell.
So, LONGS only from the $100k zone, SHORTS only from $117k.
Also, Bitcoin need volumes in the next couple of days otherwise I see $100k soon.
💙👽

... don t wanna say that... but...... don t wanna say that... but... green trend line is broken... we can see rejection on Daily chart... on 4H you can see collision in 61% Fibonacci .... nothing good... be careful...
... comment your opinion

BTC Next Target $113K–$116K?If CRYPTOCAP:BTC holds above the $109,000 – $110,000 range, we’re likely to see a bullish continuation toward the $113,000 – $116,000 zones in the coming days.

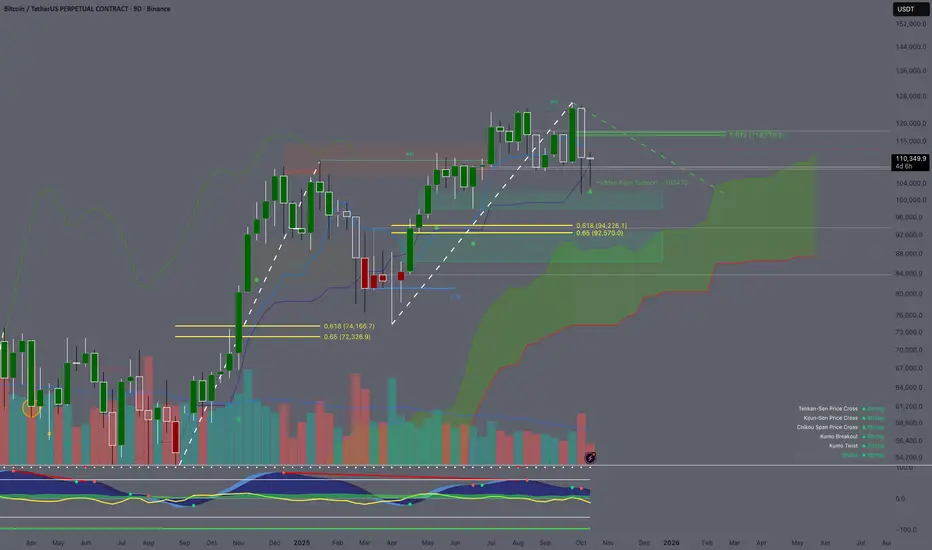
9D Timeframe Analysis using Ichimoku Cloud / Fib/ ICT
Price Action: The candle is pushing north and attempting to turn into a green candle. If the candle successfully turns green and creates a big long wick. The candle can be the support candle for this bullish. The candle won't be closed until this Friday night. Since the candle already discovered the south side and created long wicks. If the candle turns green we will experience the new discovery price on the north side.
Ichimoku Cloud: The price is currently trading above the Kijun-Sen ($109,454.3). If the price continues trading above this level. The trend is validated by the Kijiun-Sen. The Kijun-Sen sometimes plays a role such as a healthy pull back point where you can enter for a long position or a confirmation of a trend. The prices usually pulled back to this line after all time high. Price usually consolidated between (above/below) the lines before the pump in a bull market. The Kijin-Sen is also pushing upward which is a bullish sign but the Tenkan-Sen is flattened out. When the Tenkan-Sen is flat out, the price tends to trade sideways or we can say that the momentum has reduced. Cloud A is still shifting upward while Cloud B has flatted. Cloud A shifting upward means the momentum is still there but the current momentum which is the Tenkan-sen is flat.
Fibonacci: I drawed a fibonacci from $126208.5 to $101.516.5. The all time high point to the 20 billions liquidated event in crypto space. 1 candle made all time high and 1 candle flash crashed to the fair value gap. With the fibonacci, the 0.618 and 0.65 are showing $116,776.2 and $117,566.3. If the low range fib is the bottom then the price has to retrace back to 0.618 in others to continue the massive sell off. So this is playing a key level on the bears for short.
Fair Value Gaps (FVGs): There is a fair value gap when I draw a fip from the previous low in April to the all time high end of September. There is a fair value gap at the 0.65 fib level. Which shows that if the price is retraced back to that level. We are sill in the up trend in favor of the bull
Cipher B: The vwap is trading below money flow and momentum. The Money flow has flatted out while momentum is going down. This is not a good sign because the vwap is pointing south and trading below moneyflow which could lead to the consolidation. The consolidation is not always bad but shows that the trend is cooling down.
Key Levels: 0.618 from bull and bear. If the price is dropped to the fair value gap which is $94.226.1. The actual fair value gap at 0.65 not 0.618 but those levels go together. We will call 126208.5 the top. But if the price is defense above the Kinjun-Sen and does not retrace at the 0.618 from the high to the wick then we are not at the top yet.
Outlook: The change in Tenkan-Sen and Kijun-Sen. The shift of direction in those will be first noticed before anything other factors. Also price trading above/below/between those levels as well.
BTCUSDT — Don’t Try to Catch the BottomBitcoin looks ready to test its local low — or even break it.
In any case, don’t try to catch the bottom — the second leg down may come as a “bonus.”
🎯 Target: 106,000
❌ Invalidation: shown on the chart
The overall structure remains bearish, and I’m watching for confirmation before any potential reversal

Bitcoin BTC Analysis - PM NY Session
Bullish Bitcoin Analysis – PM Session 💰🐂
Recent price action on the 1-hour timeframe (H1) has shown weak candle closures, indicating a failure to achieve significant displacement.
However, we observed a recent sweep of the previous daily high (PDH), followed by a strong close above that level.
This move led to a market structure shift (MSS), suggesting a potential transition to a bullish trend.
With this bullish bias in mind, I have identified a key Fibonacci range that aligns with several confluences supporting the bullish outlook.
Notably, there remains an unfilled bullish imbalance (BISI) on the H1 chart, in addition to a nearby H1 order block.
Furthermore, the optimal trade entry (OTE) level aligns closely with the 0.618 Fibonacci retracement, further strengthening the case for a long position. - 109 000 is the level we’re looking at 👀

another incredible read of the market here from the MTOPS AIYet another incredible read of the market here from the MTOPS AI, demonstrating pinpoint accuracy in its latest Bitcoin forecast.
The AI's analysis continues to outperform, capturing crucial shifts and ensuring top-tier results for traders.

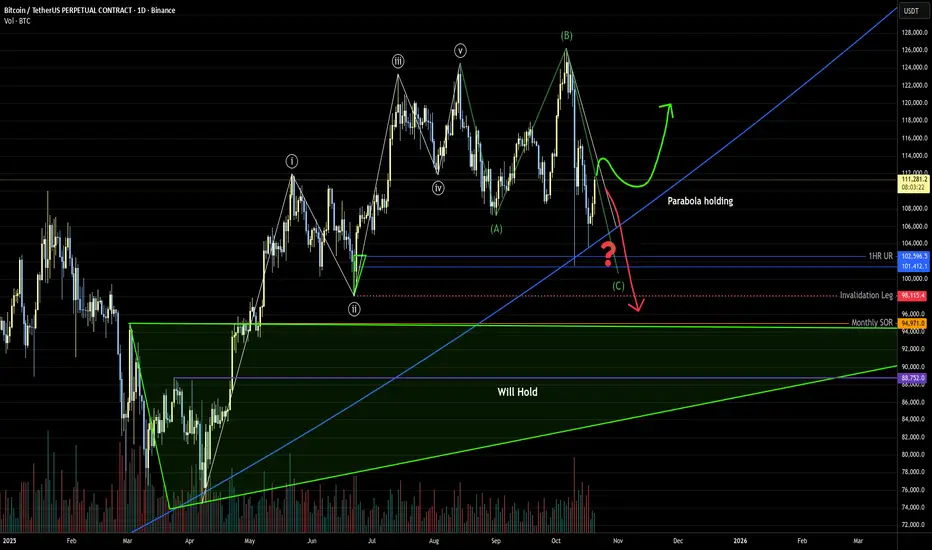
Bitcoin Overall: Not that ScaryLooking at this chart, I just don't see much of a reason to be scared (October..Halloween). BTC has had a long slow period. The big volatility is coming, the question only is--which direction. Given the macro and the chart, I expect some more upside after the current consolidation plays out. There could be 1 more low in the cards, or we could have experienced the low already.
Invalidation: If BTC breaks below the current 'locked' parabola and does not recover quickly, I will turn bearish. However, I suspect a 'fake out' is very possible. Regardless, the bottom range should hold in either case, with the top of the range holding in the 'fake out' scenario, and lower in the rang holding for the bearish scenario--this is how I will tell what is happening in that case.
---
What seems to be playing out from an Elliott Wave standpoint is a moon scenario of an extended wave 5, with a leading diagonal for wave 1. We'd currently be on wave 2 or beginnings of wave 3. Honestly, it's a little hard to believe--but then I look at the gold chart--that thing has gone parabolic as well. BTC has some similarity to gold in that it's a safe-haven type of asset (for the more risk tolerant!). Given many who are dissatisfied/alarmed with the US's policies, I can definitely see these assets continuing to be bid for the time being.
This would be a departure from prior cycles, in that this cycle would be longer than 4 years essentially. Many have long speculated that the halvings will effect the asset less and less--after all, 20 million btc have been mined with only 1 million to go for the rest of its life. The altcoins haven't gotten much love yet. This is simply not how a bull market typically ends--definitely not much euphoria!
New Bullish Trend About To Start Toward a 136,330$📥 Nothing has changed from my previous update — Bitcoin moved exactly as I expected
👉 The price touched the trend line and support area, bounced, and is now trading above the crucial 107k resistance level
📈 I expect a bullish continuation from here toward 123K as the top of the channel, followed by 136,330$ as the main target

#BTC reaches the divergence zone📊#BTC reaches the divergence zone✔️
🧠From a structural perspective, we rebounded from the overlapping support zone at 103588 and continued the bullish trend, gaining over $8,000. We've now reached a critical level where bulls and bears are battling. Since we've already seen strong returns and a pullback is possible, we've closed our long position.
➡️If the price can pull back to and stabilize near the rising trend support line today, we might consider looking for some long positions. There's a desirable red target zone to reach above.
➡️If there's no pullback and we directly attack the bearish defense, we can use a small position to look for some shorts.
⚠️Note: Both ups and downs in the divergence zone are normal. Only after breaking out of this zone can we find suitable trading opportunities. Don't forget risk management!
🤜If you like my analysis, please like 💖 and share 💬
BITGET:BTCUSDT.P

TradeCityPro | Bitcoin Daily Analysis #201👋 Welcome to TradeCity Pro!
Let’s dive into Bitcoin analysis—its bullish trend seems to have started again, so it’s very important to analyze it well for the new week.
⏳ 1-Hour Timeframe
Yesterday, Bitcoin formed a range box between 106319 and 107301, and by breaking the top of this box, it began an upward move.
📊 After breaking this box, buying volume increased sharply, and after a pullback to this area, the move continued up to 111645.
✔️ Now the price has returned above the 109000 zone, but it still hasn’t managed to hold above this area.
⭐ With a break of 111645, we can confirm that price has stabilized above the 109000 zone.
🔍 In that case, we can enter a long position on the break of 111645; and at the same time, we’ll confirm that the break of 109000 was a fake-out.
💥 The trigger on the RSI is the 74.53 level. With RSI entering Overbought and breaking 74.53, the next bullish leg can begin.
❌ Disclaimer ❌
Trading futures is highly risky and dangerous. If you're not an expert, these triggers may not be suitable for you. You should first learn risk and capital management. You can also use the educational content from this channel.
Finally, these triggers reflect my personal opinions on price action, and the market may move completely against this analysis. So, do your own research before opening any position.

Bitcoin: Possible Scenarios on the Daily Chart🔴 Watch the red line!
If BTC breaks above — bulls take control.
If not — expect another drop.
Always manage your risk around reversal zones! 💥
#Bitcoin #BTC #Crypto #BTCUSD #CryptoTrading #TradingSetup #DailyChart #PriceAction
BTC 20 oct analysisif we can stand in 111 area today, we still can do bullish continuation, but if we can't stand.. possibly we test below 110 area again
BTCUSDT: Short Setup Active Below $110,700Hello everyone, here is my breakdown of the current Bitcoin setup.
Market Analysis
On the 1H timeframe, Bitcoin continues to move inside a descending channel, maintaining a clear bearish structure.
After multiple tests and breakouts, the price is still unable to break through the Resistance Area around $110,700, which remains a strong supply zone.
Recently, we saw a fake breakout, followed by a return below the resistance area — confirming that buyers are losing strength. Currently, the price is forming a range near the Support Zone ($104,500–$105,000), which indicates a short-term consolidation phase before a possible next move.
My Scenario & Strategy
I expect that after the range is broken to the downside, BTC will continue its decline toward the Support Zone ($104,500). If this level fails to hold, the next potential target will be the lower boundary of the descending channel around $102,300.
However, a breakout and close above $110,700 would invalidate the bearish scenario and could indicate a shift in market structure.
That's the setup I'm tracking. Thank you for your attention, and always manage your risk.

#BTCUSDT 4H ChartPrice has moved up and left a 4h demand zone at 107k. MACD is starting to show some bullish weakness, RSI is bought and EMAs are neutral. Price is expected to reach the 100MA before potentially retracing towards this demand zone.

Bulls are Back Major Support Reclaimed CRYPTO:BTCUSD
Market Analysis: BTC
BTC has shown a strong rebound in recent sessions, successfully reclaiming the major support at $108,000, which had previously acted as a critical breakdown zone. This reclaim confirms a clear shift in short-term momentum, indicating that buyers have regained control after a deep corrective phase. The structure now shows price stabilizing above this reclaimed support and testing the next resistance cluster.
Currently, BTC is trading around $111,000, sitting within a key Support/Consolidation range between $110,400 – $110,216, which is acting as the immediate holding base. Sustaining above this zone will be essential for maintaining bullish pressure, as it serves as the first structural demand level after the breakout.
The next immediate upside challenge lies between $112,828 – $113,000, marked as the 1st Resistance zone. This area represents a prior breakdown level and is likely to attract short-term profit-taking or seller interest. A clean breakout and sustained close above this level could open the path toward the 2nd Resistance at $114,175, where the market may briefly consolidate again before attempting to expand further.
The broader upside target for this structure sits within the Target Range between $117,158 – $117,000, aligning with the top of the recent corrective structure. This zone represents the next potential liquidity sweep area if buyers continue to maintain strength and push the market through the intermediate resistance layers.
On the downside, immediate supports are layered below at $109,264 (2nd Support) and $108,011 (Major Support Reclaimed). Any move back below $108,000 would invalidate the short-term bullish sentiment and could shift the tone back toward a neutral-to-bearish bias.
Overall, BTC’s structure shows healthy recovery momentum with clear signs of reaccumulation after the $108K reclaim. The focus now remains on how price reacts around the $112,800–$113,000 zone — a decisive breakout here could confirm the next leg higher toward the $114K and $117K targets.
🧭 Summary:
Major Support Reclaimed: $108,000 – $108,011
2nd Support: $109,264
1st Support / Consolidation Range: $110,400 – $110,216
1st Resistance: $112,828 – $113,000
2nd Resistance: $114,175
Target Range: $117,158 – $117,000
Market Tone: Bullish bias; reclaim of $108K confirms strength.
Bias: Bullish above $110,200; neutral below $108,000.
Key Focus: Reaction around $113,000 resistance — breakout continuation could extend to $114K and beyond, while rejection may lead to a retest of $110K support.

FOMC ahead: tactical plan between 106k and 113.5k__________________________________________________________________________________
Market Overview
__________________________________________________________________________________
BTC rebounded from the 106k area after a liquidation flush and is pushing into a dense HTF supply (111,800–113,500). Momentum is improving intraday but capped below 113.5k within a mildly risk-off backdrop into the FOMC.
Momentum: 📈 Slightly bullish intraday, but broadly range-bound while 113.5k caps.
Key levels:
- Resistances (4H/1D): 111,800–112,300; 113,500; 118,000–120,000.
- Supports (2H/1D): 110,200–110,600; 109,400–109,800; 106,000–106,800.
Volumes: Moderate on the bounce; extreme prints belong to the prior selloff (HTF).
Multi-timeframe signals: 1D/12H/6H/4H/2H = neutral sell ; 1H/30m/15m = neutral buy . LTFs push into 111.9–112.3k, but HTFs remain constrained below 113.5k with non-expansive volume.
Risk On / Risk Off Indicator: NEUTRAL SELL — it contradicts the intraday uptick and favors patience below 113.5k.
__________________________________________________________________________________
Trading Playbook
__________________________________________________________________________________
The dominant setup is a post-flush range below 113.5k: stay tactical, buy only on confirmations, and sell disciplined rejections.
Global bias: Neutral-bearish while ≤113.5k; key invalidation: clean acceptance above 113.5k (HTF).
Opportunities:
- Breakout buy: 4H/12H close-and-hold >113.5k → target 118k then 120k.
- Tactical fade: Sell a clean rejection at 111.8–113.5k → target 110.6k then 109.4k, stop just above 113.9–114k.
- Breakdown sell: Lose 109.4k on volume → target 108.6k then 106k.
Risk zones / invalidations: Confirmed reclaim >113.5k invalidates defensive shorts; loss of 109.4k invalidates rebound longs.
Macro catalysts (Twitter, Perplexity, news):
- FOMC underway: binary volatility; wait for clear validations.
- US spot BTC ETFs: 3-day outflows, negative 7d average → risk-off tilt.
- “Gold fatigue” with mixed risk appetite: rotation narratives possible but unconfirmed.
Action plan:
- Entry: 112.3–113.6k after break/hold (successful retest).
- Stop: 110.8k (below structure).
- TP1/TP2/TP3: 118k / 120k / 124.6–126k.
- Approx R/R: about 1:1.8 to 1:3 depending on retest quality and traction to 120k.
__________________________________________________________________________________
Multi-Timeframe Insights
__________________________________________________________________________________
Overall, HTFs remain capped below 113.5k while LTFs grind into 111.9–112.3k, sustaining a range regime.
1D/12H/6H/4H/2H: Sequence of lower highs below 113.5k; 111.8–112.3k is the gate to convert, with 109.4k then 106k as downside checkpoints if it fails.
1H/30m/15m: Recovery channel into 111.9–112.3k with waning momentum; bullish trigger = acceptance at 112.3k then 113.5k.
Major confluences/divergences: LTF up vs MTF down = chop; moderate bounce volume → need a firm 113.5k reclaim to align TFs higher.
__________________________________________________________________________________
Macro & On-Chain Drivers
__________________________________________________________________________________
The macro tone is cautious (slight risk-off) into the FOMC, with softer ETF flows and a reset on-chain — a mix that calls for technical confirmations.
Macro events: FOMC in progress (potential volatility); yields biased higher; “gold fatigue” headlines; softer China data and EU sanctions chatter on the radar.
Bitcoin analysis: US spot ETF outflows (3-day streak; negative 7d) → headwind for HTF recovery; liquidity is improving but headline-driven; a reclaim above 113.5k would be the needed show of strength.
On-chain data: Historic deleveraging (~$19B), negative funding, ongoing LTH distribution, demand yet to return → reset consistent with a post-flush range.
Expected impact: Neutral-bearish while under 113.5k; a close/acceptance above 113.5k could quickly pivot structure toward 118–120k.
__________________________________________________________________________________
Key Takeaways
__________________________________________________________________________________
Post-liquidation range under HTF resistance, wrapped in a slight risk-off backdrop.
- Trend: neutral to bearish while 113.5k caps; 109.4k and 106k remain the key supports.
- Most relevant setup: breakout buy only on confirmed acceptance >113.5k toward 118–120k; otherwise tactical fades on 111.8–113.5k rejections.
- One key macro: FOMC + ETF outflows reduce odds of a clean breakout without confirmation.
Stay disciplined: let levels decide, size down into FOMC, and demand volume on any breakout.

Analytics: Market outlook and forecasts
📈 WHAT HAPPENED?
Last week, Bitcoin experienced another wave of decline, but didn’t reach the low of the previous dump. On Friday, there was a volume anomaly at $105,000, after which a correction was expected to $108,000. As a result, we got into a sideways movement at these values, and the seller's activity didn’t resume.
💼 WHAT WILL HAPPEN: OR NOT?
On the hourly timeframe, a trend reversal to the upside has been recorded. We’re currently testing a significant volume sales zone, and the slowdown in price movement (price action) indicates a likely correction. Our future tactics will depend on the dynamics of this correction: whether to join the longs or stay on the sidelines.
Two support zones have formed below the current price, and if there is a reaction, testing these zones will serve as a buy signal. If the situation unfolds favorably, the $116,000 level may be tested this week. If the buyer doesn’t show any activity, the priority scenario shifts towards sales, and we expect a decline to the level of $97,000.
Buy Zones:
• $107,300–$106,300 (accumulated volumes)
• $105,600–$104,500 (volume anomalies)
• $97,000–$93,000 (major volume zone)
Sell Zones:
• $110,000–$113,000 (accumulated volumes)
• $114,400–$115,600 (local volume zone)
• $120,900–$124,000 (major volume zone)
📰 IMPORTANT DATES
This week, we’re following these macroeconomic events:
• October 22, Wednesday, 6:00 (UTC) — publication of the UK Consumer Price Index for September;
• October 23, Thursday, 12:30 (UTC) — publication of the number of initial jobless claims in the United States;
• October 23, Thursday, 14:00 (UTC) — publication of data on U.S. home sales for September;
• October 24, Friday, 12:30 (UTC) — publication of the US Consumer Price Index for September;
• October 24, Friday, 13:45 (UTC) — publication of the US Service and Manufacturing Business Activity Index for October;
• October 24, Friday, 14:00 (UTC) — publication of US new home sales data for September.
*This post is not a financial recommendation. Make decisions based on your own experience.
#analytics

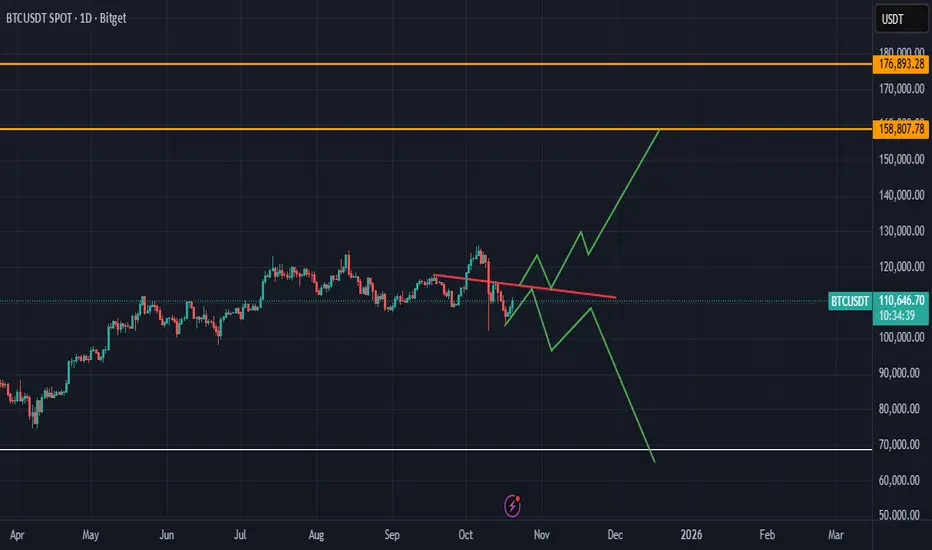
A diamond-shaped pattern is forming on the 4-hour chart1-week range: Resistance at 116,000 and support at 108,000
4-hour range: Resistance at 126,000 and support at 102,000
A short position can be planned near 116,000, as the next potential move could target 75,000.
In the previous bear market, it took roughly 365 candles from the top to the bottom. If the current top is 126,000, there’s a strong possibility this bearish trend could continue until around November 2026, when the bottom might form near 25,000 — a price level ideal for accumulation by large players.
Remember: Smart money never buys at the highs — those levels are usually traps. Good luck.
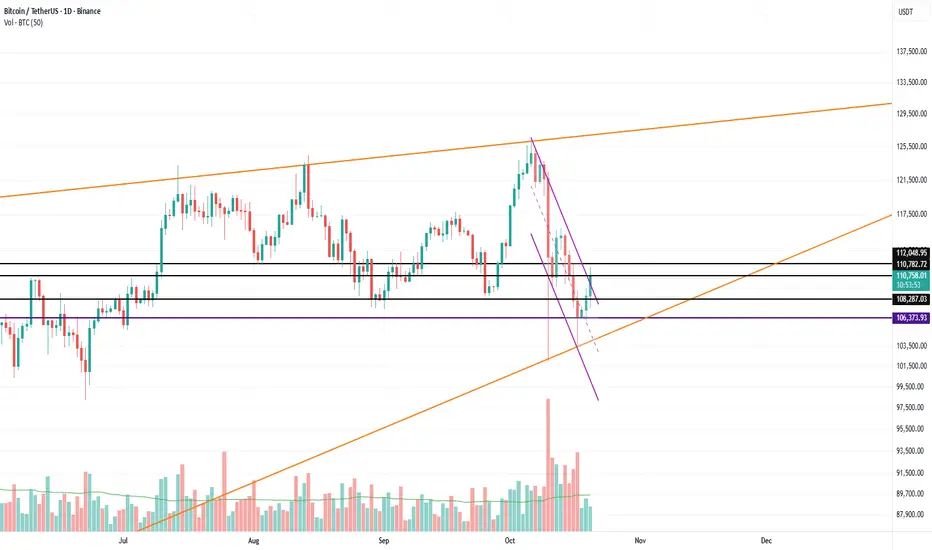
Bitcoin (BTC/USDT) — Key Support Holding After Capitulation MoveBitcoin has been highly volatile over the past week following a strong capitulation move and subsequent rebound. Price action is now resting on critical daily support at $106,000, which will determine whether a larger bounce unfolds or a deeper correction develops.
Key Technical Points:
Support: $106,000 daily level
Resistance: $113,000 (POC + 0.618 Fibonacci)
Bias: Oversold bounce potential
From a structural perspective, the $106,000 region represents a key inflection point. Holding this level could allow for a technical oversold bounce toward the point of control and 0.618 Fibonacci retracement, where resistance is expected to intensify.
Should price reject from that confluence region, it would likely trigger another downward rotation toward sub-$100,000 levels. For now, the bullish case depends on whether Bitcoin can sustain above this crucial support and convert the bounce into momentum.
Overall, the next few sessions will be critical in defining whether this recovery phase expands or fades into continuation.

#BTC reaches support zone, cautious rebound📊#BTC reaches support zone, cautious rebound📈
🧠From a structural perspective, the ideal target area for the bearish cup-and-handle pattern has been achieved, so we should be wary of the risk of a rebound.
➡️After hitting the overlapping support at 103,588, the price rebounded by over $3,000, indicating that the winning rate has been reached. Next, we need to see if the price can stabilize here before continuing to rise. ☕️
⚠️Note that even if we break below the low L, there is a rising channel below to provide support, so don't chase the short here.
🤜If you like my analysis, please like 💖 and share 💬
BITGET:BTCUSDT.P

Bitcoin (BTC): 200EMA Working Out Well | Expecting BounceMonday looks pretty good, where after a weekend full of liquidity hunting, price is finally showing some kind of recovery, which, by the way, if buyers manage to secure that push, then most likely we will see a sharp movement to upper zones; that's what we are expecting.
P.S but be aware we are not yet fully outside the zone of liquidity; buyers haveo secure the 100EMA for confirmation here.
Swallow Academy
