Bitcoin (BTC): 200EMA Working Out Well | Expecting BounceMonday looks pretty good, where after a weekend full of liquidity hunting, price is finally showing some kind of recovery, which, by the way, if buyers manage to secure that push, then most likely we will see a sharp movement to upper zones; that's what we are expecting.
P.S but be aware we are not yet fully outside the zone of liquidity; buyers haveo secure the 100EMA for confirmation here.
Swallow Academy
Trade ideas

BTCUSDT — Sweep Zones Map (Post-London Update)🧭 BTCUSDT — Sweep Zones Map (Post-London Update)
The wolves woke up early today. After the weekend drift, Bitcoin is back defending its mid-range, and the tape’s showing more intention than hesitation. Let’s dissect the layers 👇
1️⃣ Market Structure (W → 2D → 12H)
• Weekly: Structure remains bullish — last HH ≈ $123K, HL ≈ $94K. No violation yet.
• 2D: Clean rejection from mid-supply ($127K → $107K), now retesting $108–110K as mid-range support.
• 12H: Liquidity sweep under $107K, reclaim candle closed above $110K → short-term BOS confirmed.
2️⃣ Sweep Zones
💚 Support Zone: $106K → $108K — prior liquidity pocket aligning with POC. If bulls defend, targets extend to $115–118K.
❤️ Resistance Zone: $117K → $121K — unmitigated supply and heavy short clusters (Binance + Bybit). A clean break opens $125K+ territory.
3️⃣ Orderflow Snapshot
⚙️ Derivatives Snapshot (visual interpretation — incomplete data from Velo)
• Funding back to neutral after deep negative skew (-0.02 → 0.01 %).
• OI recovering ≈ +2.5 B since Sunday’s close.
• CVD still negative but curling upward — spot demand quietly absorbing.
• Liquidity pools resting below $106K and above $117K → potential sweep zones ahead.
4️⃣ Footprint Context (12H / 3D)
• Strong sell-side absorption at $108K POC; delta flipped positive the next candle (3× imbalance).
• 3D footprint still shows prior absorption active → buyers defended the same zone twice.
• Volume compression = volatility coil → expect breakout behavior within 12–24 hours.
5️⃣ Execution Scenarios
🟩 Bull Path: Hold > $108K → LTF BOS confirmation → targets $117K → $121K.
🟥 Bear Path: Lose $106K close → flush toward $101–102K liquidity pocket before reversal attempts.
📊 Bias: Neutral-to-Bullish (short-term reclaim confirmed)
🎯 Focus: Reaction between $108K–$110K. Pullback entries only after 12H displacement retest.
🔥 BTC holding mid-range while spot absorption rises and funding normalizes = constructive base forming into Q4.
⚔️ Candle Craft | Signal. Structure. Execution.

Bitcoin (BTC): Week Starting Off Strong | Time For BullsFinally a week of recovery, where price is now back-testing the middle line of Bollinger Bands. Now every once in a while price has those accumulation zones (blue zones below the middle line of BB), which we consider as the last step before another break of local highs.
The game plan is simple: we wait for bulls to properly secure again that bollinger bands line and once they do so, we will be expecting another bullish movement, potentially towards our final target of $150K.
Swallow Academy

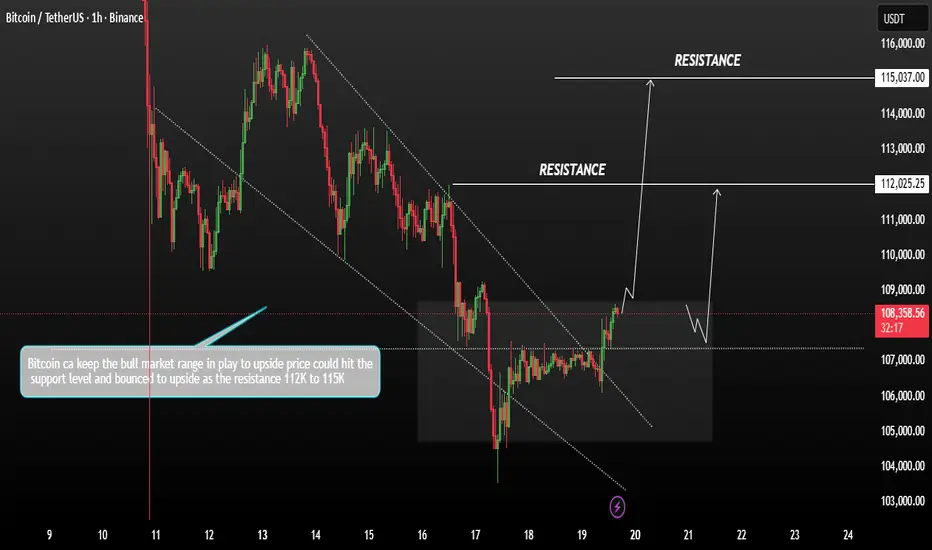
BTC/USDT: Bearish Channel Holds as Price Faces Key ResistanceBTC/USDT remains under bearish pressure, with the recent rebound from 102K facing resistance near the 114K–115K zone. Price action continues to respect the descending channel, reinforcing that sellers remain in control.
A rejection at the trendline could trigger another bearish leg toward 107.5K, with potential to revisit 102K if selling momentum intensifies. As lower highs continue to form below resistance, the broader bias favors further downside.

BTC recovers, positive at the end of OctoberBTC Daily Analysis
Price recently swept liquidity below the key support zone around 108,000–106,000, forming a clear Liquidity Sweep Zone (LQ Sweep). This move indicates that the market collected stop-losses and liquidity from previous lows before showing a strong bullish reaction.
The recovery from this area suggests a potential short-term reversal as buyers step in to defend the lower trendline of the ascending channel. The confluence between the Liquidity Sweep Zone and the trendline support strengthens the probability of a bullish continuation.
In the coming sessions, if BTC maintains momentum above 110,000–111,000, the next upside targets will be:
First resistance: 115,500–116,000
Major resistance zone: 120,000–122,000
A clean break and retest of the 115,500 zone would likely confirm the continuation scenario toward the upper boundary of the channel near 125,000–126,000.
Summary:
Structure: Bullish reaction from key liquidity zone
Bias: Short-term bullish as long as 108,000 support holds
Targets: 115,500 → 122,000 → 126,000
Invalidation: A daily close below 106,000 would negate the bullish setup

BTC Scenario (!)
There are 2 uptrend channels on the chart. Bitcoin price has lost the upper channel past week. Now it's rising for the last 3 days. It has arrived to retest zone right at $111600
Bearish Scenario
If the price can't surpass $111600- $111900, it will use the lower channel and that means it would goes to $95K.

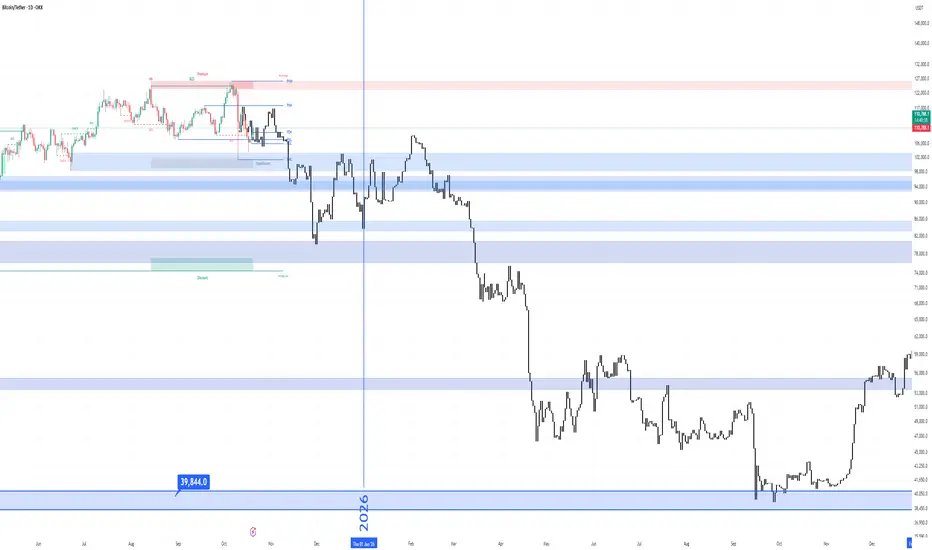
Bitcoin Roadmap Until 2029 | Halving Cycle ProjectionThis analysis illustrates Bitcoin’s potential price trajectory through the upcoming halving cycle.
Key Support Zone: 39,800 – 40,000 USD
Halving Date: 2028
Projection: Historical cycle patterns suggest a potential continuation toward 250K–300K USD range before the next major correction.
Mid-term Correction Expectation: Around late 2026 to 2027 before the next bullish expansion.
🔹 Based on past halvings, each cycle tends to follow a 12-18 month accumulation, parabolic rise, and correction phase.
🔹 Long-term investors might focus on accumulation near the blue support zone.
#Bitcoin #BTCUSDT #CryptoAnalysis #HalvingCycle #SmartMoneyConcepts
روند احتمالی بیتکوین تا سال ۲۰۲۹
در این تحلیل، چرخهی بعدی هاوینگ بیتکوین در سال ۲۰۲۸ و ناحیهی حمایتی مهم در محدودهی ۳۹٬۸۴۴ دلار مشخص شده است.
بر اساس الگوهای تاریخی، انتظار میرود پس از اصلاح میانمدت بین سالهای ۲۰۲۶ تا ۲۰۲۷، روند صعودی بزرگ بعدی آغاز شود که میتواند بیتکوین را به محدودهی ۲۵۰ تا ۳۰۰ هزار دلار برساند.
🔹 دورهی هاوینگ معمولاً با فازهای زیر همراه است:
۱️⃣ انباشت (۱۲ تا ۱۸ ماه قبل از هاوینگ)
۲️⃣ رشد پارابولیک
۳️⃣ اصلاح چرخهای
#Bitcoin #BTC #تحلیل_بیتکوین #Crypto #Halving #TradingView #farhadlotfizad
20/10/25 Weekly OutlookLast weeks high: $115,965.44
Last weeks low: $103,546.52
Midpoint: $109,755.98
Following the flash crash of two weeks ago, Bitcoin opted for the "fill the wick" pattern last week with a steady continuation of the downtrend printing a low for the week 1.5% shy of completely backfilling the entire wick.
Because of the aggressive nature of the immediate recovery, I would estimate that a large number of stop losses would be placed just under the bottom of the flash crash wick and so as price approached that level, buyers stepped in to move price away from that danger area. I am still not convinced that $98,000-102,000 area is safe from a revisit, but when is a question I do not have an answer for.
This week we've seen an early move by the bulls to flip a very important $108,000 level. I could see BTC conforming to the weeks range quite strongly as both extremities of the range as well as midpoint line up very well with HTF S/R levels. I think any PA between those levels would give clues as to the strength of both sides, bulls and bears but the important moves will happen around the extremes. Of course the trade war news is a factor still in play as well as CPI later in the week.
This CPI release is also taking place during a government shut down, it's the first CPI on a Friday since 2018 and FOMC (rate cut predicted) takes place just 5 days after with massively reduced data releases due to the Government shut down. This to me is a volatility storm waiting to happen and many participants are going into it blind.
Good luck this week everybody!

#BTC Update:- Are we going lower? Or Higher? Don't miss this!Before jumping into the chart, I’ve got a few words for everyone.
The recent crash has been absolutely brutal. It’s shaken the entire market and, sadly, affected so many lives; some people lost everything, and some couldn’t handle the pain. My heart truly goes out to everyone who suffered. 💔
But remember, the past is behind us. What really matters now is what we do today and how we build our tomorrow.
No one was spared from this storm. It felt like a broad daylight robbery, and if you got hit too — please, stay strong. Don’t give up. Sometimes the market resets itself in the harshest ways to prepare us for the next big move.
Take SUI for example, a solid project that would normally take 6–9 months in a bear market to drop 85%, yet it did that in one single daily candle!
From $3.71 to $0.5597, that’s an 84.9% dump in just one day.
And the worst part? Most people couldn’t even catch those prices because exchanges went crazy.
👉 Moral of the story: It’s not over. Far from it. This might just be the reset we needed before the next leg up.
### Now, about the Bitcoin chart:
BTC crashed hard, but guess what? It bounced right off the support.
That’s a strong sign.
The blue EMA you see on the chart is the 200 DEMA, another bullish signal that tells us there’s still strength in the market.
Keeping it short and simple, we’re likely heading higher from here.
Invalidation: A daily break and close below $103K.
---
I’ll be sharing more altcoin charts soon, so stay tuned.
And to everyone reading this, stay strong, stay grounded, and remember… WAGMI 🙌
We’ve been through worse, and we’ll come out of this even stronger.
If this message resonated with you, don’t forget to hit that ❤️. Let’s keep spreading positivity in this space.

BTC 4H Analysis | Day 5🥳 Hey everyone! Hope you’re doing great! Welcome to SatoshiFrame channel .
✨ Today we’re diving into the 4-Hour Bitcoin analysis. Stay tuned and follow along!
👀 After breaking out of the descending channel and confirming the long setup I explained in the previous post, Bitcoin moved upward and easily broke through its Maker-buyer zone.
🔍 Over the past two market-holiday days, Bitcoin consolidated in a multi-timeframe accumulation phase with a ceiling at $107,356, which was easily breached. The price then advanced toward its higher-level key resistances. It’s now trading between $110,500 and $113,000 — the $113,000 zone is our long trigger since price has struggled there multiple times before. This makes it a bit risky, but if the upward movement continues, the next resistances could be at $115,800 and $120,836.
🧮 Looking at the RSI oscillator, it has comfortably passed the 50 level on the 4-hour chart and is now heading toward the overbought zone, facing a key resistance at 70. This 70 level overlaps with the 50 zone on the daily timeframe, meaning that if RSI enters overbought on the 4-hour, the daily will just be shifting from a bearish swing phase to a long-position momentum phase — so the 70 zone is crucial.
🕯 If you check the lower-volume section of the chart, you’ll notice something interesting: the breakout above the two-day accumulation range came with a clear rise in buy volume, which helped Bitcoin easily break both the resistance area and the descending trendline (the upper boundary of the previous channel). This suggests Bitcoin may soon take a volume or price correction to gain more strength for another upward move.
⏰ During today’s New York session, we might see some strong moves. Remember last week when U.S. investors were selling off their ETF holdings, and the market was hesitant to buy? That fear caused weak participation. This time, we may have a reason to stay active during New York hours as sentiment shifts.
🧠 Here are the two key scenarios to watch:
🟢 Long Position Scenario
Wait for Bitcoin to react either to the micro-buyer zone or to the $113,000 area. If we see a pullback followed by an indecision candle (confirmation setup) touching the SMA-7, that’s our entry cue — ideally with a tighter stop size.
🔴 Short Position Scenario
Ignore shorts for now. Bitcoin already completed its second downward wave with an imbalanced slope, and over the last two days, seller momentum has weakened. Buyers are now driving price through resistance levels, so shorting here would go against the current flow.
❤️ Disclaimer : This analysis is purely based on my personal opinion and I only trade if the stated triggers are activated .

Symmetrical Triangles are high risk to trade within Symmetrical Triangles are high risk to trade within
My advise is to allow it to play out first, and after we have confirmation that it is a Symmetrical Triangle, then lets re-evaluate

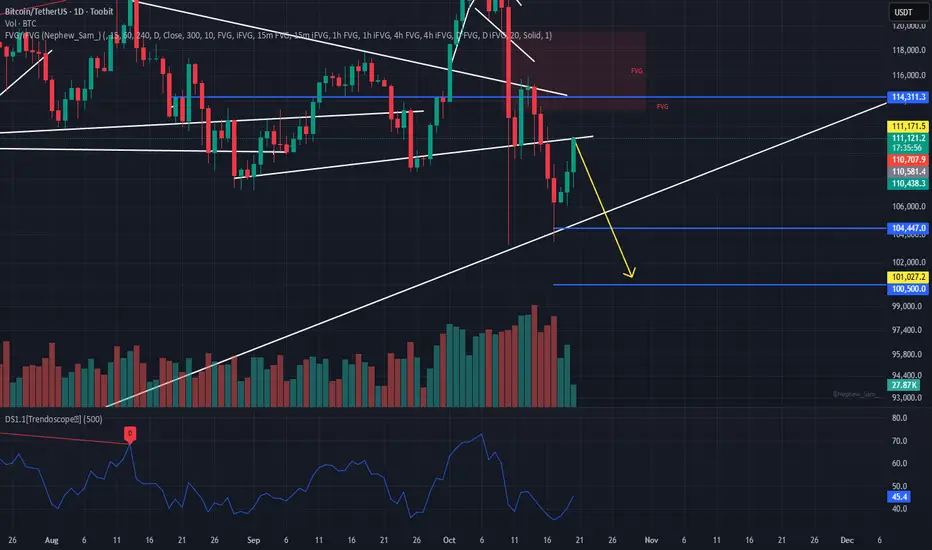
Bitcoin consolidation phase within a broader bullish trendBitcoin is currently in a consolidation phase within a broader bullish trend. The market shows signs of potential continuation to the upside, though short-term corrections remain possible.
If the price closes below 108K Bitcoin could retest lower support levels before rebounding back upward, maintaining the long-term bullish structure Conversely, if Bitcoin holds above 110K and breaks above 112K we may see a new bullish leg toward the 115K resistance zone and possibly beyond.
You may find more detils in the chart.
Trade wisely best of luck buddies.
Ps; Support with like and comments for better analysis Thanks for Supporitng.
Bitcoin Price Outlook: Testing the $97,800 Support ZoneHi there!
Let's analyze Btc!
Bitcoin is currently moving inside a clear descending channel, showing consistent lower highs and lower lows. The price is likely to continue its downward movement until it reaches the daily support area around $97,800.
This zone appears to be a promising area for long-term opportunities. Still, traders should wait for strong confirmation signals before entering, as a reversal will only be valid once momentum shifts from bearish to bullish.

The Bitcoin bearish era has begun (1D)First of all, you should know that in our previous analyses, we had identified a large triangle. However, the market makers created another bullish wave, increasing the chart’s error margin (The scenario you see in the related ideas section.).
This sharp move indicates the beginning of new bearish branches! It is expected that with a pullback to the red zone, the correction will continue, and we will be involved in it for at least a few months.
Closing a daily candle above the invalidation level will invalidate this analysis.
For risk management, please don't forget stop loss and capital management
When we reach the first target, save some profit and then change the stop to entry
Comment if you have any questions
Thank You

btc bulishafter falling again it started to rise and now make area fvg and divergence in RSI and now mabe go to new price and target...

BTC 5-Wave Drop Complete — Watching 114K–117K ZoneLast week, we continued the downward movement. Looking at the CME chart now, we can see a completed 5-wave bearish structure — meaning the price is entering an upward correction phase.
This correction could potentially turn into a new uptrend, so it’s important to watch the price action in the 114K–117K zone. The risk level for this week is 107,575 — if it breaks without a quick recovery, the chances of continued decline increase significantly.
Until then, the goal is to reach and break the previous peak at 116K .

BTC Day of the Dead Halloween Blackswan
secret harmonic
Not guaranted but
theres a chance for a
ZEC/BTC
blackhole
rotation pump
BTC should grind up from here a nice fake bearflag &
make it even pop at halloween climax
If early breakdown safe under 104882.911
Depending on the
blackswan
BTC might def be toast
& MM would be coming to
sink saylors ship & pin him like
the DOTcom bubble where
MSTR lost 99,99%
"The guy who lost his Billions Twice"
@Hanslanda369

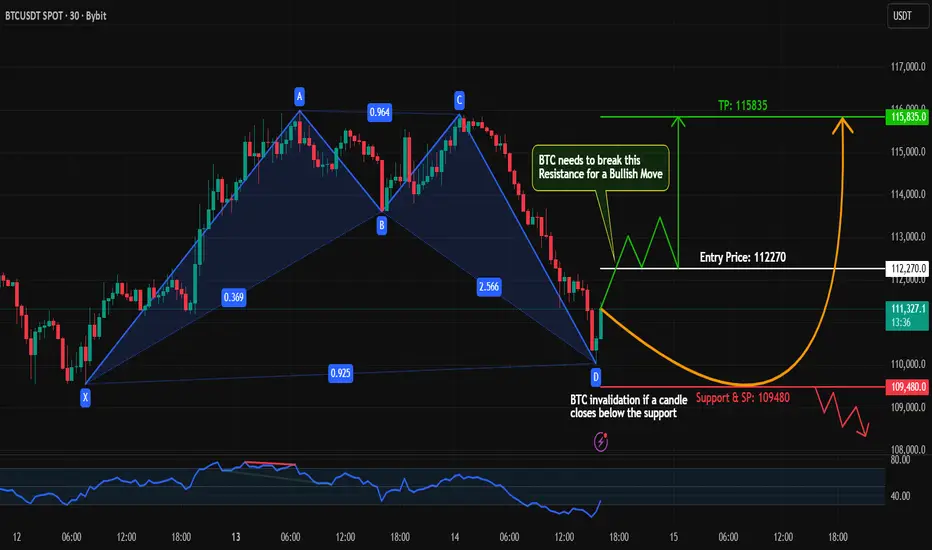
BTC Forming Potential Bullish Reversal | Harmonic Pattern#Bitcoin has been moving in a downtrend, but the market structure is showing early signs of a potential reversal. On the 30-minute timeframe, #BTC is forming a harmonic pattern, which could trigger a strong bullish move once confirmed.
On the 15-minute timeframe, I’m watching for two key confirmations:
Bullish Divergence
Break and Retest of the Resistance Level (highlighted on the chart)
Once both conditions align, I’ll be looking to enter a long position on the retest, following proper risk management.
Patience is key — no early entries until confirmation!
What’s your view on this setup? Do you think #BTC will reverse soon or continue the downtrend? Drop your thoughts below!
#BTC #Bitcoin #Crypto #HarmonicPattern #TechnicalAnalysis #TradingSetup #PriceAction #CryptoTrading #TrendReversal
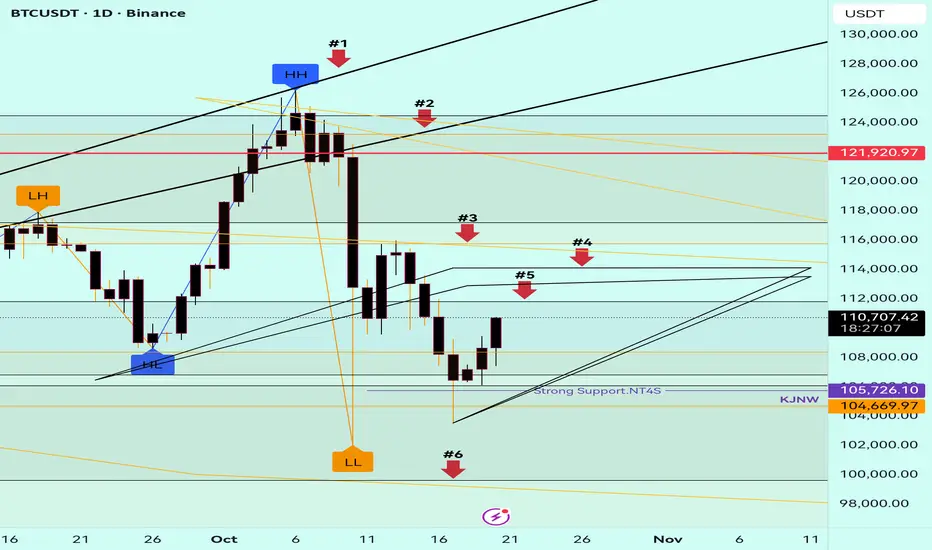
#BITCOIN is Once Again Attempting a Reversal🚀 #BITCOIN is Once Again Attempting a Reversal!
Here’s what we’re watching closely 👇
📈 Bullish Scenario:
If Bitcoin manages to break above Arrow #3, #4, and #5, it could confirm a strong bullish breakout, signaling potential upside momentum and renewed market confidence.
📉 Bearish Scenario:
If the price fails to break those levels, keep an eye on Arrow #6 — this could act as the next strong support zone where a possible rebound might start.
⚡️ If Bitcoin breaks above successfully, the next key resistance levels to watch are Arrow #1 and #2 — where the next major decision point awaits.
💪 Stay focused, stay disciplined — this is where patience and strategy pay off!
#BTC #Crypto #Trading #Reversal #Breakout
BTC/USDT — Volume Strength Returns, Eyes on 110K+ RecoveryBTC/USDT — Volume Strength Returns, Eyes on 110K+ Recovery 🚀
Bitcoin is showing renewed momentum as it re-enters the volume+ zone, signaling stronger market participation after recent consolidation. The move above the low time frame structure confirms short-term strength and suggests a potential continuation to the upside.
Currently, BTC is holding steady around $108.9K, maintaining support within the accumulation range. If momentum continues, a breakout toward $110K+ looks increasingly likely, aligning with short-term recovery signals.
📊 Technical Overview:
Volume Zone: $108K–$109K
Short-Term Target: $111K
Main Resistance: $122.5K
Bias: Positive momentum forming above low time frame
A strong hourly close above $109K would further confirm the shift in trend strength, potentially opening the next leg higher toward $111K–$122K.
📈 Outlook: Bullish short-term structure forming

BTC road to 150k$Up till 27 OCT, dump on rate cut news together with stock market, pick the floor under 98k and hold

THE RETURN OF BTC TO 110K ON WAY..There is high chance in the coming time we can see a BTC breakout return to 110K in the coming time. Today Sunday, can be an important day before the start of the weekly chart.
106K can become an important secure zone for the next increase in volume
